

doi: 10.3390/molecules18089999.
Combination of small molecule microarray and confocal microscopy techniques for live cell staining fluorescent dye discovery
Affiliations
- PMID: 23966084
- PMCID: PMC6270374
- DOI: 10.3390/molecules18089999
Item in Clipboard
Combination of small molecule microarray and confocal microscopy techniques for live cell staining fluorescent dye discovery
Molecules.
.
Abstract
Discovering new fluorochromes is significantly advanced by high-throughput screening (HTS) methods. In the present study a combination of small molecule microarray (SMM) prescreening and confocal laser scanning microscopy (CLSM) was developed in order to discover novel cell staining fluorescent dyes. Compounds with high native fluorescence were selected from a 14,585-member library and further tested on living cells under the microscope. Eleven compartment-specific, cell-permeable (or plasma membrane-targeted) fluorochromes were identified. Their cytotoxicity was tested and found that between 1-10 micromolar range, they were non-toxic even during long-term incubations.
Figures
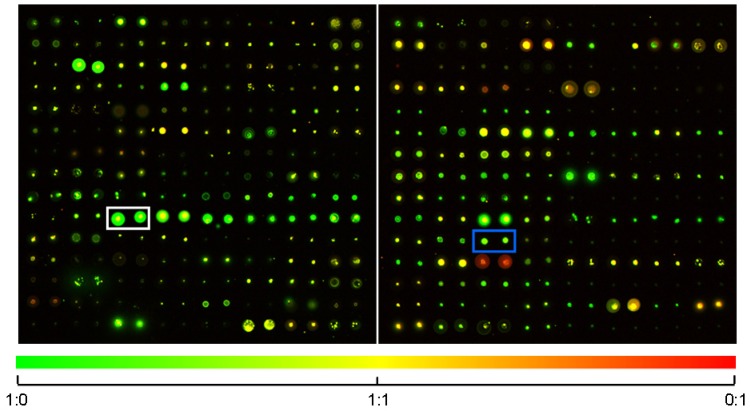
Pseudocolored images of two SMM blocks excited by 532 and 633 nm lasers. Color of the spots derives from the relative emission intensities at 570 and 670 nm (see gradient at the bottom of the Figure). Rectangles show parallel spots of two selected chemicals (white: D10, blue: E5).

Fluorescence emission and intracellular localization of selected chemicals. Fluorescence emission of the tested chemicals (1 h at 37 °C, 10 µM each, except C2 which was 1 µM) were captured in four channels (blue, green, red and far-red) using 405, 488, 543 and 633 nm laser excitation. Fluorescence emissions were also captured after 1 day of incubation at 37 °C (staining after 24 h). Only the image of the brightest fluorescence color paired with the corresponding bright field image was shown for “Staining after 24h” images. Up to three times wider confocal aperture (pinhole) was used for taking “Staining after 24h” images. Control cells were treated with DMSO. Bf: Bright field imaging. Scale bar 10 µm.

Colocalization of chemicals with fluorescent markers. Localization of the chemicals and the fluorescent markers are indicated on Figures. (b–f) Formaldehyde fixed cells were used for colocalization with Oil Red O. Live cell colocalizations were shown in (a and g–l). (l) Laser excitation-induced relocalization of chemical C2 to nucleolus/cytoplasm. NAO: Nonyl acridine orange; FDA: Fluorescein diacetate; H33342: Hoechst 33342; C2*: Photoconverted form of chemical C2. Arrows indicate two nucleoli. Scale bar 10 µm.
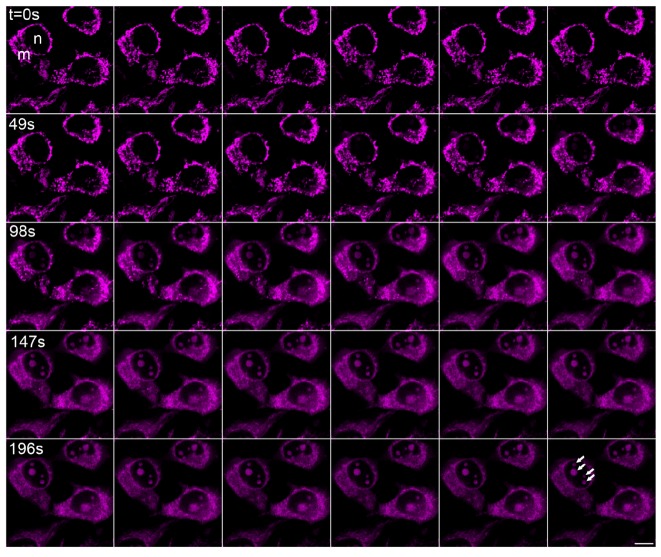
Laser scanning-induced relocalization of chemical C2 from mitochondria to cytoplasm and nucleoli. C2-treated (1 µM) HeLa cells were repeatedly scanned with 633 nm HeNe laser at 50% intensity. Each frame is 7 seconds apart. Elapsed time is shown for every 7th frame. Mitochondria (m) and nucleus (n) of a cell are shown at the first frame. The four nucleoli of the same cell are indicated with arrows at the last frame. Bar 10 µm.

Stability of chemical C2 using low laser intensity settings. 633 nm laser was used at 4% intensity to capture images at indicated time points. Bar 10 µm.

Viability and nuclear morphology analyses of 24 h-treated HeLa cells. FDA (green) labeling of live cells and DAPI (blue) labeling of fixed cells and their corresponding bright field images (black and white transmitted light images) are shown. Arrowheads in C2* and HT samples indicate FDA-negative dead cells and clusters. Arrows show fragmented, apoptotic-like nuclei in C2* and HT samples. C2*: Photoconverted C2; DS: Dimethyl sulfoxide; HT: 4-hydroxytamoxifen. Scale bars of 20 µm are shown in HT samples for both FDA and DAPI image sets.
Similar articles
-
Novel luminescent dyes for confocal laser scanning microscopy used in Trematoda parasite diagnostics.Acta Biochim Pol. 2018;65(3):449-454. doi: 10.18388/abp.2018_2574. Epub 2018 Aug 27. Acta Biochim Pol. 2018. PMID: 30148507
-
Novel dye for detection of callus embryo by confocal laser scanning fluorescence microscopy.Luminescence. 2019 May;34(3):353-359. doi: 10.1002/bio.3616. Epub 2019 Feb 19. Luminescence. 2019. PMID: 30784170
-
Investigation of microbial biofilm structure by laser scanning microscopy.Adv Biochem Eng Biotechnol. 2014;146:1-51. doi: 10.1007/10_2014_272. Adv Biochem Eng Biotechnol. 2014. PMID: 24840778 Review.
-
Quantitative single-molecule imaging by confocal laser scanning microscopy.Proc Natl Acad Sci U S A. 2008 Nov 25;105(47):18176-81. doi: 10.1073/pnas.0809250105. Epub 2008 Nov 14. Proc Natl Acad Sci U S A. 2008. PMID: 19011092 Free PMC article.
-
Confocal laser scanning microscopy.Biotechniques. 1999 Nov;27(5):992-6, 998-1002, 1004. doi: 10.2144/99275ov01. Biotechniques. 1999. PMID: 10572648 Review.
Cited by
-
Lipid droplet binding thalidomide analogs activate endoplasmic reticulum stress and suppress hepatocellular carcinoma in a chemically induced transgenic mouse model.Lipids Health Dis. 2013 Nov 22;12:175. doi: 10.1186/1476-511X-12-175. Lipids Health Dis. 2013. PMID: 24268070 Free PMC article.
-
Quantitative and comparative assessment of dyes and protocols for rapid ex vivo microscopy of fresh tissues.Sci Rep. 2024 Sep 13;14(1):21376. doi: 10.1038/s41598-024-72213-5. Sci Rep. 2024. PMID: 39271788 Free PMC article.
-
AUTEN-67, an autophagy-enhancing drug candidate with potent antiaging and neuroprotective effects.Autophagy. 2016;12(2):273-86. doi: 10.1080/15548627.2015.1082023. Autophagy. 2016. PMID: 26312549 Free PMC article.
References
-
- Henrich S., Salo-Ahen O.M.H., Huang B., Rippmann F.F., Cruciani G., Wade R.C. Computational approaches to identifying and characterizing protein binding sites for ligand design. J. Mol. Recognit. 2010;23:209–219. - PubMed
Publication types
MeSH terms
Substances
LinkOut - more resources
Full Text Sources
Other Literature Sources
