. 2014 Jan 1;23(1):259-67.
doi: 10.1093/hmg/ddt404. Epub 2013 Aug 20.

GWAS of human bitter taste perception identifies new loci and reveals additional complexity of bitter taste genetics

Affiliations

GWAS of human bitter taste perception identifies new loci and reveals additional complexity of bitter taste genetics

Mirko Ledda et al. Hum Mol Genet. .

Abstract

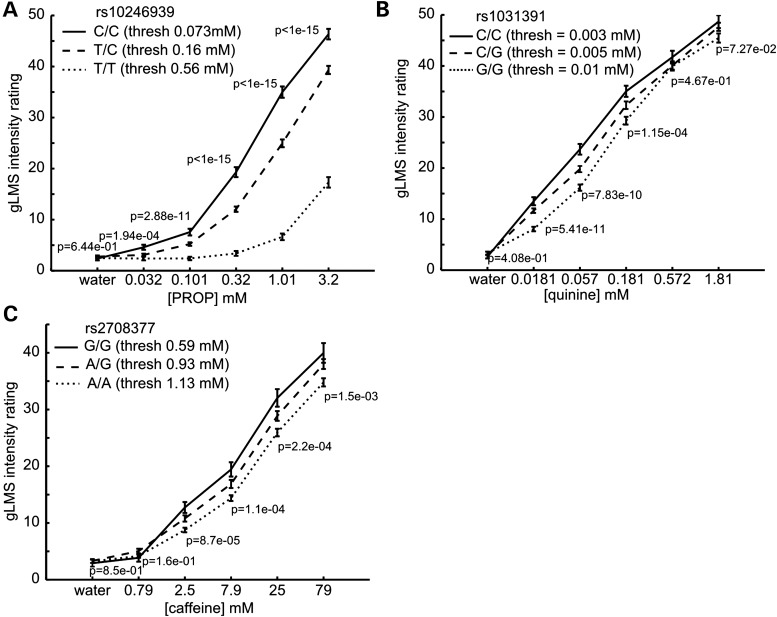
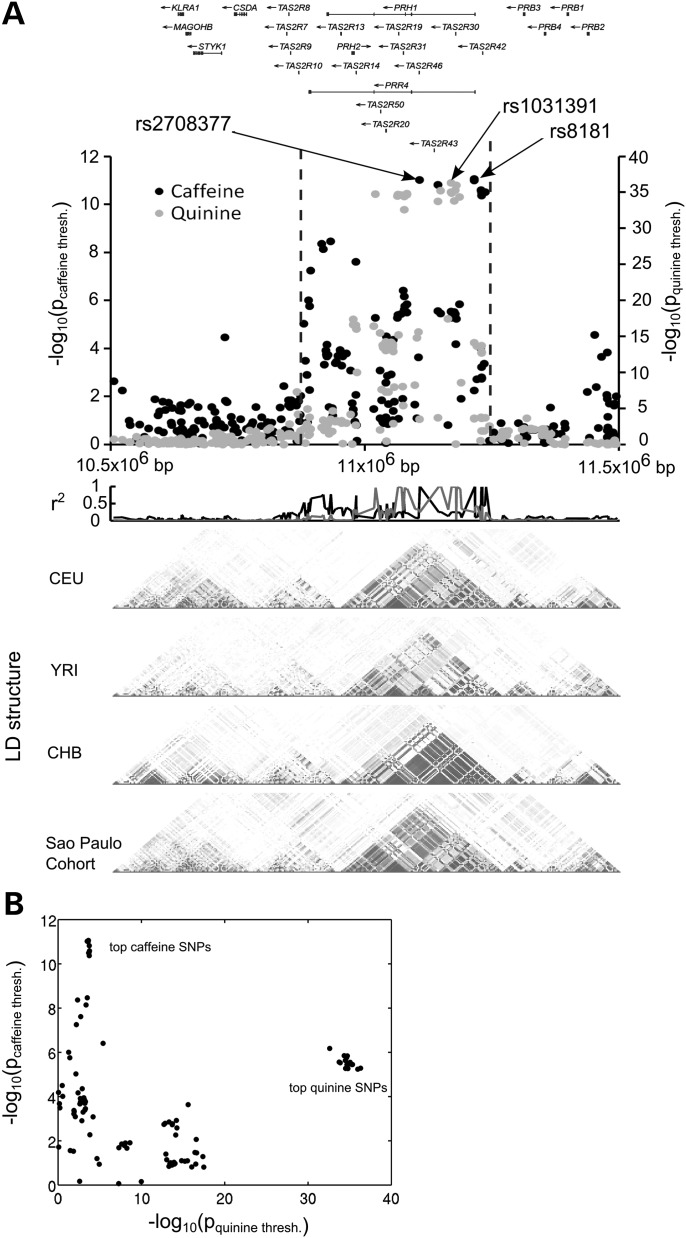
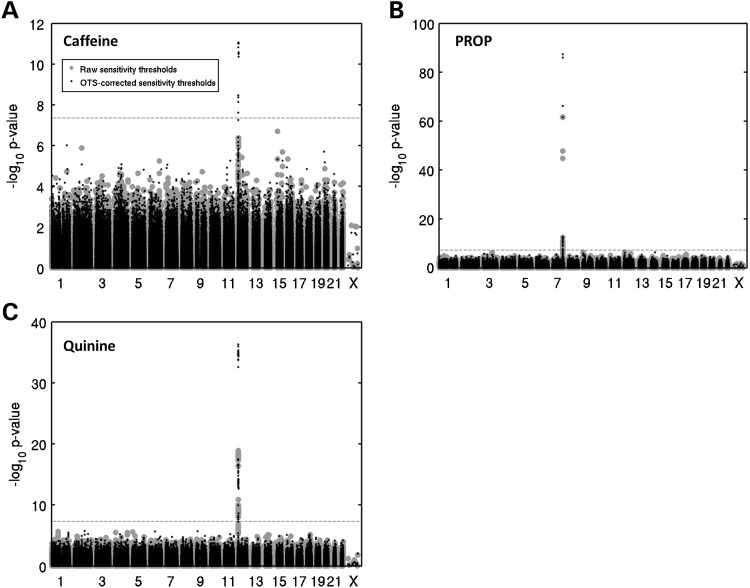
Human perception of bitterness displays pronounced interindividual variation. This phenotypic variation is mirrored by equally pronounced genetic variation in the family of bitter taste receptor genes. To better understand the effects of common genetic variations on human bitter taste perception, we conducted a genome-wide association study on a discovery panel of 504 subjects and a validation panel of 104 subjects from the general population of São Paulo in Brazil. Correction for general taste-sensitivity allowed us to identify a SNP in the cluster of bitter taste receptors on chr12 (10.88- 11.24 Mb, build 36.1) significantly associated (best SNP: rs2708377, P = 5.31 × 10(-13), r(2) = 8.9%, β = -0.12, s.e. = 0.016) with the perceived bitterness of caffeine. This association overlaps with-but is statistically distinct from-the previously identified SNP rs10772420 influencing the perception of quinine bitterness that falls in the same bitter taste cluster. We replicated this association to quinine perception (P = 4.97 × 10(-37), r(2) = 23.2%, β = 0.25, s.e. = 0.020) and additionally found the effect of this genetic locus to be concentration specific with a strong impact on the perception of low, but no impact on the perception of high concentrations of quinine. Our study, thus, furthers our understanding of the complex genetic architecture of bitter taste perception.


Figures

Figure 1.
Figure 1.
Across-phenotype correction boosts association signal for taste detection thresholds. QQ-plots of the GWAS for detection thresholds of PROP (A), quinine (B) and caffeine (C) showing the boost in association strength afforded by cross-phenotype correction. Open circles indicate P-values obtained from GWASs conducted for taste detection thresholds that were corrected only for demographics (gender, age, BMI) and the first 10 principal components of a genetic ancestry analysis. Solid circles indicate P-values obtained when detection thresholds were additionally corrected for overall taste sensitivity.
Figure 2.
Figure 2.
Effect of detection-threshold-associated SNPs on the perceived intensity of suprathreshold compound concentrations. Perceived taste intensities for suprathreshold concentrations of PROP (A), quinine (B) and caffeine (C) as a function of compound concentration and subjects' genotypes at the top-associated SNP for the respective compound-detection-threshold GWASs. Error bars show the standard error of intensity ratings and a P-value is given for ANOVA tests of across-genotype differences at each compound concentration.
Figure 3.
Figure 3.
Caffeine and quinine detection thresholds are associated with distinct loci. (A) Local Manhattan plot of caffeine (black) and quinine (gray) detection-threshold loci showing local genes and genotype r2 of each SNP to the top-associated SNP for caffeine- (black) and quinine-detection thresholds (gray), respectively. Below are shown the LD block structures of the region in the central European (CEU) West African Yoruba (YRI) and Han Chinese (CHB) populations from the Hapmap data set together with the LD block structure found in the São Paulo cohort from our study. (B) Scatter plot of association P-values for quinine and caffeine for each SNP in the chromosome region between the dotted vertical lines on the local Manhattan plot (A).
Figure 4.
Figure 4.
Caffeine detection thresholds are associated with a locus on chromosome 12 and OTS correction P-value boosts are loci specific. Manhattan plots from the GWAS analysis of log10-transformed (A) caffeine, (B) PROP and (C) quinine detection thresholds for the 504 subjects of the discovery panel shows a pronounced association at the beginning of chromosome 12 for both caffeine and quinine and a locus on chromosome 7 for PROP. Correction for OTS boosted SNPs only within associated loci for all three bitter compounds. Gray points and black triangles represent, respectively, P-values before and after correction for OTS while dashed lines represent thresholds for GWAS significance.

References

    1. Drewnowski A., Henderson S.A., Barratt-Fornell A. Genetic taste markers and food preferences. Drug Metab. Dispos. 2001;29:535–538. - PubMed
    1. Drewnowski A., Henderson S.A., Shore A.B. Taste responses to naringin, a flavonoid, and the acceptance of grapefruit juice are related to genetic sensitivity to 6-n-propylthiouracil. Am. J. Clin. Nutr. 1997;66:391–397. - PubMed
    1. Wiener A., Shudler M., Levit A., Niv M.Y. BitterDB: a database of bitter compounds. Nucleic Acids Res. 2012;40:D413–D419. - PMC - PubMed
    1. Brockhoff A., Behrens M., Roudnitzky N., Appendino G., Avonto C., Meyerhof W. Receptor agonism and antagonism of dietary bitter compounds. J. Neurosci. 2011;31:14775–14782. - PMC - PubMed
    1. Chandrashekar J., Hoon M.A., Ryba N.J., Zuker C.S. The receptors and cells for mammalian taste. Nature. 2006;444:288–294. - PubMed

Publication types