. 2013 Aug;18(8):86012.
doi: 10.1117/1.JBO.18.8.086012.

Mitigating fluorescence spectral overlap in wide-field endoscopic imaging

Affiliations

Mitigating fluorescence spectral overlap in wide-field endoscopic imaging

Chenying Yang et al. J Biomed Opt. 2013 Aug.

Abstract

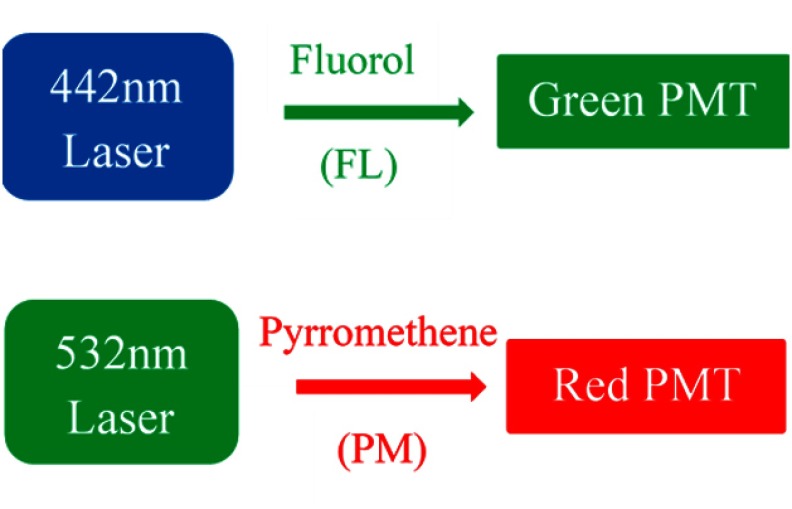
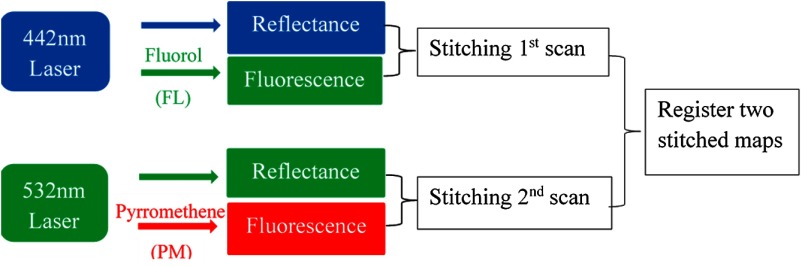
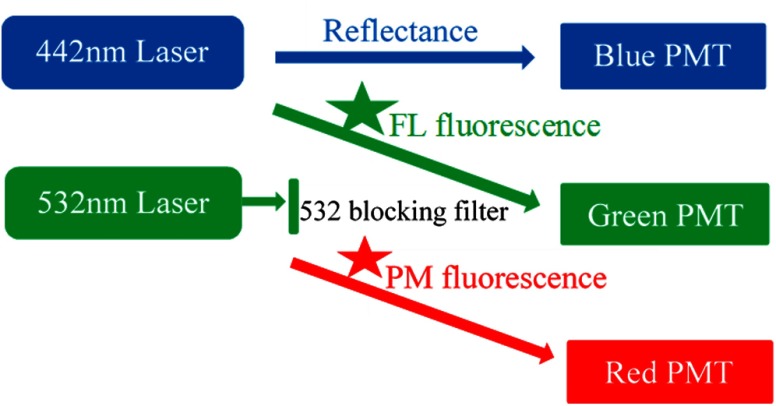
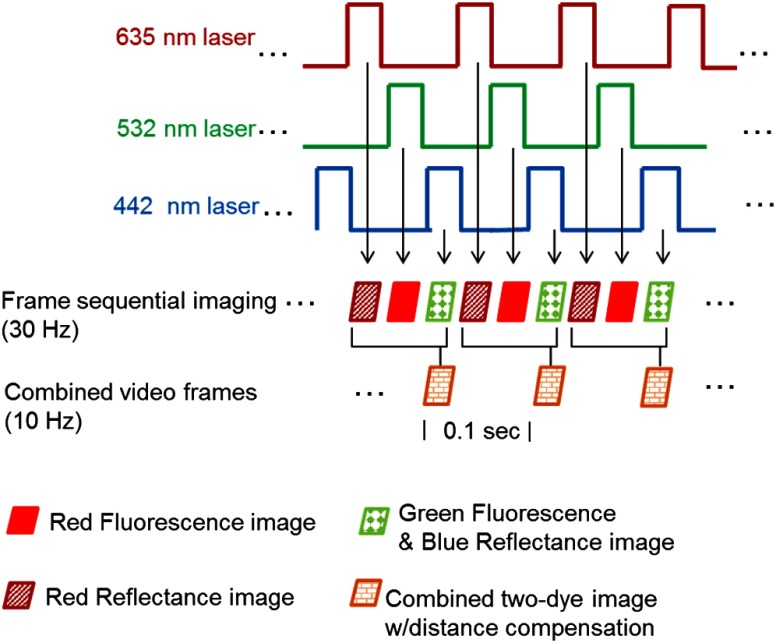
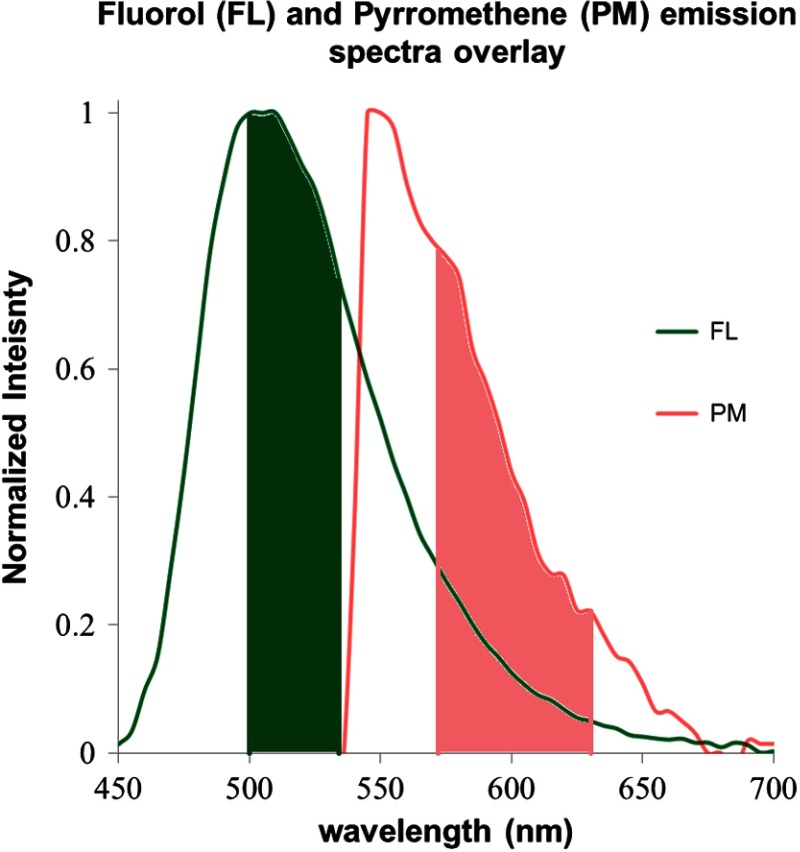
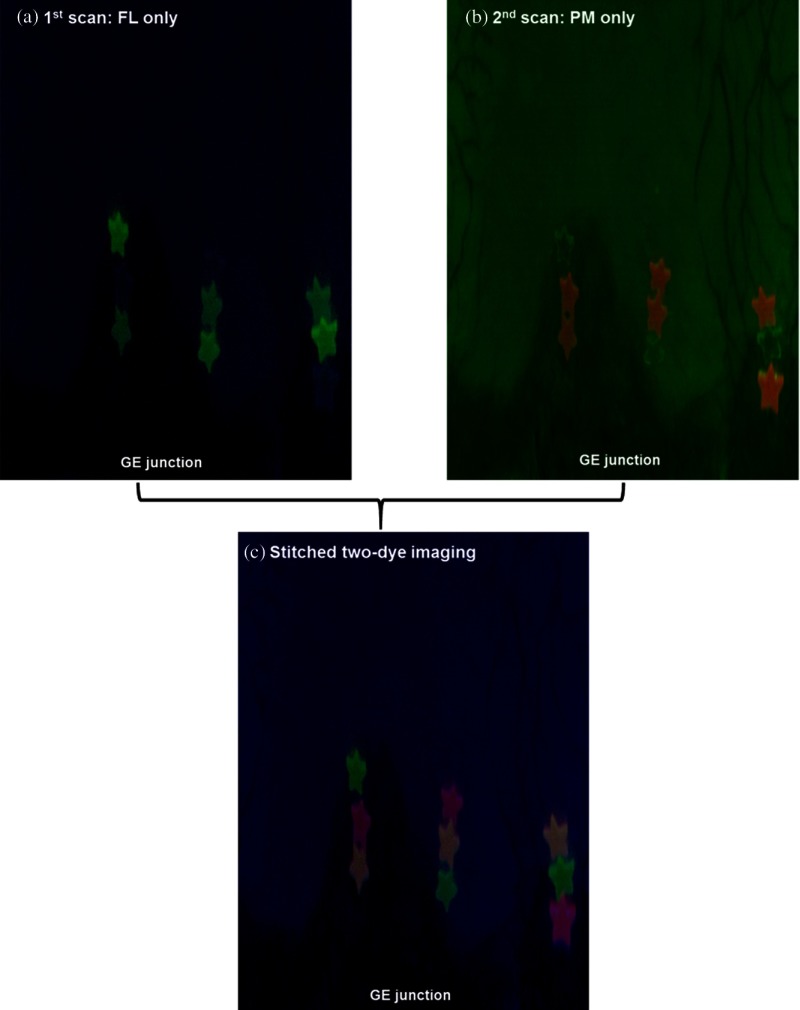
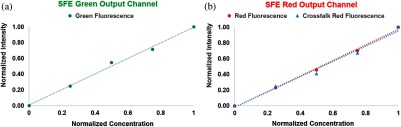
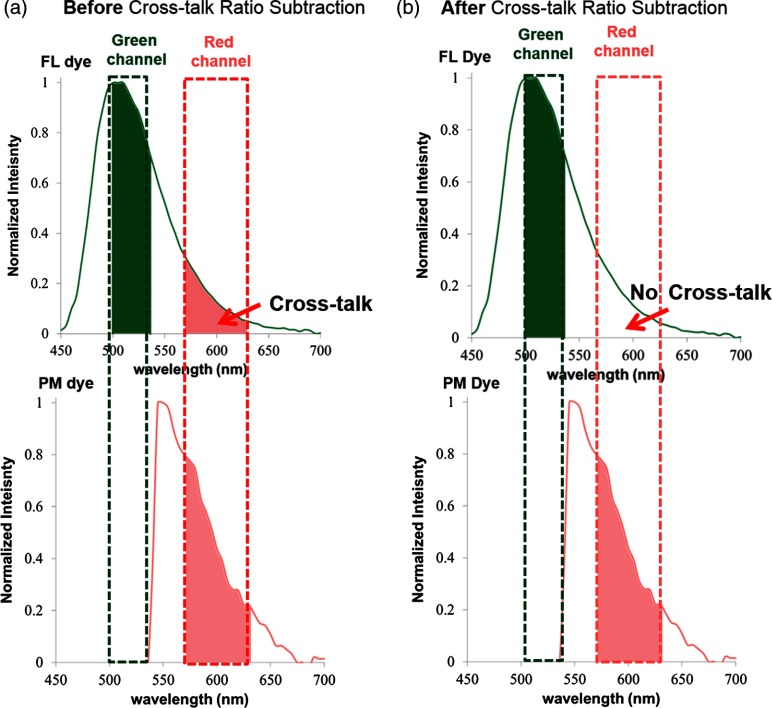
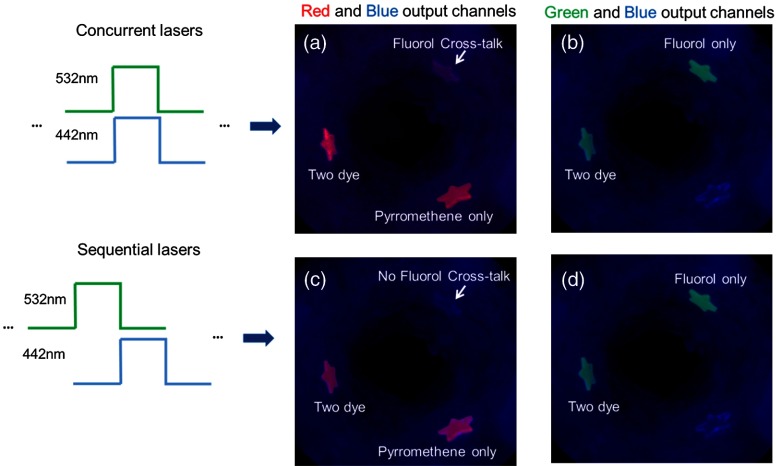
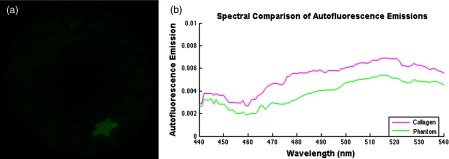
The number of molecular species suitable for multispectral fluorescence imaging is limited due to the overlap of the emission spectra of indicator fluorophores, e.g., dyes and nanoparticles. To remove fluorophore emission cross-talk in wide-field multispectral fluorescence molecular imaging, we evaluate three different solutions: (1) image stitching, (2) concurrent imaging with cross-talk ratio subtraction algorithm, and (3) frame-sequential imaging. A phantom with fluorophore emission cross-talk is fabricated, and a 1.2-mm ultrathin scanning fiber endoscope (SFE) is used to test and compare these approaches. Results show that fluorophore emission cross-talk could be successfully avoided or significantly reduced. Near term, the concurrent imaging method of wide-field multispectral fluorescence SFE is viable for early stage cancer detection and localization in vivo. Furthermore, a means to enhance exogenous fluorescence target-to-background ratio by the reduction of tissue autofluorescence background is demonstrated.


Figures

Fig. 1
Fig. 1
SFE excitation lasers and output channels for two-dye fluorescence imaging. The 442-nm laser was used as excitation for the FL dye targets, and the green detection channel was used to detect its fluorescence emission, whereas the 532-nm laser was used for the excitation of the PM dye targets, and the red detection channel was used to detect its fluorescence emission.
Fig. 2
Fig. 2
Flowchart for the concept of two-dye imaging using image stitching. In the first scan, concurrent FL target fluorescence and reflectance images were recorded, and then imported into the image stitching software to generate a two-dimensional (2-D) FL dye fluorescence hot-spot map. In the second scan, concurrent PM target fluorescence and reflectance images were recorded, and a 2-D PM dye fluorescence hot-spot map was then generated. The software then spatially registered and merged the individual FL and PM map into a combined map with FL-only, PM-only, and FL-PM mix targets.
Fig. 3
Fig. 3
(a) A flowchart shows the pipeline of image stitching software. (b) Graphical illustration of the pipeline.
Fig. 4
Fig. 4
Dual-mode fluorescence-reflectance two-fluorophore imaging. The 632-nm laser is powered off. The 532-nm laser is blocked in front of the green detection channel, only allowing fluorescence signal to pass through. Therefore, the green and red detection channels are configured for fluorescence imaging, whereas the blue detection channel is for reflectance imaging.
Fig. 5
Fig. 5
Graphic illustration of the frame sequential multispectral fluorescence imaging technique. Each of the red, green, and blue lasers was turned on individually and sequentially. Meanwhile, red reflectance, PM red fluorescence, and FL green fluorescence were received in the detection channels sequentially at 10 (30/3) Hz. The red reflectance frames were acquired to enable the Distance Compensation (DC) algorithm for quantitative fluorescence imaging. When the DC algorithm is not needed for the application, only PM red and FL green fluorescence are acquired at 15 (30/2) Hz. In normal operation, red, green, and blue reflectance are used for conventional “white light” color imaging.
Fig. 6
Fig. 6
FL and PM dye-in-polymer fluorescence emission spectra superimposed over the SFE green and red channel detection ranges. The FL targets were excited with a 442-nm laser and produced an emission (shown in green) that peaked at 500 nm. The PM targets were excited with a 532-nm laser and produced an emission (shown in red) that peaked at 550 nm. The band pass ranges of the SFE green (500 to 540 nm) and red (570 to 640 nm) channels are also plotted and highlighted as solid green and red colors. The emission spectra of the two dyes exhibits cross-talk, specifically, the long wavelength tail portion of the FL dye emission spectrum overlaps the PM dye emission from 540 to 700  nm.
Fig. 7
Fig. 7
(a) The stitched and unwrapped 2-D map for the FL imaging. It comprised the blue reflectance images shown as the background with the FL green fluorescent hotspots. (b) The 2-D stitched map for the PM imaging. It is comprised of the green reflectance image in the background with the PM red fluorescent hotspots. (c) The combined stitched map is shown. Only the FL fluorescence is shown in the green display channel and the PM fluorescence in the red display channel. The FL-PM two-dye targets are shown as orange.
Fig. 8
Fig. 8
Fluorescence dye-in-polymer concentrations were plotted against the detected fluorescence signals in the SFE images. Specifically, (a) shows the dependence for the SFE green detection channel and (b) shows the dependence for the SFE red detection channel. The data shows that a linear relationship exists for both (a) and (b) cases.
Fig. 9
Fig. 9
Graphic illustration of concurrent multispectral imaging before (a) and after (b) applying the CRS method. (a) Before the CRS algorithm, PM dye signal and a confounding FL dye cross-talk signal were detected in the concurrent red channel. (b) After the CRS algorithm, the FL cross-talk was mitigated and only the true PM dye signal was detected in the red channel.
Fig. 10
Fig. 10
The FL cross-talk ratio was plotted as a function of the distance between the distal end of the SFE endoscope and the fluorescence target. The ratio remained constant (0.225±0.012) over a distance range of 15 to 40 mm and remained relatively consistent (0.207±0.025) across a distance of 15 to 95 mm.
Fig. 11
Fig. 11
Concurrent multispectral fluorescence SFE imaging of the BE phantom at 30-Hz frame rate. (a–c) Green, red, and combined display channels before applying CRS algorithm. (b) The FL-only targets exhibited erroneous fluorescence signal in the red channel. (c) Green FL appeared with a subtle yellow shade by the addition of red channel bias, due to FL emission cross-talk with the red dye channel. (d–f) Green, red, and combined display channels after CRS algorithm was applied. (e) The confounding FL red channel signal was strongly attenuated after CRS. (f) The combined image after CRS showed correctly rendered green FL, red PM, and orange two-dye images. All images were single-frame raw video outputs from SFE imaging (80-deg field of view, 500-line resolution).
Fig. 12
Fig. 12
Comparison of the signal from the red output channel to the true PM targets signal during concurrent multispectral fluorescence imaging. (a) Before applying the CRS algorithm, the red fluorescence signal from the red detection channel (solid line) deviated from the true PM curve (dashed line). (b) After applying the CRS algorithm, the red fluorescence signal (solid line) closely matched the true PM fluorescence curve (dashed line).
Fig. 13
Fig. 13
Concurrent laser excitation compared with sequential laser excitation results. In concurrent laser excitation, the FL cross-talk signal was observed in the red output channel in (a), whereas in sequential laser excitation, only PM fluorescence signal was received in the red output channel, and no FL cross-talk was observed (c). The green output channel remained the same under both concurrent (b) and sequential (d) laser excitation, as there was no cross-talk in the green output channel.
Fig. 14
Fig. 14
(a) Normalized fluorescence emissions captured by the SFE between 500 and 540 nm after excitation at 442 nm. The star shape is a FL-in-polymer dye target with a concentration of 1 μM, whereas the background fluorescence is due to the embedded collagen AF. Image analysis shows the target-to-background signal ratio was 4:1. (b) Comparison of AF emissions shows that the phantom fluorescence emission is similar to that of pure collagen. A spectrometer was used to test the excitation fiber to address concerns that it may exhibit autoflouresence (USB2000+, Ocean Optics, Inc.). No autofluorescence signal was detected with the laser excitation power used in the current study.

References

    1. Frangioni J. V., “New technologies for human cancer imaging,” J. Clin. Oncol. 26(24), 4012–4021 (2008).JCONDN10.1200/JCO.2007.14.3065 - DOI - PMC - PubMed
    1. Pierce M. C., Javier D. J., Richards-Kortum R., “Optical contrast agents and imaging systems for detection and diagnosis of cancer,” Int. J. Cancer 123(9), 1979–1990 (2008).IJCNAW10.1002/ijc.v123:9 - DOI - PMC - PubMed
    1. Goetz M., Wang T. D., “Molecular imaging in gastrointestinal endoscopy,” Gastroenterology 138(3), 828–833 (2010).GASTAB10.1053/j.gastro.2010.01.009 - DOI - PMC - PubMed
    1. van Dam G. M., et al. , “Intraoperative tumor-specific fluorescence imaging in ovarian cancer by folate receptor-α targeting: first in-human results,” Nat. Med. 17(10), 1315–1319 (2011).10.1038/nm.2472 - DOI - PubMed
    1. Kriegmair M., et al. , “Detection of early bladder cancer by 5-aminolevulnic acid induced porphyrin fluorescence,” J. Urol. 155(1), 105–109 (1996).JOURDD10.1016/S0022-5347(01)66559-5 - DOI - PubMed

Publication types

MeSH terms