

doi: 10.1128/JVI.01750-13.
Epub 2013 Aug 21.
Dynamics of cytokine/chemokine responses in intestinal CD4+ and CD8+ T Cells during Acute Simian Immunodeficiency Virus Infection
Affiliations
- PMID: 23966391
- PMCID: PMC3807351
- DOI: 10.1128/JVI.01750-13
Item in Clipboard
Dynamics of cytokine/chemokine responses in intestinal CD4+ and CD8+ T Cells during Acute Simian Immunodeficiency Virus Infection
J Virol.
2013 Nov.
Abstract
Loss of intestinal CD4(+) T cells was associated with decreased production of several T-helper 1 (TH1) and TH2 cytokines and increased production of interleukin 17 (IL-17), gamma interferon (IFN-γ), CCL4, and granulocyte-macrophage colony-stimulating factor (GM-CSF) by CD8(+) T cells 21 days after simian immunodeficiency virus (SIV) infection in rhesus macaques. Shifting of mucosal TH1 to TH2 or T-cytotoxic 1 (TC1) to TC2 cytokine profiles was not evident. Additionally, both CD4(+) and CD8(+) T cells showed upregulation of macrophage migration inhibition factor (MIF) and basic fibroblast growth factor (FGF-basic) cytokines that have been linked to HIV disease progression.
Figures
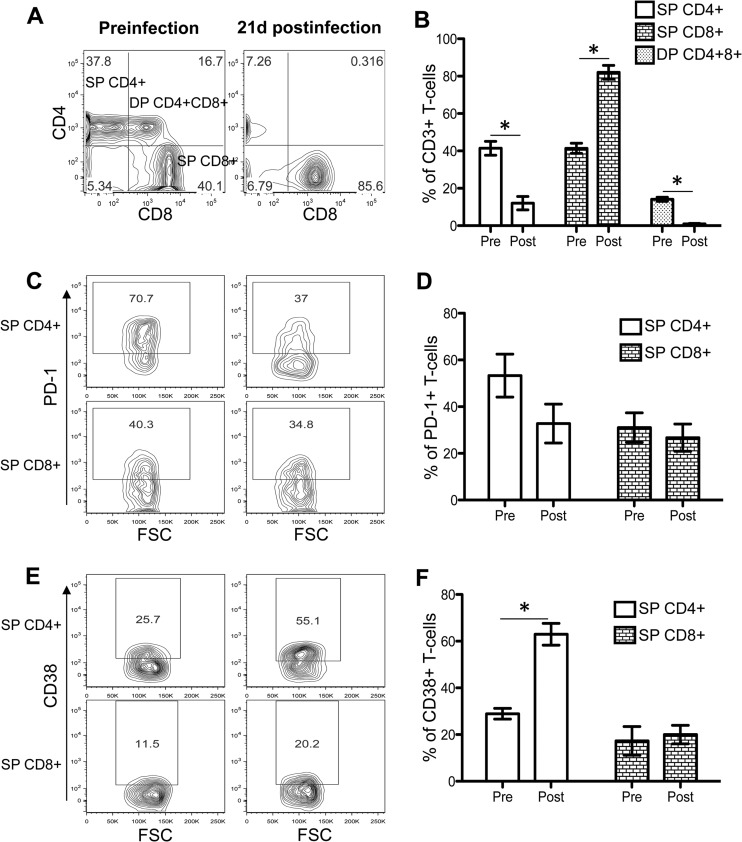
Distribution of single-positive (SP) CD4+ CD8+ and double-positive (DP) CD4+ CD8+ T cells in jejunum LPLs and their expression of phenotypic markers of activation and exhaustion. (A) Representative contour plots showing SP CD4+, CD8+, and DP CD4+ CD8+ T-cell population before and 21 days after SIV infection. Plots were generated by gating CD3+ T cells. (B) Mean percentages (± standard errors [SE]) of SP CD4+, CD8+, and DP CD4+ CD8+ T cells of five SIVMAC251-infected macaques before infection (pre) and 21 days after infection (post). Representative contour plots show PD-1 (C) and CD38 (E) phenotypic expression in SP CD4+ and SP CD8+ T-cell population before and after SIV infection, where cells were gated through CD3+ T cells. Mean percentages (± SE) of T-cell exhaustion (PD-1) (D) and activation (CD38) (F) markers are shown for SP CD4+ and CD8+ T cells of five SIVMAC251-infected macaques before and after SIV infection. Asterisks indicate statistically significant differences in respective cell populations, compared to preinfection levels (P < 0.05). FSC, forward-angle light scatter.
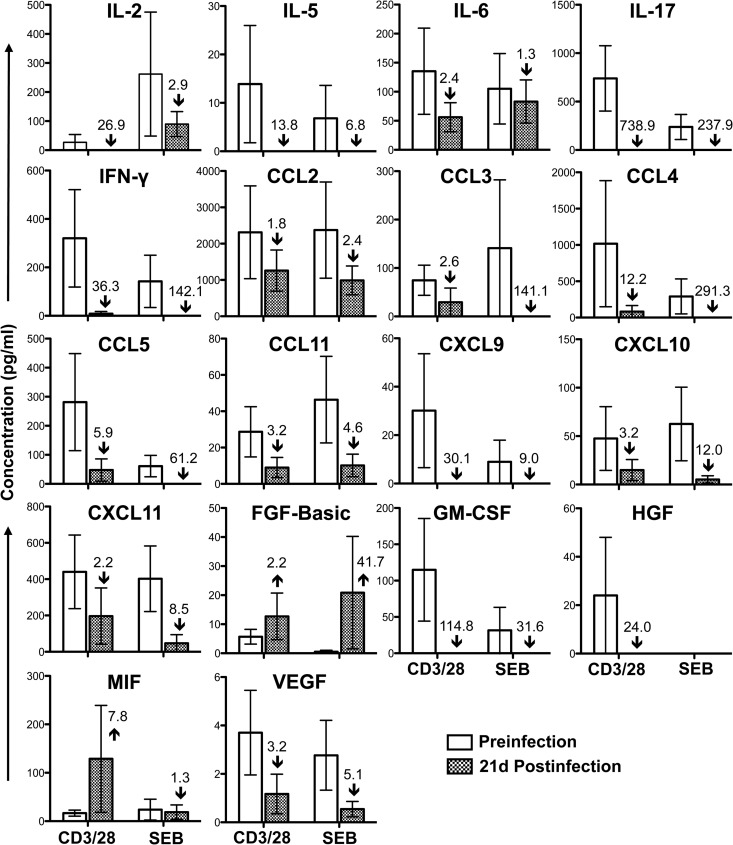
Cytokine/chemokine profile in jejunum CD3+ CD4+ T cells during acute SIVMAC251 infection. Bar graphs show 18 different cytokine/chemokine measurements taken before and 21 days (21d) after SIV infection from culture supernatants of sorted single-positive CD4+ T cells stimulated with either anti-CD3/CD28 monoclonal antibodies or Staphylococcus enterotoxin B (SEB). Medium control values were subtracted from all values before the analysis (n = 5). The number and arrow in each bar for the postinfection time point show the mean fold increase (upward arrow) or decrease (downward arrow) compared to the preinfection level.
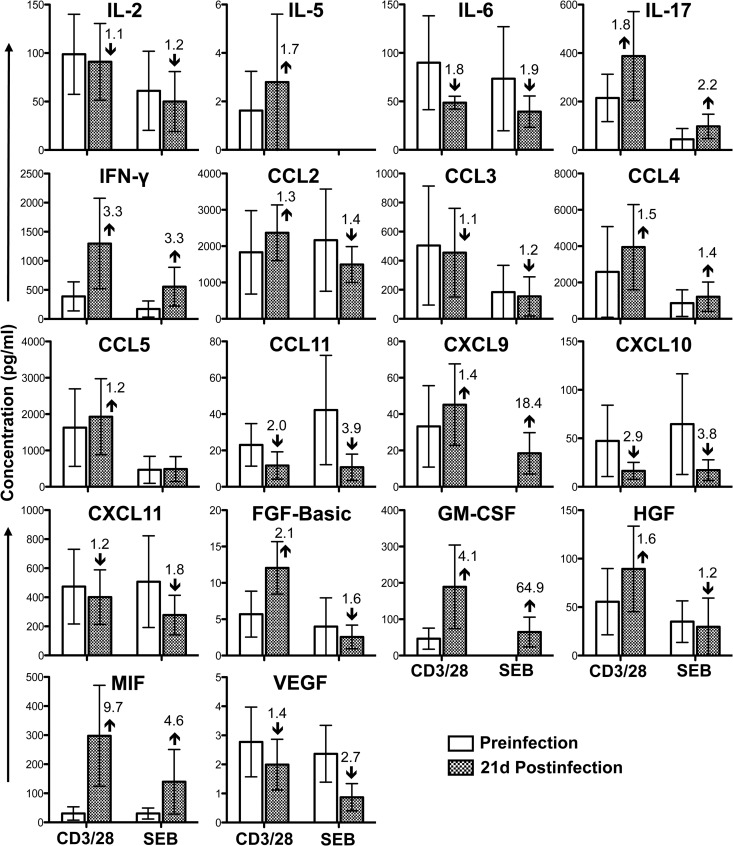
Cytokine/chemokine profile in jejunum CD3+ CD8+ T cells during acute SIVMAC251 infection. Bar graphs show 18 different cytokine/chemokine measurements taken before and 21 days (21d) after SIV infection from culture supernatants of sorted single-positive CD8+ T cells stimulated with either anti-CD3/CD28 monoclonal antibodies or Staphylococcus enterotoxin B (SEB). Medium control values were subtracted from all values before the analysis (n = 5). The number and arrow in each bar for the postinfection time point show the mean fold increase (upward arrow) or decrease (downward arrow) compared to the preinfection level.
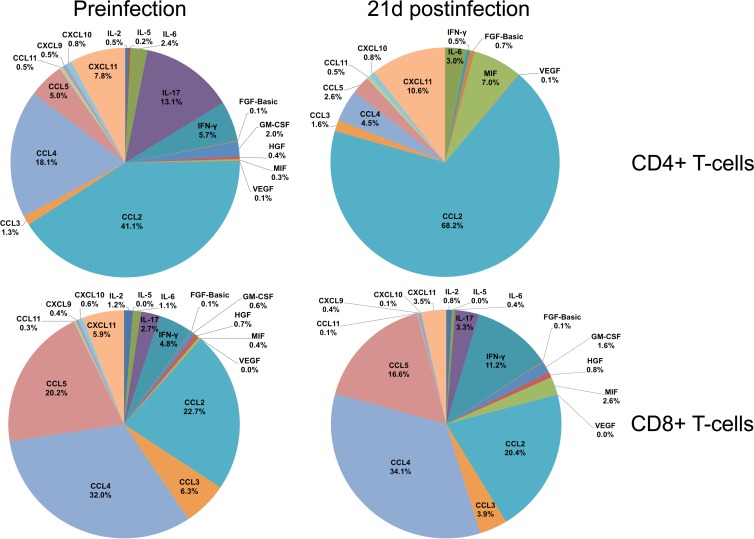
Relative contribution of cytokine/chemokine expression during acute SIVMAC251 infection. The pie charts illustrate the relative percentage contribution of each cytokine/chemokine from culture supernatants of sorted single-positive CD4+ and CD8+ T cells stimulated with anti-CD3/CD28 monoclonal antibodies before and 21 days after SIV infection. Medium control values were subtracted from all values before the analysis (n = 5). Note that cytokines having 0.01 to 0.04% overall contribution are represented as 0% in the pie chart.
References
-
- Chase A, Zhou Y, Siliciano RF. 2006. HIV-1-induced depletion of CD4+ T cells in the gut: mechanism and therapeutic implications. Trends Pharmacol. Sci. 27:4–7 - PubMed
-
- Veazey RS, DeMaria M, Chalifoux LV, Shvetz DE, Pauley DR, Knight HL, Rosenzweig M, Johnson RP, Desrosiers RC, Lackner AA. 1998. Gastrointestinal tract as a major site of CD4+ T cell depletion and viral replication in SIV infection. Science 280:427–431 - PubMed
Publication types
MeSH terms
Substances
Grants and funding
LinkOut - more resources
Full Text Sources
Other Literature Sources
Research Materials
Miscellaneous
