. 2013 Nov;87(21):11670-83.
doi: 10.1128/JVI.01560-13. Epub 2013 Aug 21.

Global RNA structure analysis of poliovirus identifies a conserved RNA structure involved in viral replication and infectivity

Affiliations

Global RNA structure analysis of poliovirus identifies a conserved RNA structure involved in viral replication and infectivity

Cecily P Burrill et al. J Virol. 2013 Nov.

Abstract

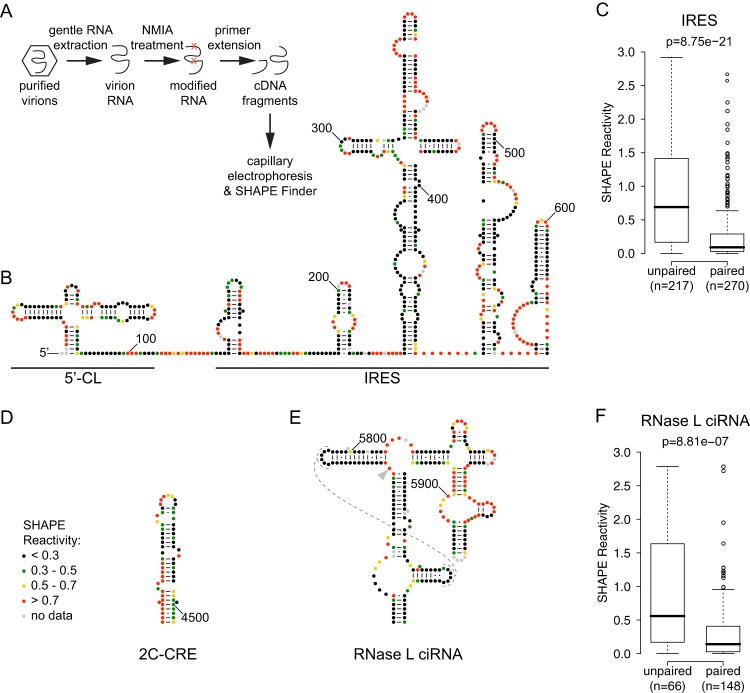
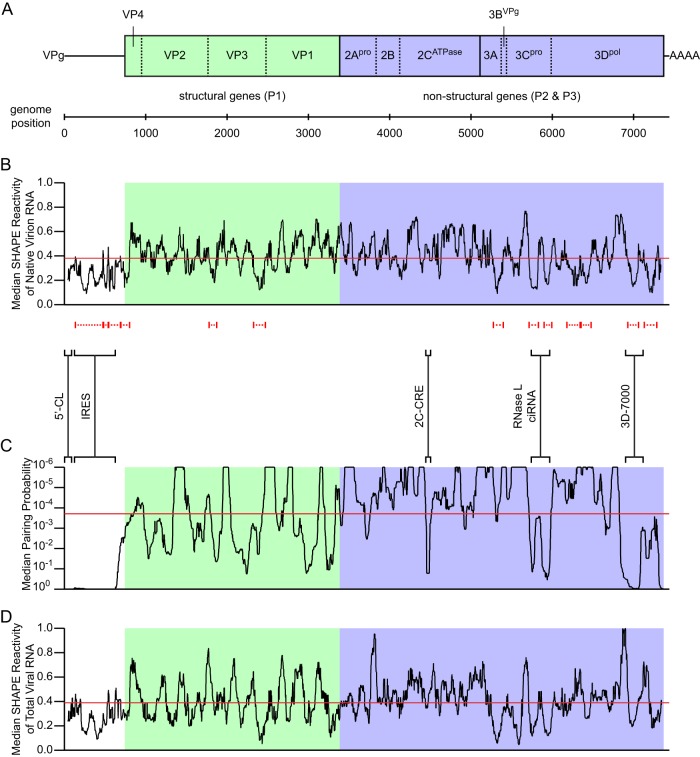
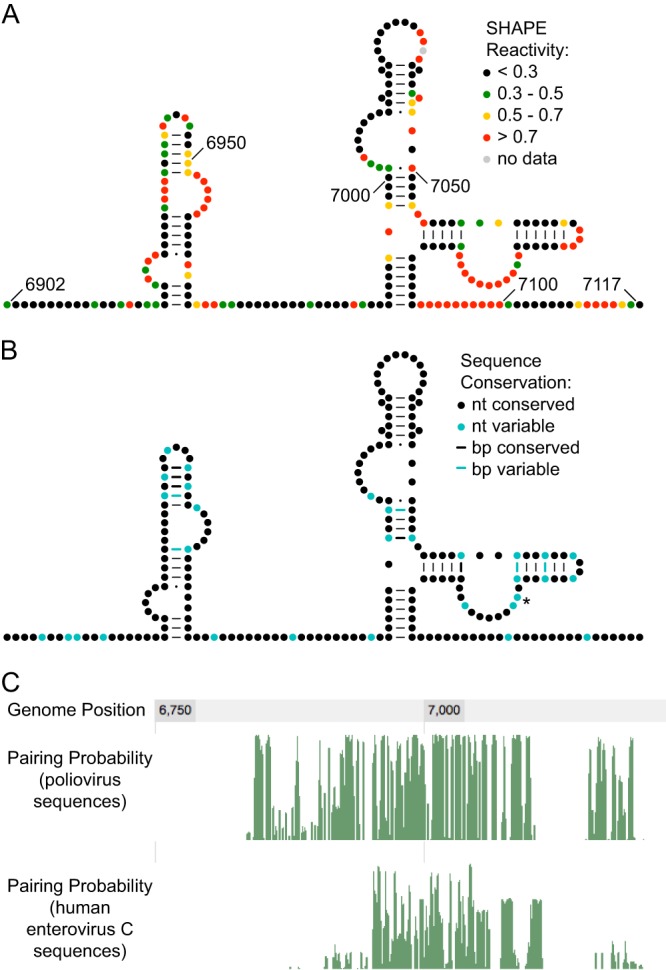
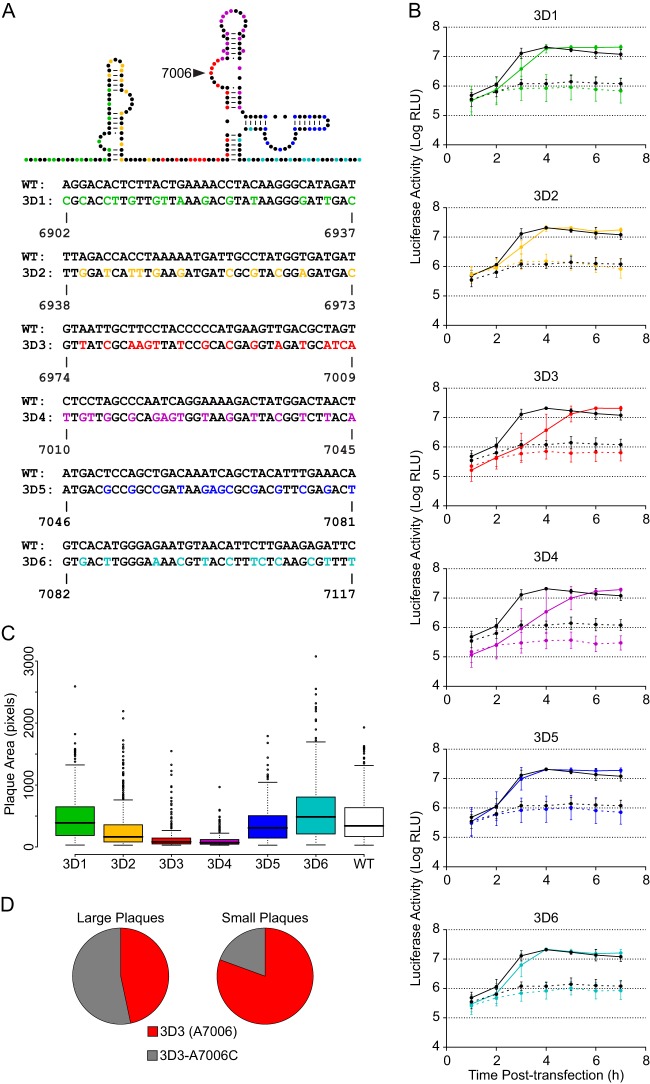
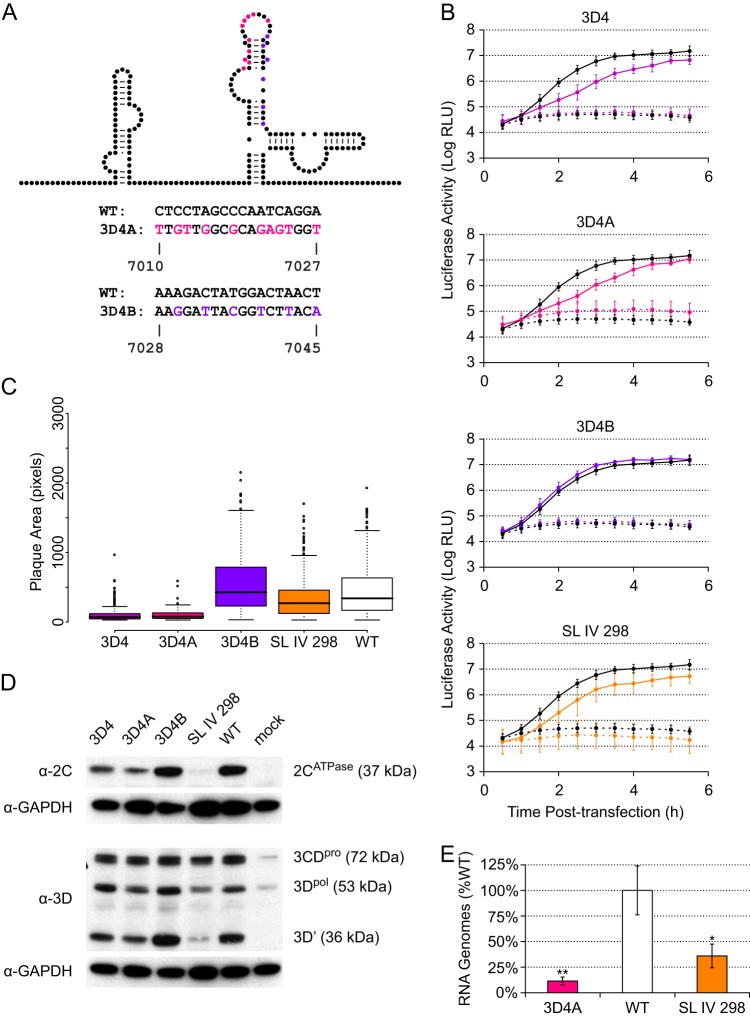
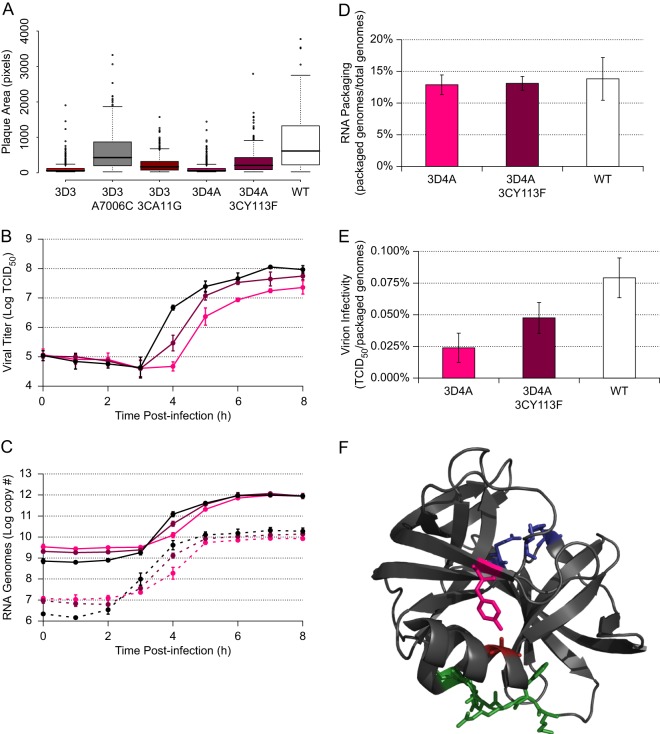
The genomes of RNA viruses often contain RNA structures that are crucial for translation and RNA replication and may play additional, uncharacterized roles during the viral replication cycle. For the picornavirus family member poliovirus, a number of functional RNA structures have been identified, but much of its genome, especially the open reading frame, has remained uncharacterized. We have now generated a global RNA structure map of the poliovirus genome using a chemical probing approach that interrogates RNA structure with single-nucleotide resolution. In combination with orthogonal evolutionary analyses, we uncover several conserved RNA structures in the open reading frame of the viral genome. To validate the ability of our global analyses to identify functionally important RNA structures, we further characterized one of the newly identified structures, located in the region encoding the RNA-dependent RNA polymerase, 3D(pol), by site-directed mutagenesis. Our results reveal that the structure is required for viral replication and infectivity, since synonymous mutants are defective in these processes. Furthermore, these defects can be partially suppressed by mutations in the viral protein 3C(pro), which suggests the existence of a novel functional interaction between an RNA structure in the 3D(pol)-coding region and the viral protein(s) 3C(pro) and/or its precursor 3CD(pro).


Figures

Fig 1
Fig 1
Experimental procedure and SHAPE reactivities of previously described RNA structures in the poliovirus genome. (A) Outline of SHAPE experimental approach. (B) 5′ UTR: 5′-cloverleaf (5′-CL) and internal ribosome entry site (IRES). Accepted RNA secondary structure model for nt 1 to 625 of the poliovirus 1 (Mahoney) genome colored by SHAPE reactivity (constrained nucleotides are black, moderately reactive nucleotides are green or yellow, and flexible nucleotides are red). A-U and C-G base pairing is indicated by lines, and G-U (wobble) base pairing is indicated by dots. (C) Agreement of SHAPE with accepted structure for IRES. Box plots indicate median SHAPE reactivity, 25% and 75% quartiles, and 1.5× interquartile range for nucleotides predicted to be paired or unpaired; outliers are shown as open circles. (D) 2C-CRE. Nucleotides 4444 to 4504 are colored by SHAPE reactivity. (E) RNase L ciRNA. Nucleotides 5742 to 5968 are colored by SHAPE reactivity; dashed lines indicate predicted tertiary interaction; arrowhead indicates nucleotide 5775, site of the 3D-7000 A-to-U suppressor mutation that encodes the 3Cpro Y113F change. (F) Agreement of SHAPE with accepted structure for RNase L ciRNA. Box plots are as for panel A.
Fig 2
Fig 2
Organization, SHAPE reactivity, and pairing probability of the poliovirus genome and bootstrap analysis of protein linker regions. (A) Poliovirus genome organization. Untranslated regions are shown as lines, and the open reading frame as a box, with length proportional to nucleotide length. The open reading frame is divided (solid lines) by convention into three domains: P1 (structural genes; light green) and P2 and P3 (nonstructural genes; both light blue). Domains are further divided (dashed lines) into the 11 major viral proteins. (B) Median SHAPE reactivity of native virion RNA. Median SHAPE reactivity is calculated over a sliding 75-nt window (black line). The global median is 0.38 (red line). Regions representing putative local structures identified by SHAPE are marked by dashed red lines (see also Table 1). Regions representing previously described RNA structures, and the 3D-7000 element region targeted by mutagenesis in the current work, are marked by solid black brackets and labeled. (C) Median pairing probability. Median pairing probability is calculated over a sliding 75-nt window (black line). The global median is 1.9 × 10⁻⁴ (red line). Probabilities of <1.0 × 10⁻⁶ are plotted at 1.0 × 10⁻⁶. (D) Median SHAPE reactivity of total viral RNA at 7 h postinfection. Median SHAPE reactivity is calculated over a sliding 75-nt window (black line). The global median is 0.39 (red line).
Fig 3
Fig 3
SHAPE reactivity and conservation of 3D-7000 element. (A) SHAPE reactivity of 3D-7000 element. The predicted RNA secondary structure model for nt 6902 to 7117 of the poliovirus 1 (Mahoney) genome is colored by SHAPE reactivity (constrained nucleotides are black, moderately reactive nucleotides are green or yellow, and flexible nucleotides are red). A-U and C-G base pairing is indicated by lines, and G-U (wobble) base pairing is indicated by dots. (B) Conservation of the 3D-7000 element. Nucleotide variability was determined by examining selected other poliovirus genomes: Mahoney (PV1; GenBank NC_002058), Sabin 1 (see note below) (GenBank AY184219), Lansing/MEF-1 (PV2; GenBank M12197/AY238473; identical for this region), Sabin 2 (AY184220), Saukett (PV3; C. P. Burrill, E. F. Goldstein, and R. Andino, unpublished data), and Sabin 3/Leon (GenBank AY184221/K01392; identical for this region). (C7071U encodes the T362I substitution in 3Dpol in the attenuated Sabin 1 vaccine strain; this is the only nonsynonymous change found in this region in any of the poliovirus sequences examined.) (C) Pairing probability of region containing the 3D-7000 element. Green lines represent the pairing probability for each nucleotide obtained by analyzing an alignment of poliovirus (top) or human enterovirus C (bottom) sequences.
Fig 4
Fig 4
Mutagenesis of the 3D-7000 element and characterization of initial mutants. (A) Mutants. On the schematic, color indicates nucleotides targeted in each mutant. The actual nucleotide changes and corresponding wild-type sequence and nucleotide positions for each mutant are listed below. For WT structure, A-U and C-G base pairing is indicated by lines and G-U (wobble) base pairing by dots. (B) PLuc assay. Mutant (colored) or wild-type (black) replicon RNA was transfected into HeLa S3 cells at 37°C. Cells were incubated in the presence (dashed lines) or absence (solid lines) of 2 mM GdnHCl. Luciferase activity (relative light units) corresponding to ∼5.3 × 10⁵ cells was measured every hour. Data are plotted as the means ± standard deviations of three or four independent transfections. Replication delays at 3 h posttransfection are significant compared to results for the wild type in 3D2 (P = 0.026), 3D3 (P = 0.003), and 3D4 (P = 0.015). (C) Plaque assays with plaque size measurement. Clonal stocks were used to infect HeLa S3 cells at 37°C. Each box plot indicates median plaque area in pixels, 25% and 75% quartiles, and 1.5× interquartile range; outliers are shown as open circles. 3D2 (P = 8.4E−09), 3D3 (P < 2.2E−16), and 3D4 (P < 2.2E−16) plaques are significantly smaller than the wild type. (D) Frequency of A7006C mutation in large and small plaques derived from 3D3 stock. Plaques were picked at 72 (large; n = 45) or 96 (small; n = 46) hours postinfection and amplified. RT-PCR products representing the region in question were sequenced.
Fig 5
Fig 5
Subdivision and further characterization of the 3D4 mutant. (A) Mutants. On the schematic, color indicates nucleotides targeted in each mutant. The actual nucleotide changes and corresponding wild-type sequence and nucleotide positions for each mutant are listed below. For WT structure, A-U and C-G base pairing is indicated by lines and G-U (wobble) base pairing by dots. (B) PLuc assay. Mutant (colored) or wild-type (black) replicon RNA was transfected into HeLa S3 cells at 37°C. Cells were incubated in the presence (dashed lines) or absence (solid lines) of 2 mM GdnHCl. Luciferase activity (relative light units) corresponding to ∼3.1 × 10⁵ cells was measured every 30 min. Data are plotted as the means ± standard deviations for three independent transfections. Replication delays at 2.0 to 3.5 h posttransfection are significant compared to results for the wild type in 3D4 and 3D4A (P < 0.05). (C) Plaque assays with plaque size measurement. Clonal stocks were used to infect HeLa S3 cells at 37°C. Box plots indicate the median plaque area in pixels, 25% and 75% quartiles, and 1.5× interquartile range; outliers are shown as open circles. 3D4 (P < 2.2E−16), 3D4A (P < 2.2E−16), and SL IV 298 (P = 5.6E−05) plaques are significantly smaller than the wild type. (D) Western blots. P1 virus stocks were used to infect HeLa S3 cells (MOI of ∼20). Total protein was harvested at 5 h postinfection. Five microliters of cell lysate was run for each sample and blotted with anti-3D or anti-2C. Membranes were stripped and reblotted with anti-GAPDH. (E) qPCR. P1 virus stocks were used to infect HeLa S3 cells (MOI of ∼25). Total RNA was harvested at 5 h postinfection, and positive-sense RNA was measured by strand-specific qPCR. Data are normalized to the average wild-type value and are plotted as the means ± standard deviations for three replicates.
Fig 6
Fig 6
Phenotype and location of second site suppressor mutations. (A) Plaque assays with plaque size measurement. Clonal stocks were used to infect HeLa S3 cells at 37°C. Each box plot indicates median plaque area in pixels, 25% and 75% quartiles, and 1.5× interquartile range; outliers are shown as open circles. Suppressor mutants (3D3-A7006C, 3D3-3CA11G, and 3D4A-3CY113F) are significantly different from both the relevant RNA structure mutant (3D3 or 3D4A) and the WT (P < 2.2E−16 in all cases except 3D3-A7006C versus WT: P = 7.1E−05). (B) One-step growth curves. P1 stocks of 3D4A (pink), 3D4A-3CY113F (magenta), or wild-type (black) virus were used to infect HeLa S3 cells (MOI of ∼25). Samples were taken every hour, and titers were determined by TCID50. Data are plotted as means ± standard deviations for three replicates. 3D4A is significantly (P < 0.05) lower than the wild type from 4 to 8 h postinfection. 3D4A-3CY113F is significantly (P < 0.05) higher than 3D4A at 4 to 5 h postinfection and lower than the wild type at 4 h postinfection. (C) Strand-specific qPCR. P1 stocks of 3D4A (pink), 3D4A-3CY113F (magenta), or wild-type (black) virus were used to infect HeLa S3 cells (MOI of ∼25). Samples were taken every hour, and the number of positive-sense (solid lines) or negative-sense (dashed lines) viral genomes was determined by strand-specific qRT-PCR. Data are plotted as means ± standard deviations for three replicates. For both strands, 3D4A is significantly (P < 0.05) lower than the wild type from 0 to 5 h postinfection. 3D4A-3CY113F is significantly (P < 0.05) higher than 3D4A at 4 to 6 h postinfection and significantly (P = 0.004) lower than the wild type at 4 h postinfection. (D and D) RNA packaging (ratio of packaged genomes to total genomes) (D) and virion infectivity (ratio of infectious units to packaged genomes) (E). After titer determination, the 3D4A (pink), 3D4A-3CY113F (magenta), and wild-type (white) 8-h replicates from the one-step growth curves (A) were subjected to virion immunoprecipitation, and the number of packaged genomes was assayed by strand-specific RT-qPCR. This number was compared to either the average number of total viral genomes at 8 h from panel B or the 8-h replicate viral titer from panel A. Data are plotted as means ± standard deviations for three replicates. Background levels from a negative control (boiled viral lysate) were more than 1,000-fold lower than the lowest reported experimental values. (F) PV 3Cpro. A11 is shown in red, and Y113 is shown in pink. The catalytic triad (H40, E71, and C147) are in blue, and the residues known to bind to the 5′CL (KFRDIR 82 to 87) are in green.

References

    1. Hogle JM, Chow M, Filman DJ. 1985. Three-dimensional structure of poliovirus at 2.9 A resolution. Science 229:1358–1365 - PubMed
    1. Kew OM, Sutter RW, de Gourville EM, Dowdle WR, Pallansch MA. 2005. Vaccine-derived polioviruses and the endgame strategy for global polio eradication. Annu. Rev. Microbiol. 59:587–635 - PubMed
    1. Pelletier J, Kaplan G, Racaniello VR, Sonenberg N. 1988. Cap-independent translation of poliovirus mRNA is conferred by sequence elements within the 5′ noncoding region. Mol. Cell. Biol. 8:1103–1112 - PMC - PubMed
    1. Trono D, Pelletier J, Sonenberg N, Baltimore D. 1988. Translation in mammalian cells of a gene linked to the poliovirus 5′ noncoding region. Science 241:445–448 - PubMed
    1. Andino R, Rieckhof GE, Baltimore D. 1990. A functional ribonucleoprotein complex forms around the 5′ end of poliovirus RNA. Cell 63:369–380 - PubMed

Publication types