. 2013 Nov;87(21):11626-36.
doi: 10.1128/JVI.01515-13. Epub 2013 Aug 21.

KLRG1 negatively regulates natural killer cell functions through the Akt pathway in individuals with chronic hepatitis C virus infection

Affiliations

KLRG1 negatively regulates natural killer cell functions through the Akt pathway in individuals with chronic hepatitis C virus infection

Jia M Wang et al. J Virol. 2013 Nov.

Abstract

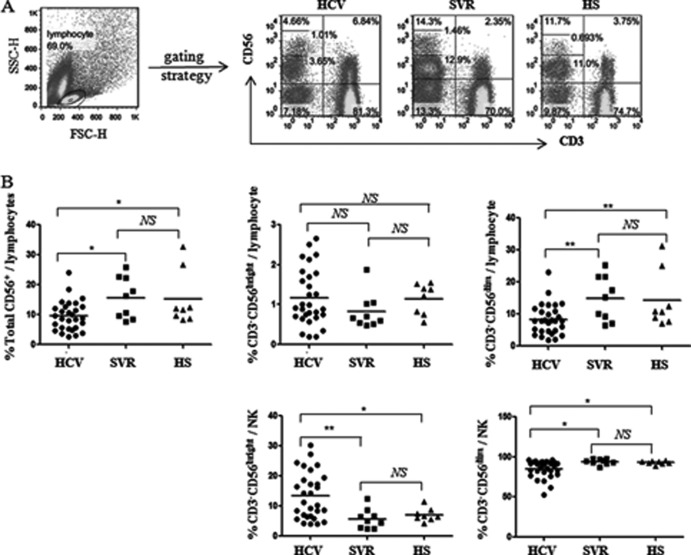
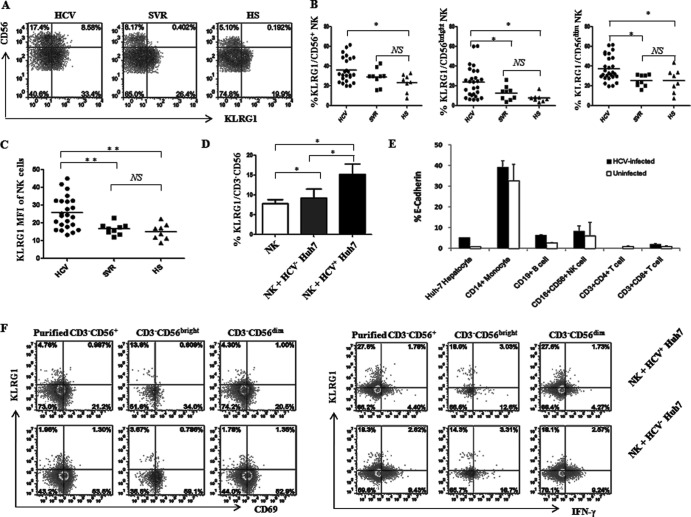
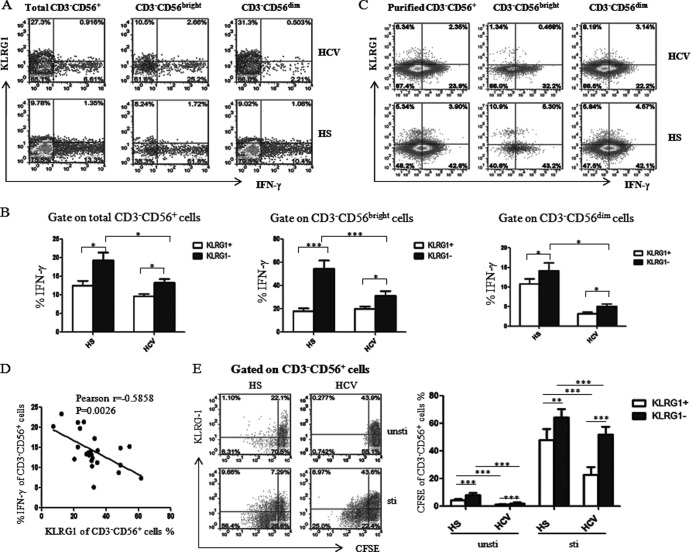
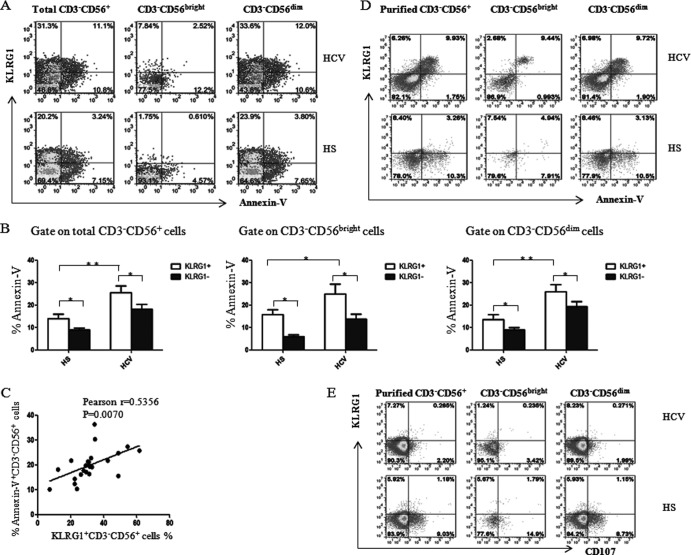
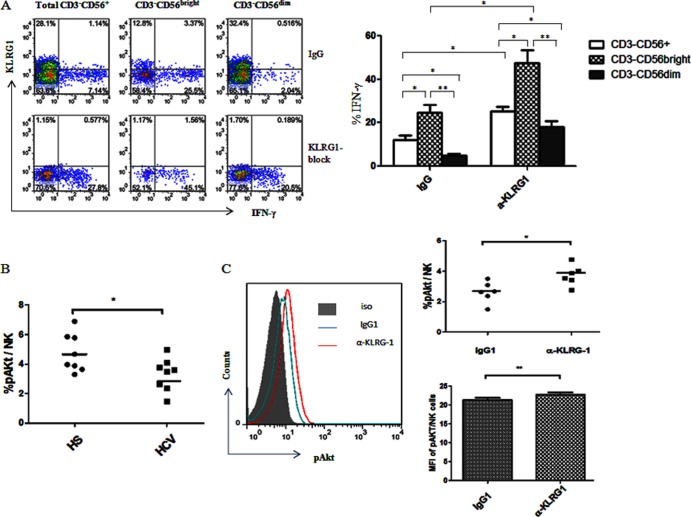
In this study, we demonstrate that killer cell lectin-like receptor subfamily G member 1 (KLRG1), a transmembrane protein preferentially expressed on T cells, is highly expressed on CD56(+) NK cells, which are significantly reduced in their numbers and functions in the peripheral blood of patients with chronic hepatitis C virus (HCV) infection compared to subjects without infection. KLRG1 expression is also upregulated on healthy NK cells exposed to Huh-7 hepatocytes infected with HCV in vitro. Importantly, the expression levels of KLRG1 are inversely associated with the capacity of NK cells to proliferate and to produce gamma interferon (IFN-γ) but positively associated with apoptosis of NK cells in response to inflammatory cytokine stimulation. KLRG1(+) NK cells, including CD56(bright) and CD56(dim) subsets, exhibit impaired cell activation and IFN-γ production but increased apoptosis compared to KLRG1(-) NK cells, particularly in HCV-infected individuals. Importantly, blockade of KLRG1 signaling significantly recovered the impaired IFN-γ production by NK cells from HCV-infected subjects. Blockade of KLRG1 also enhanced the impaired phosphorylation of Akt (Ser473) in NK cells from HCV-infected subjects. Taken together, these results indicate that KLRG1 negatively regulates NK cell numbers and functions via the Akt pathway, thus providing a novel marker and therapeutic target for HCV infection.


Figures

Fig 1
Fig 1
NK cells are reduced with shifting distribution of CD3 CD56dim and CD3 CD56bright subsets in patients with chronic HCV infection. PBMCs from 29 HCV patients, 9 SVR individuals, and 8 HS were analyzed by flow cytometry for the frequencies of different subsets of NK cells. The cells were immunostained with PE-CD3 and PerCP-CD56; the gating strategies are described in Materials and Methods. (A) Representative dot plots showing the gating strategy for CD3 CD56+ NK cells and CD3 CD56bright and CD3 CD56dim subsets in patients with chronic HCV infection, individuals following treatment with SVR, and HS. Percentage of cell frequency in the gated area is shown in the dot plots. (B) Summary data showing the percentages of CD3 CD56+ NK cells, CD3 CD56bright and CD3 CD56dim subsets in the lymphocyte populations (upper panel) and in the NK cell populations (lower panel). Each dot represents one individual, and horizontal bars represent mean values. *, P < 0.05; **, P < 0.01; NS, no significance.
Fig 2
Fig 2
KLRG1 is upregulated on NK cells by HCV infection. (A) PBMCs from 24 HCV patients, 9 SVR individuals, and 8 HS were analyzed by flow cytometry for expression of KLRG1 on different subsets of NK cells. Representative dot plots showing the gating strategy for KLRG1 expression on total CD3 CD56+ NK cells and CD3 CD56bright and CD3 CD56dim subsets in patients with chronic HCV infection, individuals after treatment with SVR, and HS. Percent cell frequency in the gated area is shown in the dot plots. (B) Summary data showing the percentages of KLRG1 expression in total CD3 CD56+ NK cells and CD3 CD56bright and CD3 CD56dim subsets. Each dot represents one individual, and the horizontal bars represent mean values. *, P < 0.05; NS, no significance. (C) MFI of KLRG1 expression on CD3 CD56+ NK cells. **, P < 0.01; NS, no significance. (D) Upregulation of KLRG1 expression on NK cells incubated with or without HCV-transfected (HCV+) or untransfected (HCV) Huh-7 hepatocytes. Briefly, healthy PBMCs were cocultured with HCV-transfected or untransfected Huh-7 cells, and KLRG1 expression on CD3 CD56+ NK cells was analyzed by flow cytometry as described in Materials and Methods. Summary data (means ± SD) from three independent experiments are shown. *, P < 0.05; NS, no significance. (E) Expression of the KLRG1 ligand E-cadherin on HCV-infected and uninfected Huh-7 hepatocytes as well as on different populations of PBMCs from 3 HCV-infected and 3 uninfected subjects. The percentage of cells expressing E-cadherin was calculated as the percentage in the sample minus that in the isotype control. (F) Representative dot plots of CD69 expression (left panel) and IFN-γ production (right panel) by KLRG1+ or KLRG1 NKs, including total purified CD3 CD56+ NKs as well as CD56bright and CD56dim subsets, cocultured with HCV+ or HCV Huh-7 hepatocytes. The percent cell frequency in the gated area is shown in the dot plots.
Fig 3
Fig 3
KLRG1 expression is inversely associated with the low levels of IFN-γ production by NK cells in HCV infection. (A) PBMCs from chronically HCV-infected patients and HS were stimulated with rhIL-12 (10 ng/ml) for 18 h and incubated for the last 4 h with brefeldin A (10 μg/ml) to halt cytokine secretion. The cells were immunostained with PE-CD3, PerCP-CD56, APC–IFN-γ, and Alexa Fluor 488-KLRG1, and the IFN-γ production by KLRG1+ and KLRG1 NK cells was analyzed by flow cytometry. Representative dot plots for IFN-γ production by KLRG1+ and KLRG1 NK cells, including total CD3 CD56+, CD3 CD56bright, and CD3 CD56dim subsets from an HCV-infected subject and HS. (B) The average percentage of IFN-γ production by the KLRG1+ versus KLRG1 fraction of total CD3 CD56+ NK cells, or in the CD3 CD56bright and CD3 CD56dim subsets. Results are expressed as means ± SD of the percentages of IFN-γ production by NK cells from 24 HCV-infected patients versus 8 HS. *, P < 0.05; ***, P < 0.001. (C) Representative dot plots for KLRG1 expression and IFN-γ production by negatively purified NKs, including total CD3 CD56+ and CD3 CD56bright or CD3 CD56dim subsets from an HCV-infected subject and HS. The percentage of cells in the gated area is shown in the dot plots. (D) Relationship between KLRG1 expression and IFN-γ production by CD3 CD56+ NK cells from 24 HCV-infected patients based on Pearson correlation analysis (r = −0.585; **, P < 0.01). E) KLRG1+ and KLRG1 NK cell proliferation levels were assessed in a CFSE assay. PBMCs were labeled with CFSE and cultured with or without rhIL-12 and rhIL-2 for 6 days. The cells were immunostained with PE-CD3, PerCP-CD56, and Alexa Fluor 488-KLRG1 and analyzed by flow cytometry as described in Materials and Methods. Representative dot plots (left panel) and summary data (right panel; mean ± SD) of CFSE dilution in the KLRG1+ and KLRG1 NK cells from 8 HCV patients versus 8 HS, with and without ex vivo stimulation, are shown. ***, P < 0.001.
Fig 4
Fig 4
KLRG1 expression is positively associated with apoptosis of NK cells following HCV infection. (A) PBMCs from HCV-infected patients and HS were stimulated with 10 ng/ml rhIL-12 for 18 h, followed by 1 μg/ml brefeldin A 4 h prior to harvest of the cells (to block cytokine secretion). PBMCs were immunostained and then analyzed for Annexin V expression on total CD3 CD56+ and CD3 CD56bright and CD3 CD56dim NK cells by flow cytometry. Representative dot plots for Annexin V expression on KLRG1+ and KLRG1 NK cells, including CD3 CD56+ and the CD3 CD56bright and CD3 CD56dim subsets from an HCV-infected patient and HS are shown. (B) Average percentage of Annexin V expression from the KLRG1+ versus KLRG1 cell fraction of total CD3 CD56+ NK cells and the CD3 CD56bright and CD3 CD56dim subsets. Results are expressed as means ± SD of the percentages of Annexin V expression by NK cells from 24 HCV-infected patients versus 8 HS. *, P < 0.05; **, P < 0.01. (C) Relationship between KLRG1 expression and Annexin V expression on CD3 CD56+ NK cells from 24 HCV-infected patients, based on Pearson correlation analysis. r = 0.535; **, P < 0.01. (D) Representative dot plots for KLRG1 and Annexin V expressions on negatively selected NK cells, including CD3 CD56+ and the CD3 CD56bright and CD3 CD56dim subsets, from an HCV-infected subject and HS. (E) Representative dot plots for KLRG1 and CD107a expression levels on negatively selected NK cells, including CD3 CD56+ and the CD3 CD56bright and CD3 CD56dim subsets, from an HCV-infected subject and HS. The percentage of cells in the gated area is shown in the dot plots.
Fig 5
Fig 5
KLRG1 blockade recovers the impaired IFN-γ production through the Akt pathway by NK cells in chronic HCV infection. (A) Purified NK cells from HCV-infected patients were incubated with anti-human KLRG1 or isotype IgG for 54 h, followed by stimulation with rhIL-12 and rhIL-2 for 18 h, and then subjected to flow cytometric analysis of intracellular IFN-γ expression levels as described Materials and Methods. With the blockade by KLRG1 antibody, IFN-γ production was upregulated. Representative dot plots measuring IFN-γ production by total CD3 CD56+ and CD3 CD56bright and CD3 CD56dim NK cell subsets with the KLRG1 blocking antibody or control IgG are shown on the left, and the average percentages of IFN-γ production by different subsets of NK cells are shown on the right. Results are expressed as means ± SD from 8 independent experiments. *, P < 0.05; **P, < 0.01. (B) The frequency of pAkt expression by purified NKs from 8 HCV-infected and 8 uninfected subjects following ex vivo stimulation as described in Materials and Methods. *, P < 0.05. (C) KLRG1 blockade restores the phosphorylation of Akt in NK cells from HCV-infected patients. Purified CD56+ NK cells from HCV-infected patients and HS were incubated with anti-human KLRG1 or isotype control IgG in the presence of rhIL-12 and rhIL-2 for 72 h, then costimulated with rhIL-15 for 1 h, followed by intracellular staining of phosphorylated Akt, and then analyzed by flow cytometry as described in Materials and Methods. The representative flow histogram overlap against isotype control staining (gray-filled area) for pAkt expression in NK cells with IgG (blue line) versus anti-KLRG1 (red line) treatment is shown on the left, and summary data of the percentage and mean fluorescence intensity of pAkt expression in NK cells from 6 HS versus 6 HCV-infected patients, treated with the IgG control versus KLRG1 blocking antibody is shown on the right. *, P < 0.05; **, P < 0.01.

Similar articles

Cited by

References

    1. Shepard CW, Finelli L, Alter MJ. 2005. Global epidemiology of hepatitis C virus infection. Lancet Infect. Dis. 5:558–567 - PubMed
    1. Liang TJ, Rehermann B, Seeff LB, Hoofnagle JH. 2000. Pathogenesis, natural history, treatment, and prevention of hepatitis C. Ann. Intern. Med. 132:296–305 - PubMed
    1. Farci P, Alter HJ, Govindarajan S, Wang DC, Engle R, Desai SM, Miller RH, Ogata N. 1992. Lack of protective immunity against reinfection with hepatitis C virus. Science 258:135–140 - PubMed
    1. Major ME, Dahari H, Mihalik K, Puig M, Rice CM. 2004. Hepatitis C virus kinetics and host responses associated with disease and outcome of infection in chimpanzees. Hepatology 39:1709–1720 - PubMed
    1. Walker CM. 2010. Adaptive immunity to the hepatitis C virus. Adv. Virus Res. 78:43–86 - PMC - PubMed

Publication types