. 2013 Oct;24(19):3097-114.
doi: 10.1091/mbc.E13-05-0289. Epub 2013 Aug 21.

Protein kinase C activation decreases peripheral actin network density and increases central nonmuscle myosin II contractility in neuronal growth cones

Affiliations

Protein kinase C activation decreases peripheral actin network density and increases central nonmuscle myosin II contractility in neuronal growth cones

Qing Yang et al. Mol Biol Cell. 2013 Oct.

Abstract

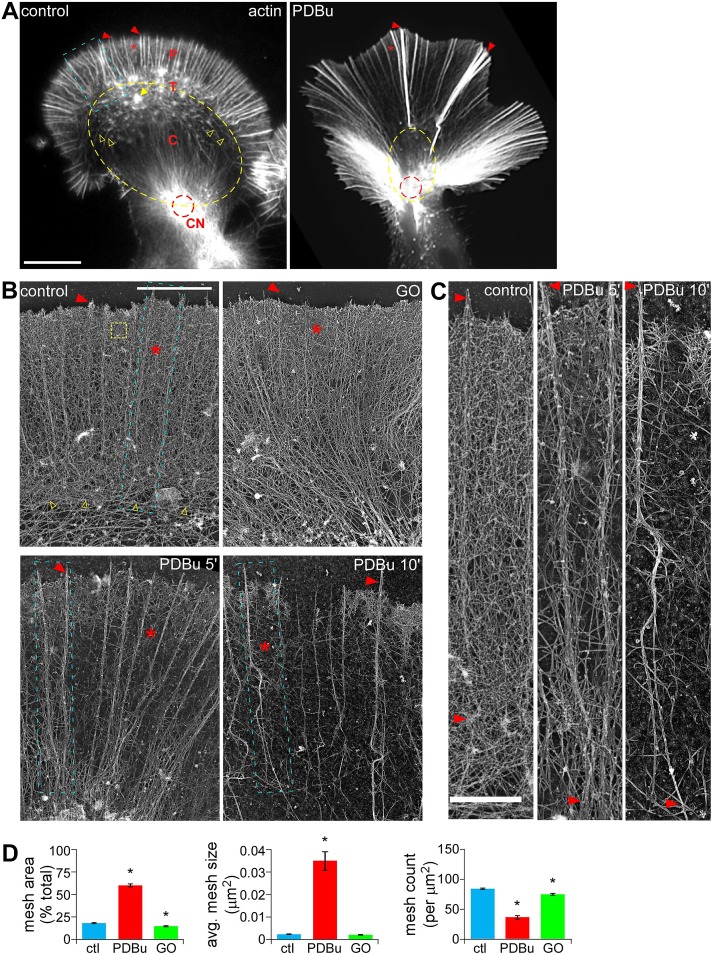
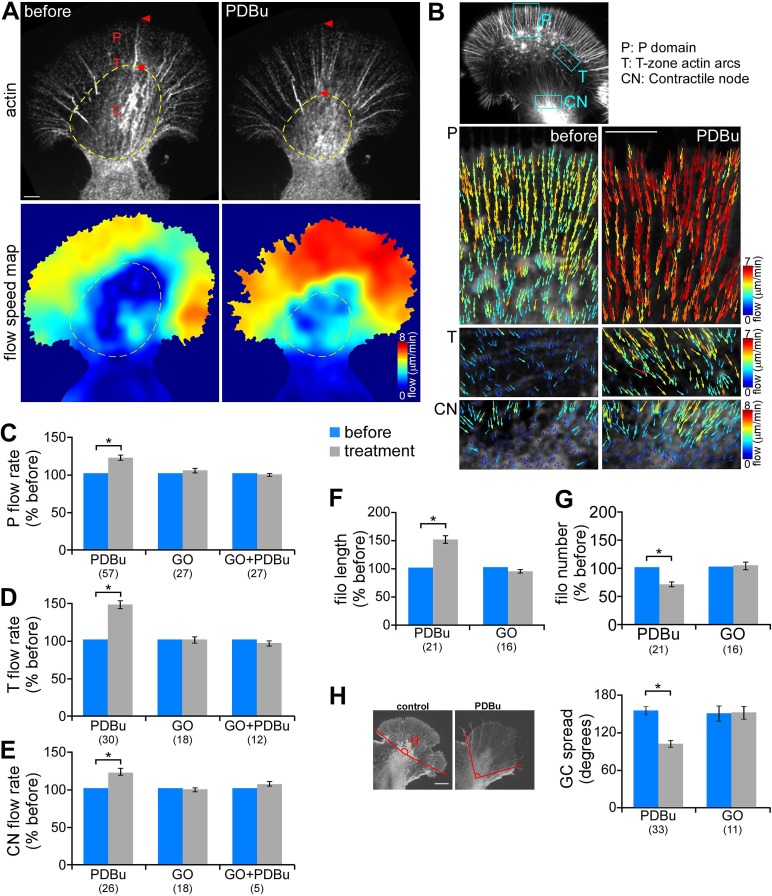
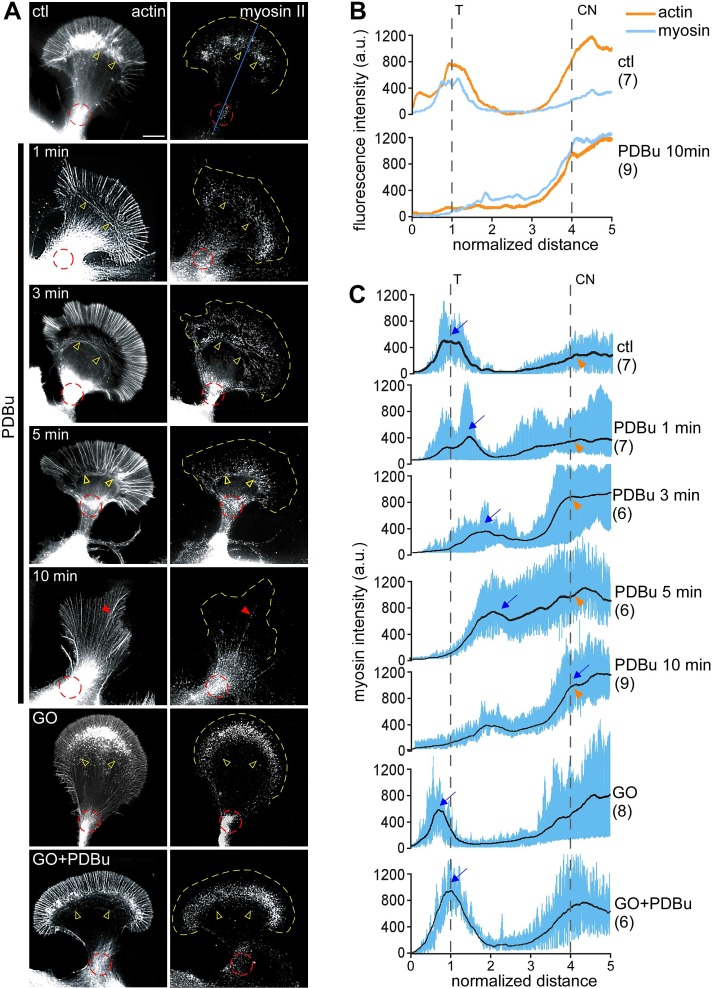
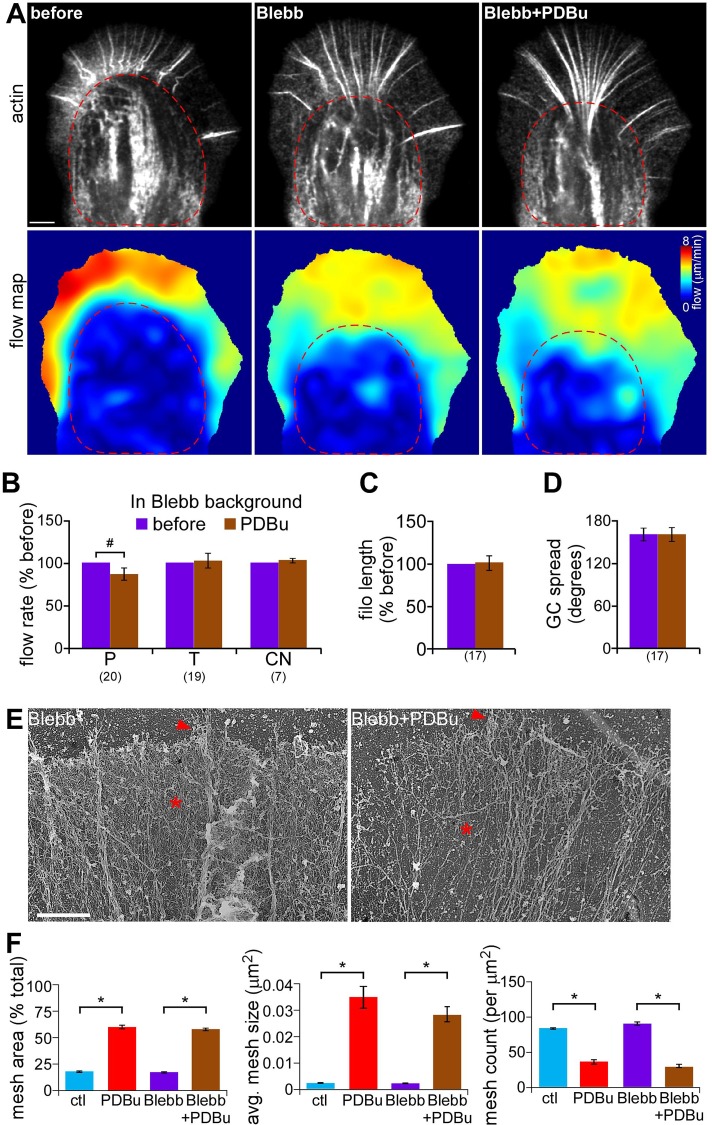
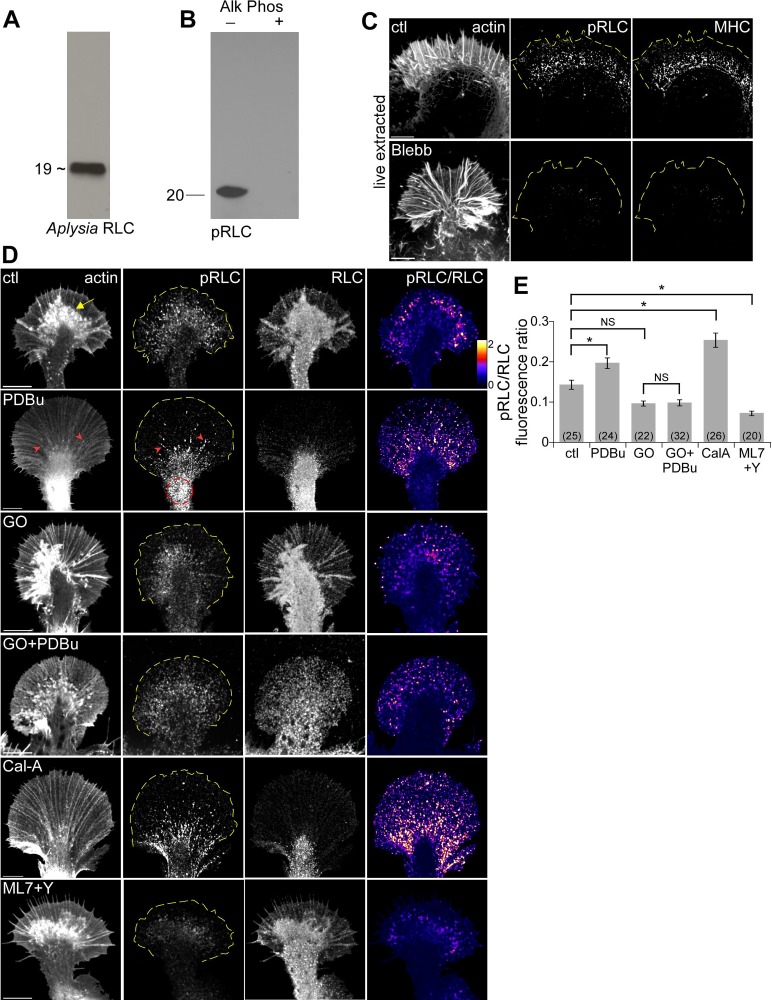
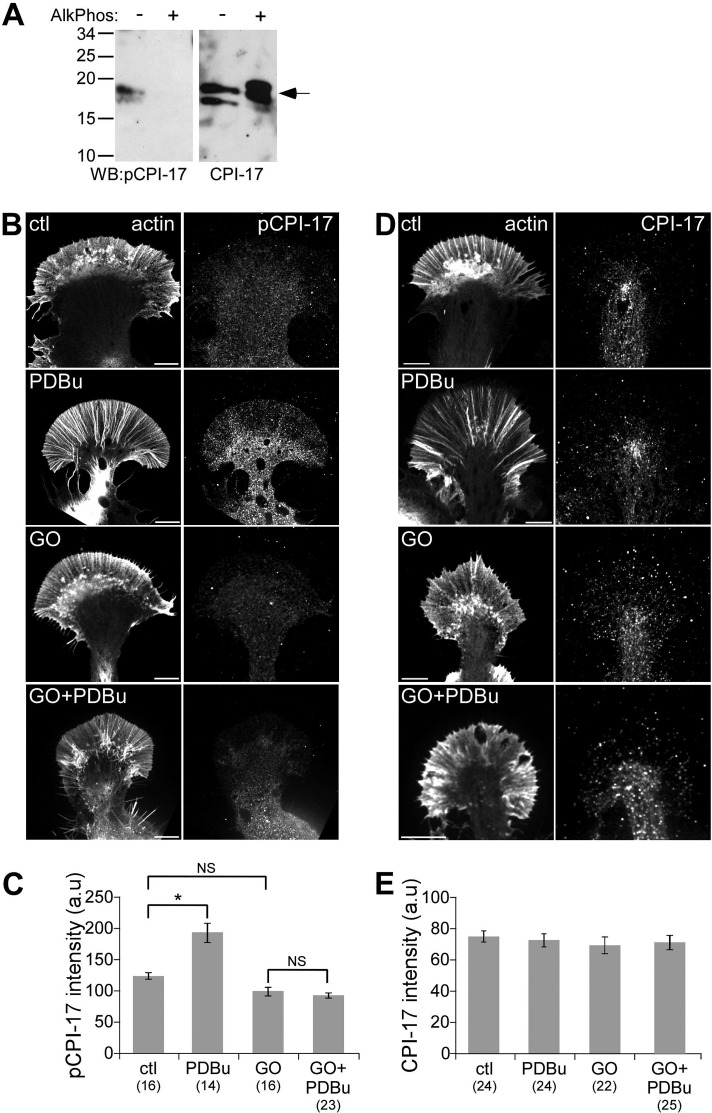
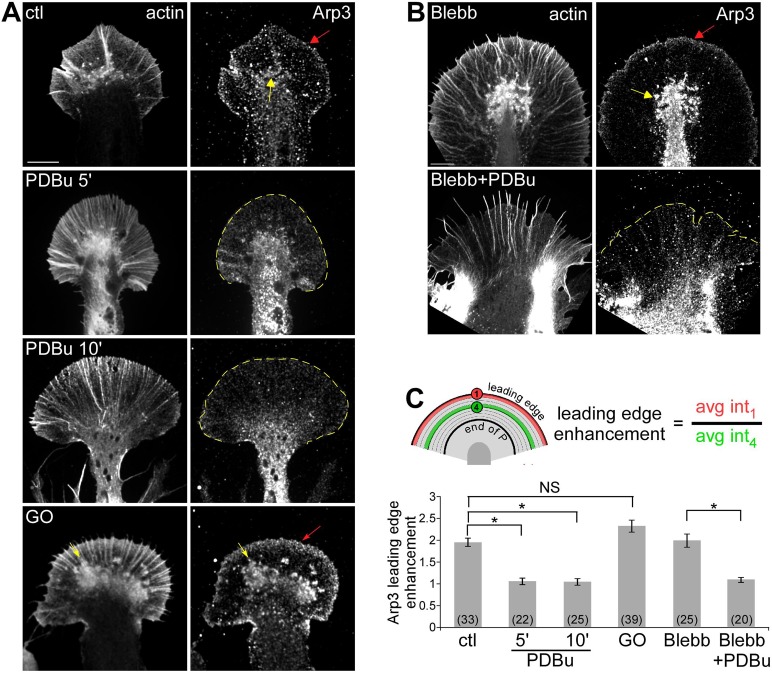
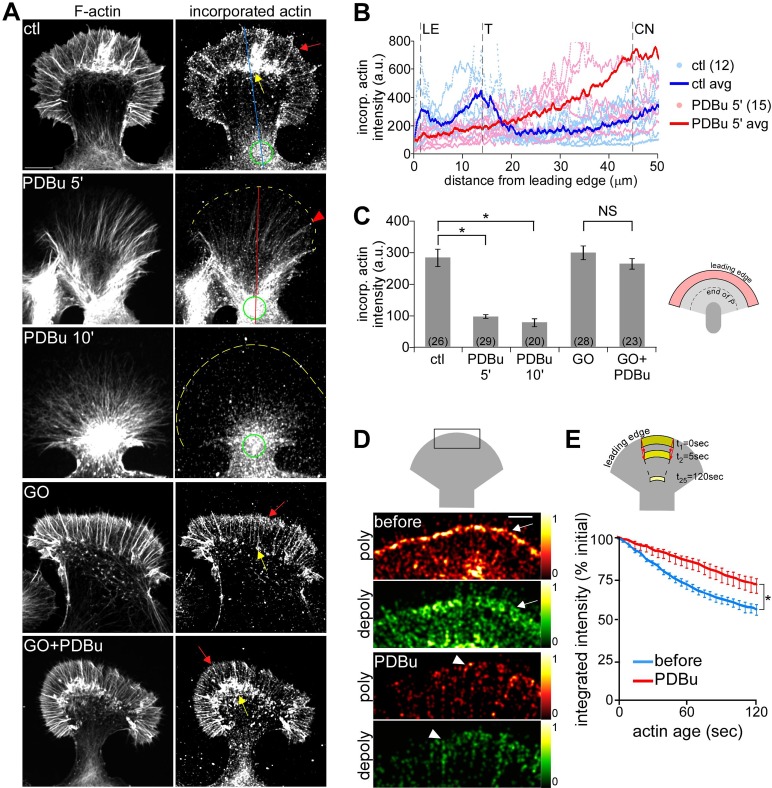
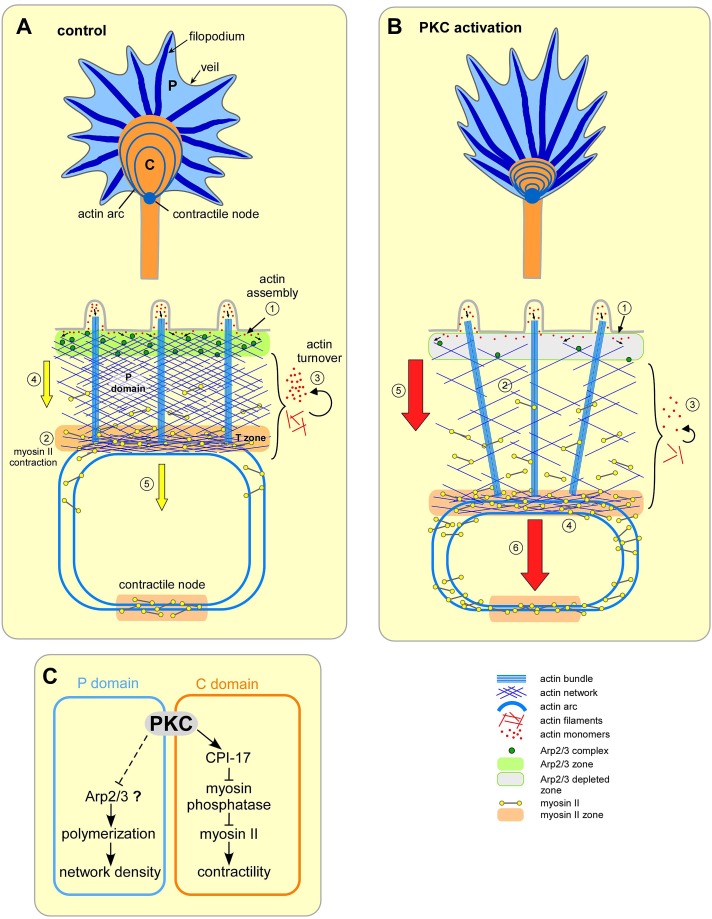
Protein kinase C (PKC) can dramatically alter cell structure and motility via effects on actin filament networks. In neurons, PKC activation has been implicated in repulsive guidance responses and inhibition of axon regeneration; however, the cytoskeletal mechanisms underlying these effects are not well understood. Here we investigate the acute effects of PKC activation on actin network structure and dynamics in large Aplysia neuronal growth cones. We provide evidence of a novel two-tiered mechanism of PKC action: 1) PKC activity enhances myosin II regulatory light chain phosphorylation and C-kinase-potentiated protein phosphatase inhibitor phosphorylation. These effects are correlated with increased contractility in the central cytoplasmic domain. 2) PKC activation results in significant reduction of P-domain actin network density accompanied by Arp2/3 complex delocalization from the leading edge and increased rates of retrograde actin network flow. Our results show that PKC activation strongly affects both actin polymerization and myosin II contractility. This synergistic mode of action is relevant to understanding the pleiotropic reported effects of PKC on neuronal growth and regeneration.


Figures

FIGURE 1:
FIGURE 1:
PKC activation induced retraction response and depleted P-domain actin veil networks in Aplysia growth cones (GCs). (A) Representative phalloidin labeling of control and PDBu-treated (100 nM, 10 min) GCs after regular fixation. (B) Representative rotary shadowed electron micrographs of the P domain and T zone (similar to blue boxed region in A) of GCs treated with DMSO (control), Go6976 (10 μM, 10 min), or PDBu (100 nM, 5 and 10 min). (C) High magnification of areas marked by blue boxes in B, showing filopodial bundles and intervening veil regions. (D) Quantification of actin veil meshwork parameters from 1 × 1–μm2 P-domain regions (similar to yellow dotted box in B). n = 102 regions from nine GCs for control; 73 regions from five GCs for PDBu (100 nM, 10 min); and 73 regions from four GCs for Go6976. C, central domain; CN, contractile node; P, peripheral domain; T, transition zone; red arrowhead, filopodium; asterisk, actin veil, yellow open arrowhead, actin arcs; yellow arrow, intrapodia; red dotted circle, contractile node. p < 0.01 two-tailed unpaired t test. Scale bars, 10 μm (A), 5 μm (B), 1 μm (C).
FIGURE 2:
FIGURE 2:
PKC activation increased retrograde actin filament flow rate and contraction of central actin networks. (A) Representative actin FSM images (top) and corresponding spatially averaged flow speed maps (bottom) from a growth cone injected with Alexa 594–phalloidin before and after PDBu treatment (100 nM, 10 min). Yellow dotted circle marks the C-domain boundary. (B) Representative flow vector fields in the P domain (top), T zone enriched with actin arcs (middle), and contractile node (bottom) before and after PDBu treatment. Each field was obtained from an area similar to the boxed region in the inset, respectively. On both flow speed and vector maps, colors encode flow magnitude (see color bar). Vectors also indicate the flow direction. (C–E) Summary of relative changes in P-domain (C), T-zone (D), and contractile node (E) actin network translocation rates in response to PDBu (100 nM, 10–30 min), Go6976 (10 μM, 10–30 min), or pretreatment with Go6976 (10 min) followed by cotreatment with Go6976 and PDBu (10–30 min). Translocation rates were calculated by averaging the vector magnitude within regions similar to those shown in B or by kymograph analysis. (F, G) Average filopodium length (F) and number (G) measured in growth cones before and after treatment with PDBu or Go6976. Data are normalized to the values before drug addition for each growth cone. (H) Growth cone spread before and after treatment with PDBu or Go6976 measured as the angle formed by outermost filopodial actin bundles (θ in schematic). Numbers in parentheses, growth cones measured. *p < 0.01, two-tailed paired t test. Scale bars, 5 μm.
FIGURE 3:
FIGURE 3:
PKC activation promoted a ring-like contractile response mediated by redistribution of myosin II to actin contractile node. (A) Fluorescence labeling of growth cones with myosin II heavy chain tail antibody (right) and tetramethylrhodamine isothiocyanate (TRITC)–phalloidin (left) after live-cell extraction. Growth cones were treated with DMSO, PDBu (100 μM, 1–10 min), or Go6976 (10 μM, 10 min) or pretreated with Go6976 (10 min), followed by Go6976 and PDBu (10 min). Yellow open arrowhead, actin arc; red dotted circle, contractile node; red arrowhead, filopodia; yellow dotted line traces the leading edge. (B) Line scan analysis of actin (orange) and myosin II (blue) fluorescence intensities under control conditions or after 10-min treatment with PDBu. Line scans (50 pixels in width, five times the P domain in length) were sampled along the growth axis, as represented by the blue line on the top in A. Traces in this graph are the average values of multiple growth cones. (C) Line scan analysis of myosin II localization in growth cones under the conditions in A. Samples were measured in a manner similar to B. Blue lines represent data from individual growth cones. Black lines represent the population average. CN, contractile node; T, transition zone; blue arrow, peak of myosin II fluorescence in T zone; orange arrowhead, myosin II fluorescence at contractile node. Number in parentheses, growth cones measured. Scale bar, 10 μm.
FIGURE 4:
FIGURE 4:
Myosin II inhibition prevented PKC-induced actin flow increase and contractile response but not the depletion of P-domain actin networks. (A) Representative actin FSM images (top) and corresponding spatially averaged flow speed maps (bottom) from a growth cone injected with Alexa 594–phalloidin under control conditions (left), in blebbistatin (60 μM, 10 min), and after PDBu (100 nM, 10 min) addition in blebbistatin background. Red dotted line marks C-domain boundary. (B) Summary of relative changes in P-domain, T-zone, and contractile node retrograde flow rates in response to PDBu (100 nM, 10–30 min) in blebbistatin background. (C, D) Average filopodium length (C) and growth cone spread (D) in growth cones treated as in B. Number in parentheses, growth cones measured. (E) EM of growth cone P domain after treatment with blebbistatin (60 μM, 10 min) or pretreatment with blebbistatin followed by cotreatment with blebbistatin and 100 nM PDBu for 10 min. Arrowhead, filopodium; asterisk, actin veil. (F) Quantification of actin veil meshwork parameters for growth cones treated as in E. Data for control and PDBu from Figure 1D are shown for comparison. N = 68 regions from five GCs for blebbistatin and 62 regions from four GCs for blebbistatin and PDBu. *p < 0.01 and #p < 0.05 with two-tailed paired (B–D) and unpaired (F) t tests. Scale bar, 5 μm (A), 2 μm (E).
FIGURE 5:
FIGURE 5:
PKC activation increased myosin II regulatory light chain phosphorylation. (A) Western blots of Aplysia CNS proteins probed with rabbit anti–Aplysia RLC sera recognizing ∼19-kDa band. (B) Western blot of control and alkaline phosphatase–treated Aplysia CNS homogenate with a mouse monoclonal antibody against conserved pSer19 on human myosin II regulatory light chain (pRLC). (C) Growth cones were live cell extracted and labeled with TRITC–phalloidin (left), antibody against conserved pSer19 on human myosin II regulatory light chain (pRLC; middle), and antibody against Aplysia myosin II heavy chain (MHC; right) after treatment with DMSO or blebbistatin (60 μM, 10 min). (D) Immunolabeling of growth cones with pRLC antibody and total Aplysia RLC antibody after normal fixation. F-actin was visualized with phalloidin. Right, ratio of pRLC and Aplysia RLC after background subtraction, encoded in a linear pseudocolor lookup table (see color bar). Growth cones were treated with DMSO, PDBu (100 nM, 10 min), Go6976 (10 μM, 10 min), Go6976 and PDBu (10 min) after Go6976 pretreatment, calyculin A (50 nM, 20 min), or combination of Y27632 and ML7 (10 μM each, 20 min). Yellow arrow, intrapodia; red arrowhead, filopodium; red dotted circle, contractile node; yellow dotted line traces the leading edge. (E) Quantification of average pRLC/RLC fluorescence ratio in entire growth cones for each of the conditions in D. Numbers in parentheses, growth cones measured. p < 0.0001 with single-factor ANOVA. Asterisk indicates significant difference using Tukey's HSD post hoc analysis. NS, not significant. Scale bars, 10 μm.
FIGURE 6:
FIGURE 6:
PKC activation increased CPI-17 phosphorylation. (A) Western blot of control and alkaline phosphatase–treated Aplysia CNS homogenate with antibodies against total and pThr38 CPI-17. (B, D) Immunolabeling of growth cones with antibodies against p-CPI-17 (B) or total CPI-17 (D) after normal fixation. F-actin was visualized with phalloidin. Growth cones were treated with DMSO, PDBu (100 nM, 10 min), Go6976 (10 μM, 10 min), or Go6976 and PDBu (10 min) after Go6976 pretreatment. (C, E) Quantification of average p-CPI-17 (C) and total CPI-17 (E) fluorescence intensity in entire growth cones for each of the conditions in B and D. Numbers in parentheses, growth cones measured. For C, p < 0.0001 with-single factor ANOVA. Asterisk indicates significant difference using Tukey's HSD post hoc analysis. NS, not significant. For E, p = 0.89 with single-factor ANOVA. Scale bars, 10 μm.
FIGURE 7:
FIGURE 7:
PKC activation disrupted Arp2/3 complex localization at the leading edge independent of myosin II activity. (A, B) Fluorescence labeling of growth cones with phalloidin and Arp3 antibody after normal fixation. (A) Growth cones were treated with DMSO, PDBu (100 nM, 5 and 10 min), or Go6976 (10 μM, 10 min). (B) Growth cones treated with blebbistatin (60 μM, 10 min) or pretreatment with blebbistatin followed by cotreatment with blebbistatin and 100 nM PDBu for 10 min. Red arrow, band of concentrated Arp2/3 complex localization at the leading edge; yellow arrow, intrapodia. Yellow dotted line traces the leading edge. Scale bar, 10 μm. (C) Quantification of Arp2/3 complex enrichment at the leading edge for each condition in A and B. The enrichment was calculated as the ratio of Arp3 fluorescence along the leading edge to a parallel region in the adjacent P domain (schematic). p < 0.0001 with single-factor ANOVA, Asterisk indicates significant difference using Tukey's HSD post hoc analysis. NS, not significant.
FIGURE 8:
FIGURE 8:
PKC activation reduced barbed-end density and actin polymerization event density along the leading edge. (A) Growth cones were live extracted and labeled with TRITC–phalloidin to show total F-actin (left) and Alexa 488 G-actin, which incorporated at filament barbed ends (right). Growth cones were treated with DMSO (top), PDBu (100 nM, 5 and 10 min), or Go6976 (10 μM, 10 min) or pretreated with Go6976 followed by cotreatment with Go6976 and PDBu for 10 min. Red arrow, band of concentrated barbed ends near the leading edge; yellow arrow, intrapodia; red arrowheads, filopodia; yellow dotted line traces the leading edge; green circles, contractile node. (B) Line scan analysis of barbed-end localization in control and PDBu-treated (100 nM, 5 min) growth cones. Line scans (50 pixels in width) were sampled along the growth axis of growth cones (similar to blue and red lines in the respective panels of A). Scattered dots represent data set from individual growth cones. Solid lines represent the population average. CN, contractile node; LE, leading edge; T, transition zone. (C) Average barbed-end intensities in the distal half of the P domain for different treatment conditions in A. p < 0.0001 with single-factor ANOVA. Asterisk indicates significant difference using Tukey's HSD post hoc analysis. NS, not significant. Numbers in parentheses, growth cones measured. (D) Steady-state map of actin assembly (red) and disassembly (green) events near the leading edge of a growth cone (schematic) before and after PDBu (100 nM, 10 min) treatment. Maps were generated from FSM images of a growth cone injected with Alexa 568 G-actin. Colors indicate relative assembly or disassembly event densities (see color bars). Red and green arrows, respectively, mark the band of strong assembly near the leading edge and the region of strong disassembly proximally juxtaposed to the assembly band. Arrowheads mark filopodia tips. (E) Population average of changes in integrated actin network fluorescence intensity within the flow-displaced regions before and after PDBu (100 nM, 10–30 min) measured by the ROI-based turnover algorithm (schematic). n = 9 growth cones, 3–5 ROIs per growth cone. *p < 0.01, two-tailed paired t test. Scale bars, 10 μm (A), 5 μm (D).
FIGURE 9:
FIGURE 9:
Summary of key results. (A) Control conditions. Top, relevant structures in the P and C growth cone domains. Bottom: 1) Arp2/3 complex–dependent actin veil polymerization at the leading edge. 2) Myosin II–dependent network contraction at the T zone and contractile node. 3) Network recycling throughout the P domain. 4) P-domain retrograde flow. 5) T-zone flow. (B) PKC activation. Top, actin veil retracts and C-domain compresses. Bottom, 1) Delocalization of Arp2/3 complex and reduced assembly sites at the leading edge. 2) Decreased actin veil network density. 3) Reduced network turnover in the P domain. 4) Activation and enhanced localization of myosin II on actin arcs and at the contractile node. 5) Increased P-domain retrograde flow. 6) Increased central actin flow. (C) Proposed signaling pathways for dual cytoplasmic domain-specific effects of PKC activation.

Similar articles

Cited by

References

    1. Allingham JS, Smith R, Rayment I. The structural basis of blebbistatin inhibition and specificity for myosin II. Nat Struct Mol Biol. 2005;12:378–379. - PubMed
    1. Bailly M, Macaluso F, Cammer M, Chan A, Segall JE, Condeelis JS. Relationship between Arp2/3 complex and the barbed ends of actin filaments at the leading edge of carcinoma cells after epidermal growth factor stimulation. J Cell Biol. 1999;145:331–345. - PMC - PubMed
    1. Beach JR, Licate LS, Crish JF, Egelhoff TT. Analysis of the role of Ser1/Ser2/Thr9 phosphorylation on myosin II assembly and function in live cells. BMC Cell Biol. 2011;12:52. - PMC - PubMed
    1. Bement WM, Capco DG. Analysis of inducible contractile rings suggests a role for protein kinase C in embryonic cytokinesis and wound healing. Cell Motil Cytoskeleton. 1991;20:145–157. - PubMed
    1. Bonsall J, Rehder V. Regulation of chick dorsal root ganglion growth cone filopodia by protein kinase C. Brain Res. 1999;839:120–132. - PubMed

Publication types