. 2013 Oct;24(20):3164-76.
doi: 10.1091/mbc.E13-03-0142. Epub 2013 Aug 21.

Tissue-specific and SRSF1-dependent splicing of fibronectin, a matrix protein that controls host cell invasion

Affiliations

Tissue-specific and SRSF1-dependent splicing of fibronectin, a matrix protein that controls host cell invasion

Isabel Cristina Lopez-Mejia et al. Mol Biol Cell. 2013 Oct.

Abstract

Cell invasion targets specific tissues in physiological placental implantation and pathological metastasis, which raises questions about how this process is controlled. We compare dermis and endometrium capacities to support trophoblast invasion, using matching sets of human primary fibroblasts in a coculture assay with human placental explants. Substituting endometrium, the natural trophoblast target, with dermis dramatically reduces trophoblast interstitial invasion. Our data reveal that endometrium expresses a higher rate of the fibronectin (FN) extra type III domain A+ (EDA+) splicing isoform, which displays stronger matrix incorporation capacity. We demonstrate that the high FN content of the endometrium matrix, and not specifically the EDA domain, supports trophoblast invasion by showing that forced incorporation of plasma FN (EDA-) promotes efficient trophoblast invasion. We further show that the serine/arginine-rich protein serine/arginine-rich splicing factor 1 (SRSF1) is more highly expressed in endometrium and, using RNA interference, that it is involved in the higher EDA exon inclusion rate in endometrium. Our data therefore show a mechanism by which tissues can be distinguished, for their capacity to support invasion, by their different rates of EDA inclusion, linked to their SRSF1 protein levels. In the broader context of cancer pathology, the results suggest that SRSF1 might play a central role not only in the tumor cells, but also in the surrounding stroma.


Figures
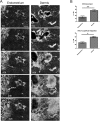
FIGURE 1:
FIGURE 1:
Endometrium and dermis fibroblasts show distinct capacities in fostering EVCT migration. Human placental explants were seeded on confluent layers of endometrium or dermis human primary fibroblasts. Sixteen hours later, the culture plates were rinsed several times to discard all unbound villi. (A) Migration of EVCTs produced by the trophoblast villi was followed by phase-contrast time-lapse microscopy of camera-scanned fields (nine contiguous fields). T0 is the beginning of the time lapse. Left, EVCTs exiting from the trophoblast villi and migrating with the endometrium cell layer (EVCT migration movements indicated by arrows; see Supplemental Video S1). On dermis (right), movement of the villi explants were observed (arrowheads), and EVCT cells appeared much more refringent and performed a superficial migration instead of the interstitial migration observed on endometrium (Supplemental Video S2). Bar, 300 μm. Similar findings were obtained with two other placentas. (B) Statistical analysis of trophoblastic villi mobility and EVCT superficial migration for cocultures with either endometrium or dermis fibroblasts. Data were obtained with trophoblastic villi (290 analyzed on endometrium and 240 on dermis) isolated from three placentas (in addition to the three placentas used in the time-lapse experiments) and three matching sets of fibroblasts, altogether used in five different combinations. Phase-contrast images of the cocultures were taken 24 h after seeding the trophoblastic explants and again 24 h later. Villi movement and EVCT superficial migration between these two time points were evaluated. Mean values with SEM. Two-tailed p values were determined with the Mann–Whitney rank sum test; **p = 0.008; *p = 0.01.
FIGURE 2:
FIGURE 2:
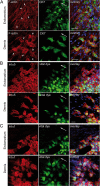
Cytotrophoblast cells display different actin cytoskeleton structures, depending on the supporting fibroblast matrix. Placental explants were cocultured with either endometrium or dermis fibroblasts for 40 h, at which point cells were fixed and stained for F-actin, cytokeratin 7, and integrins α5 and α1. (A) F-actin labeling of the cocultures shows a strong cortical staining for EVCTs, identified by cytokeratin 7 expression, when they migrate on the dermis fibroblast layer. (B, C) Integrin α5 (intα5) and α1 (intα1) labeling. Trophoblast explants were labeled with a green vital dye before the coculture with fibroblasts. After the coculture, cells were fixed and stained with the integrin antibodies. Similar results were observed in three independent experiments, with villi isolated from different placentas and tested on matching sets of dermis and endometrium fibroblasts isolated from different donors. Nuclear staining with Hoechst is shown in the overlays. Confocal microscopy sections. Arrows indicate the direction of EVCT migration. Arrowheads indicate EVCT positions. Bar, 50 μm.
FIGURE 3:
FIGURE 3:
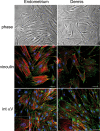
Endometrium and dermis fibroblasts display different characteristics, as exemplified by the vinculin and integrin αV expression patterns. The primary human fibroblasts isolated from endometrium and dermis tissues were compared for their cell morphology, as shown by phase-contrast microscopy, as well as for their actin network organization, visualized by rhodamine–phalloidin, and vinculin and integrin αV staining. Four matching sets of endometrial and dermal fibroblasts were tested and yielded similar images. Confocal microscopy sections are shown with nuclei stained with Hoechst. Bar, 50 μm; higher magnification, 10 μm.
FIGURE 4:
FIGURE 4:
Expression of ECM components and adhesion molecules by endometrium and dermis fibroblasts. (A) RNAs were prepared from two independent cultures for each of four matching sets of dermis and endometrium fibroblasts. The relative expression levels of extracellular matrix components and adhesion molecules were determined by RT-qPCR. Data obtained for each endometrium (•) and dermis (◯) primary cell line are plotted, and the corresponding median bars are indicated. The ribosomal phosphoprotein RPLP0 and actin were used as controls. (B) Protein fractions corresponding to the culture supernatants (Sup) and the ECM and cellular proteins (ECM + C) from matching sets of endometrium (E) and dermis (D) fibroblasts were analyzed by Western blot (left). The fibronectin (FN) and actin amount in the ECM+C fraction was quantified with the Odyssey system (LI-COR, Lincoln, NE). The fibronectin amounts relative to actin are plotted with an indication of the median value for both the endometrium (•) and dermis (◯) cultures (right).
FIGURE 5:
FIGURE 5:
Endometrium and dermis fibroblasts express different fibronectin-splicing isoforms, leading to different matrix patterns. (A) Fibronectin alternative splicing in endometrium and dermis fibroblasts was tested by RT-PCR using primers encompassing the alternatively spliced EDA, EDB, and IIICS regions, respectively. The PCR products were analyzed by gel electrophoresis (DNA size markers in base pairs). The inclusion/exclusion of the exons was further confirmed by sequencing of the DNA from the bands marked with asterisks. Right, PSI values determined for the three FN exons, EDA, EDB, and IIICS, for endometrium (E) and dermis (D) fibroblasts obtained from four different donors. (B) Protein samples corresponding to the insoluble matrix fractions (deoxycholate extraction) from matching sets of endometrium and dermis fibroblasts, as well as of the dermis fibroblasts supplemented with plasma fibronectin for 3 d (+FN), were analyzed by Western blot, using an intermediate filament, lamin A/C, as a loading control. The total and EDA-containing fibronectin amounts were quantified with the Odyssey system. The fibronectin amounts relative to lamin A are plotted. (C) Increasing amounts of plasma fibronectin were added to dermis cultures for 8 h. The protein fraction corresponding to the culture supernatant (top) and the ECM and cell content (bottom) were analyzed for their content in total FN and in EDA+ FN. The amounts of FN protein were quantified and are shown in the graph. For total FN: 5 μg, p = 0.0481 (*); 10 μg, p = 0.0440 (*); 25 μg, p = 0.00891 (**); 50 μg, p = 0.0120 (*). No significant differences were found for the content in EDA+ FN, with p ranging from 0.6025 to 0.9237. (D) Endometrium and dermis fibroblasts were seeded in the same conditions as for the cocultures. For the fibronectin supplementation conditions (dermis+ FN), pFN was added to dermis fibroblasts at the time of the culture. Four days later, cultures were fixed and stained for total fibronectin (FN total), EDA-containing fibronectin (FN– EDA), and Hoechst (shown in the overlays). Confocal microscopy sections. Bar, 100 μm; higher magnification, 20 μm. Arrows show FN that is presumably EDA–, as it was bound by the anti-FN antibody (stained in red) and not by the anti–FN EDA antibody.
FIGURE 6:
FIGURE 6:
Fibronectin supplementation of the dermis cell layer enhances trophoblast interstitial migration. Cocultures were set up between human trophoblast explants and endometrial fibroblasts, dermal fibroblasts, or dermal fibroblasts supplemented with plasma fibronectin. After 16 h of coculture, phase-contrast pictures were taken (T0) and again 24 h later (T24h). (A) Phase-contrast micrographs show interstitial EVCT migration for cocultures on endometrium and fibronectin-supplemented dermis fibroblasts and superficial EVCT mass migration (refringent packed EVCTs) in dermis coculture conditions. (B) The type of EVCT migration (superficial vs. interstitial), as well as the occurrence of trophoblast villi movement, were analyzed in the three coculture conditions. Data points corresponding to each of the independent cultures are plotted, and the median values are indicated. Two-tailed p values were determined with the Mann–Whitney rank sum test. For villi movement, **p = 0.007, *p = 0.036; for EVCT migration, **p = 0.002, *p = 0.015.
FIGURE 7:
FIGURE 7:
Fibronectin supplementation of a synthetic 3D collagen I matrix promotes isolated trophoblast cell migration. Trophoblastic villi were embedded within a 3D collagen I matrix (coll I) supplemented with plasma fibronectin when indicated (coll I/Fn). At day 4, phase-contrast pictures of the cultures were taken. Three types of EVCT migration were identified for coll I/Fn cultures (A; schematized in B): “isolated” migration, corresponding to the migration of single EVCTs in all directions; “packed” cell migration; and “no migration,” for EVCTs showing a low capacity to migrate away from the trophoblastic villi. Bar, 100 μm. (B) Statistical analysis of EVCT migration in coll I and coll I/Fn 3D culture conditions. Data were obtained with villi isolated from four placentas (>100 trophoblastic villi analyzed in each condition). For each placenta, the number of villi giving rise to each type of EVCT migration was rated and is expressed as a percentage of the total number of villi for this placenta. The median value is indicated for 3D cultures performed in collagen I (•) or in collagen I supplemented with plasma fibronectin (◯).
FIGURE 8:
FIGURE 8:
Concentration and phosphorylation levels of the SR protein SRSF1 in endometrium and dermis fibroblasts. Cell extracts were prepared from matching sets of primary endometrial (E) and dermal (D) fibroblasts and analyzed by Western blotting. (A) Proteins were probed with antibodies recognizing phosphorylated SR proteins (mAb104), glyceraldehyde-3-phosphate dehydrogenase as well as ERK in both its phosphorylated and unmodified states. (B) The relative amount of SRSF1 protein was quantified with the Odyssey Infrared Imaging system, using actin levels to normalize. Data points from five independent experiments performed with endometrium (•) and dermis (◯) are plotted, and the median value is indicated. The two-tailed p value was determined with the Mann–Whitney rank sum test. ***p = 0.0003. (C) The phosphorylation pattern of SRSF1 in endometrium and dermis fibroblasts was determined by 2D gel electrophoresis. The pH range and the molecular weight markers (in kilodaltons) are indicated.
FIGURE 9:
FIGURE 9:
Silencing of SRSF1 in endometrium reduces inclusion of fibronectin EDA exon. (A) For silencing experiments, transfections were performed with two SRSF1-targeting siRNAs (siRNA1 and siRNA2), as well as with a scrambled siRNA (siRNA scr), which was used as a control. Data obtained with cells recovered 3 d after the siRNA transfection (similar data were obtained with two rounds of 3-d transfections, with cells collected at day 6). Total protein extracts were analyzed by Western blotting for total FN, FN containing the EDA domain, SRSF1, and, as a loading control, γ-tubulin. Relative protein values were normalized to γ-tubulin concentrations. (B) Fibronectin alternative splicing in each condition was tested by RT-PCR, using primers encompassing the alternatively spliced EDA and EDB domains. PCR products were analyzed by gel electrophoresis. (A, B) Mean values with SEM. The p values were determined by a paired t test: for FN EDA, p = 0.013 (*); for FN EDB, p = 0.058 (ns). (C) In addition, control and siRNA-treated RNA samples (n = 4 per group) were compared at the Sherbrooke RNomics platform to determine PSI for 46 alternative splicing events, including the EDA and EDB exon alternative splicings. The results are presented as a heat map showing the unsupervised hierarchical clustering of the change in splicing (ΔPSI = PSI value of the control endometrium − PSI value of the SRSF1-depleted endometrium). Splicing changes (ΔPSI values) are represented in shades of bright green (exon skipping upon SRSF1 depletion) to red (exon inclusion), as schematized in the color key histogram.
FIGURE 10:
FIGURE 10:
Mechanisms for the different capacities of endometrium and dermis tissues to support trophoblast invasion. 1) Endometrium fibroblasts produce higher concentrations of the SR protein SRSF1 than dermis fibroblasts, which leads 2) to higher inclusion rates of the EDA exon in the fibronectin produced by endometrium and consequently 3) to an endometrium extracellular matrix that contains more and thicker fibronectin bundles than dermis. 4) This results in a better capacity for the endometrium tissue than for dermis to support trophoblast invasion.

Similar articles

Cited by

References

    1. Abe Y, Bui-Thanh NA, Ballantyne CM, Burns AR. Extra domain A and type III connecting segment of fibronectin in assembly and cleavage. Biochem Biophys Res Commun. 2005;338:1640–1647. - PubMed
    1. Al-Ayoubi AM, Zheng H, Liu Y, Bai T, Eblen ST. Mitogen-activated protein kinase phosphorylation of splicing factor 45 (SPF45) regulates SPF45 alternative splicing site utilization, proliferation, and cell adhesion. Mol Cell Biol. 2012;32:2880–2893. - PMC - PubMed
    1. Aplin JD, Haigh T, Jones CJ, Church HJ, Vicovac L. Development of cytotrophoblast columns from explanted first-trimester human placental villi: role of fibronectin and integrin alpha5beta1. Biol Reprod. 1999;60:828–838. - PubMed
    1. Astrof S, Crowley D, Hynes RO. Multiple cardiovascular defects caused by the absence of alternatively spliced segments of fibronectin. Dev Biol. 2007;311:11–24. - PMC - PubMed
    1. Barash Y, Calarco JA, Gao W, Pan Q, Wang X, Shai O, Blencowe BJ, Frey BJ. Deciphering the splicing code. Nature. 2010;465:53–59. - PubMed

Publication types

MeSH terms