. 2013 Oct 1;178(7):1129-38.
doi: 10.1093/aje/kwt094. Epub 2013 Aug 21.

Diarrhea in early childhood: short-term association with weight and long-term association with length

Diarrhea in early childhood: short-term association with weight and long-term association with length

Stephanie A Richard et al. Am J Epidemiol. .

Abstract

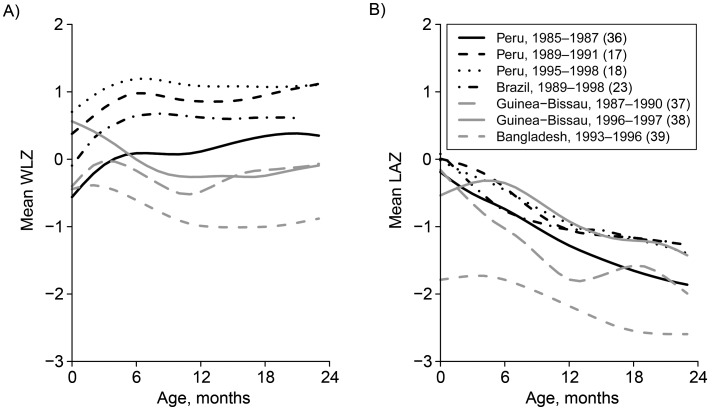
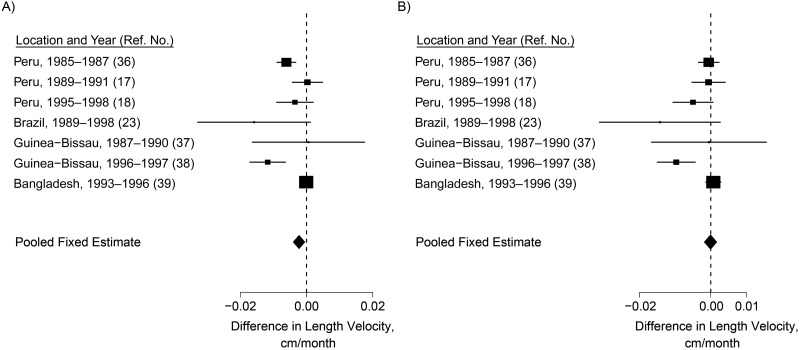
The short-term association between diarrhea and weight is well-accepted, but the long-term association between diarrhea and growth is less clear. Using data from 7 cohort studies (Peru, 1985-1987; Peru, 1989-1991; Peru, 1995-1998; Brazil, 1989-1998; Guinea-Bissau, 1987-1990; Guinea-Bissau, 1996-1997; and Bangladesh, 1993-1996), we evaluated the lagged relationship between diarrhea and growth in the first 2 years of life. Our analysis included 1,007 children with 597,638 child-days of diarrhea surveillance and 15,629 anthropometric measurements. We calculated the associations between varying diarrhea burdens during lagged 30-day periods and length at 24 months of age. The cumulative association between the average diarrhea burden and length at age 24 months was -0.38 cm (95% confidence interval: -0.59, -0.17). Diarrhea during the 30 days prior to anthropometric measurement was consistently associated with lower weight at most ages, but there was little indication of a short-term association with length. Diarrhea was associated with a small but measurable decrease in linear growth over the long term. These findings support a focus on prevention of diarrhea as part of an overall public health strategy for improving child health and nutrition; however, more research is needed to explore catch-up growth and potential confounders.

Keywords: child health; diarrhea; malnutrition; stunting; wasting.


Figures

Figure 1.
Figure 1.
Length (cm) and weight (kg) measurements from birth to age 23.9 months in an analysis of the association of diarrhea with weight and length, by gender (parts A and C, boys (left); parts B and D, girls (right)), among children from a multisite data set (Peru, 1985–1987 (36); Peru, 1989–1991 (17); Peru, 1995–1998 (18); Brazil, 1989–1998 (23); Guinea-Bissau, 1987–1990 (37); Guinea-Bissau, 1996–1997 (38); and Bangladesh, 1993–1996 (39)). For comparison, dotted lines indicating the World Health Organization median and dashed lines indicating ±2 z scores are superimposed on the data.
Figure 2.
Figure 2.
Mean weight-for-length z score (WLZ) (A) and length-for-age z score (LAZ) (B) from birth to age 23.9 months, by study, among children from a multisite data set (Peru, 1985–1987 (36); Peru, 1989–1991 (17); Peru, 1995–1998 (18); Brazil, 1989–1998 (23); Guinea-Bissau, 1987–1990 (37); Guinea-Bissau, 1996–1997 (38); and Bangladesh, 1993–1996 (39)). Lines were generated using a smoothing spline through the mean values at each month of age.
Figure 3.
Figure 3.
Mean prevalence of diarrhea (number of days with diarrhea per year) (A) and incidence of diarrhea (number of diarrhea episodes per year) (B) from birth to age 23.9 months, by study, among children from a multisite data set (Peru, 1985–1987 (36); Peru, 1989–1991 (17); Peru, 1995–1998 (18); Brazil, 1989–1998 (23); Guinea-Bissau, 1987–1990 (37); Guinea-Bissau, 1996–1997 (38); and Bangladesh, 1993–1996 (39)). Lines were generated using a smoothing spline through the mean values at each month of age.
Figure 4.
Figure 4.
Difference in length-for-age z score (LAZ) at age 24 months per day of diarrhea experienced during follow-up, overall and by study, among children from a multisite data set (Peru, 1985–1987 (36); Peru, 1989–1991 (17); Peru, 1995–1998 (18); Brazil, 1989–1998 (23); Guinea-Bissau, 1987–1990 (37); Guinea-Bissau, 1996–1997 (38); and Bangladesh, 1993–1996 (39)). Estimates were produced using a regression model with LAZ as the dependent variable and gender, diarrhea prevalence, and baseline LAZ as the independent variables. The size of the rectangle is proportional to the weight (1/SE2) of the study, and the 95% confidence interval is indicated by the width of the line. The width of the diamond indicates the 95% confidence interval for the pooled fixed estimate. SE, standard error.
Figure 5.
Figure 5.
Difference in 4-month weight velocity (g/month) as a function of diarrhea prevalence in the first (A) and second (B) halves of the 4-month period among children from a multisite data set (Peru, 1985–1987 (36); Peru, 1989–1991 (17); Peru, 1995–1998 (18); Brazil, 1989–1998 (23); Guinea-Bissau, 1987–1990 (37); Guinea-Bissau, 1996–1997 (38); and Bangladesh, 1993–1996 (39)). Mixed-effects models were used to calculate the estimates, and diarrhea prevalence in the first and second halves of the period, gender, and length-for-age z score at the beginning of the period were included in the model, with random effects for child. The size of the rectangle is proportional to the weight (1/SE2) of the study, and the 95% confidence interval is indicated by the width of the line. The width of the diamond indicates the 95% confidence interval for the pooled fixed estimate. SE, standard error.
Figure 6.
Figure 6.
Difference in 4-month length velocity (cm/month) as a function of diarrhea prevalence in the first (A) and second (B) halves of the 4-month period among children from a multisite data set (Peru, 1985–1987 (36); Peru, 1989–1991 (17); Peru, 1995–1998 (18); Brazil, 1989–1998 (23); Guinea-Bissau, 1987–1990 (37); Guinea-Bissau, 1996–1997 (38); and Bangladesh, 1993–1996 (39)). Mixed-effects models were used to calculate the estimates, and diarrhea prevalence in the first and second halves of the period, gender, and length-for-age z score at the beginning of the period were included in the model, with random effects for child. The size of the rectangle is proportional to the weight (1/SE2) of the study, and the 95% confidence interval is indicated by the width of the line. The width of the diamond indicates the 95% confidence interval for the pooled fixed estimate. SE, standard error.
Figure 7.
Figure 7.
Difference in weight (A) and length (B) associated with 1 day of diarrhea in lagged 30-day periods among 18-month-old children from a multisite data set (Peru, 1985–1987 (36); Peru, 1989–1991 (17); Peru, 1995–1998 (18); Brazil, 1989–1998 (23); Guinea-Bissau, 1987–1990 (37); Guinea-Bissau, 1996–1997 (38); and Bangladesh, 1993–1996 (39)). Estimates were generated using mixed-effects models with fixed effects for study, a natural cubic spline for age with 5 knots, gender, and diarrhea prevalence in lagged 30-day periods for each month of age. Random effects for child, grouped by study, were included in the model, as well as a first-order continuous autoregressive error function that accounted for correlation by age within-child. Point estimates and 95% confidence intervals (vertical lines) are shown.
Figure 8.
Figure 8.
Difference in weight (top row) and length (bottom row) associated with 1 day of diarrhea in lagged 1-month (parts A and D), 2-month (parts B and E), and 3-month (parts C and F) periods, by month of age, among children from a multisite data set (Peru, 1985–1987 (36); Peru, 1989–1991 (17); Peru, 1995–1998 (18); Brazil, 1989–1998 (23); Guinea-Bissau, 1987–1990 (37); Guinea-Bissau, 1996–1997 (38); and Bangladesh, 1993–1996 (39)). Estimates were generated using mixed-effects models with fixed effects for study, a natural cubic spline for age with 5 knots, gender, and diarrhea prevalence in lagged 30-day periods for each month of age. Random effects for child, grouped by study, were included in the model, as well as a first-order continuous autoregressive error function that accounted for correlation by age within-child. Point estimates and 95% confidence intervals (vertical lines) are shown.
Figure 9.
Figure 9.
Cumulative association between the average diarrhea burden each month during the first 24 months of life (equivalent to approximately 23 diarrhea days per year), half the average diarrhea burden, quadruple the average burden, no diarrhea during the first 6 months of life and then the average level, and an average diarrhea burden during the first 6 months and then no diarrhea among children from a multisite data set (Peru, 1985–1987 (36); Peru, 1989–1991 (17); Peru, 1995–1998 (18); Brazil, 1989–1998 (23); Guinea-Bissau, 1987–1990 (37); Guinea-Bissau, 1996–1997 (38); and Bangladesh, 1993–1996 (39)). Single-month estimates were generated using mixed-effects models with fixed effects for study, a natural cubic spline for age with 5 knots, gender, and diarrhea prevalence in lagged 30-day periods for each month of age. Random effects for child, grouped by study, were included in the model, as well as a first-order continuous autoregressive error function that accounted for correlation by age within-child. The cumulative effects were generated by calculating the linear combination of the effects of having had different levels of diarrhea in each preceding 30-day period. Point estimates and 95% confidence intervals (vertical lines) are shown.

References

    1. Keusch GT, Fontaine O, Bhargava A, et al. Disease Control Priorities in Developing Countries. 2nd ed. New York, NY: Oxford University Press; 2006. Diarrheal diseases; pp. 371–388.
    1. Martorell R, Habicht JP, Yarbrough C, et al. Acute morbidity and physical growth in rural Guatemalan children. Am J Dis Child. 1975;129(11):1296–1301. - PubMed
    1. Cole TJ, Parkin JM. Infection and its effect on the growth of young children: a comparison of The Gambia and Uganda. Trans R Soc Trop Med Hyg. 1977;71(3):196–198. - PubMed
    1. Guerrant RL, Kirchhoff LV, Shields DS, et al. Prospective study of diarrheal illnesses in northeastern Brazil: patterns of disease, nutritional impact, etiologies, and risk factors. J Infect Dis. 1983;148(6):986–997. - PubMed
    1. Black RE, Brown KH, Becker S. Effects of diarrhea associated with specific enteropathogens on the growth of children in rural Bangladesh. Pediatrics. 1984;73(6):799–805. - PubMed

Publication types