. 2013 Sep 15;216(Pt 18):3504-13.
doi: 10.1242/jeb.087635.

Auditory sensitivity of larval zebrafish (Danio rerio) measured using a behavioral prepulse inhibition assay

Affiliations

Auditory sensitivity of larval zebrafish (Danio rerio) measured using a behavioral prepulse inhibition assay

Ashwin A Bhandiwad et al. J Exp Biol. .

Abstract

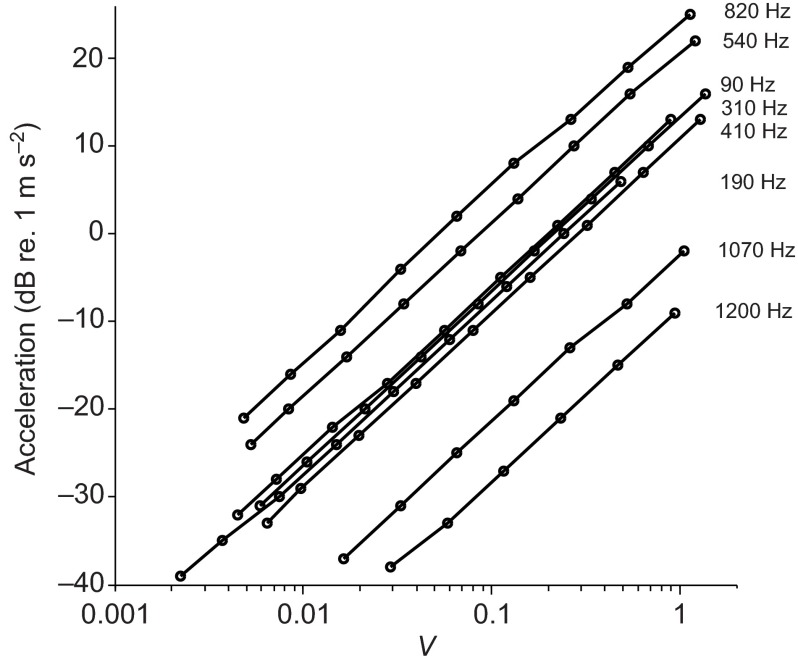
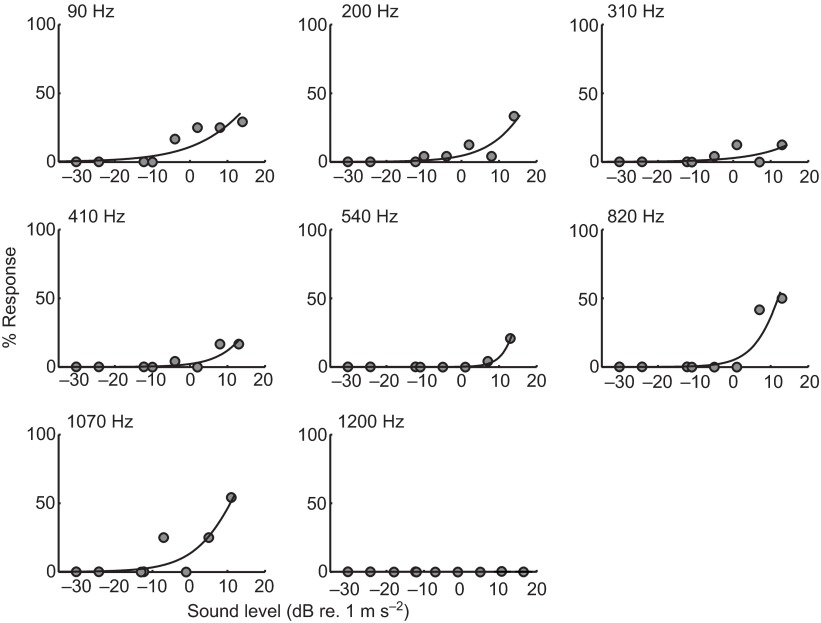
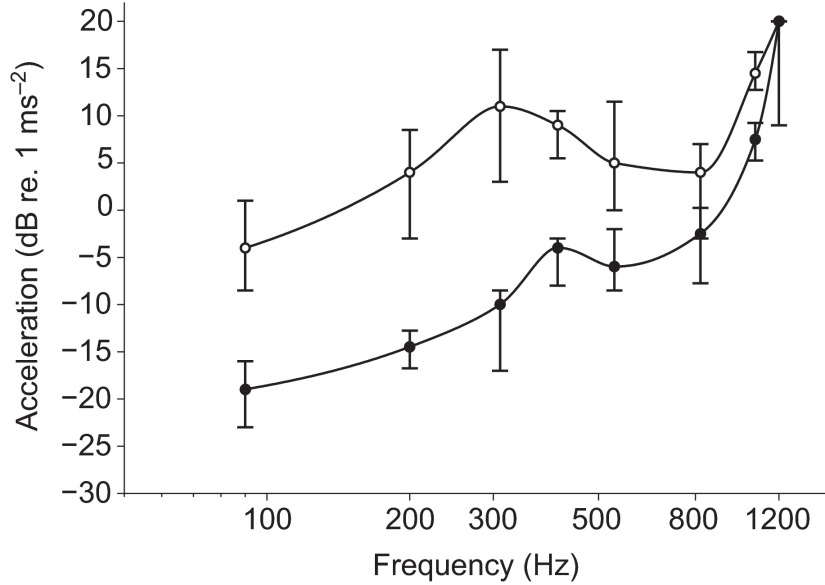
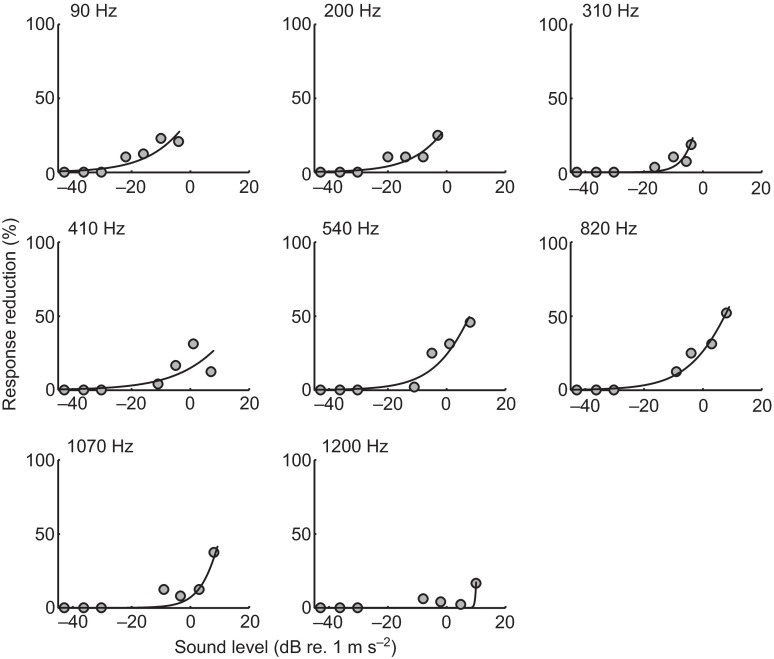
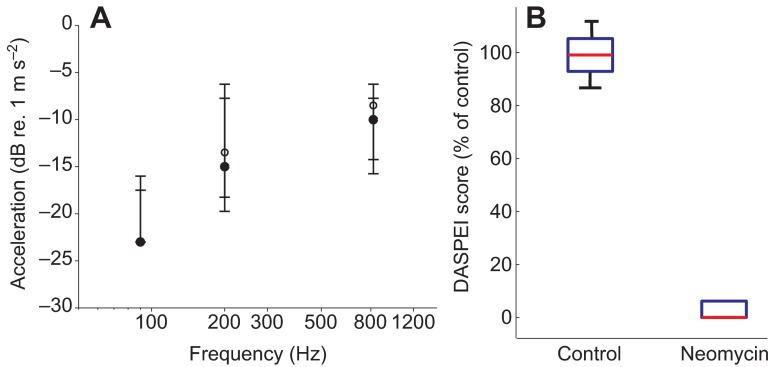
Zebrafish (Danio rerio) have become a valuable model for investigating the molecular genetics and development of the inner ear in vertebrates. In this study, we employed a prepulse inhibition (PPI) paradigm to assess hearing in larval wild-type (AB) zebrafish during early development at 5-6 days post-fertilization (d.p.f.). We measured the PPI of the acoustic startle response in zebrafish using a 1-dimensional shaker that simulated the particle motion component of sound along the fish's dorsoventral axis. The thresholds to startle-inducing stimuli were determined in 5-6 d.p.f. zebrafish, and their hearing sensitivity was then characterized using the thresholds of prepulse tone stimuli (90-1200 Hz) that inhibited the acoustic startle response to a reliable startle stimulus (820 Hz at 20 dB re. 1 m s(-2)). Hearing thresholds were defined as the minimum prepulse tone level required to significantly reduce the startle response probability compared with the baseline (no-prepulse) condition. Larval zebrafish showed greatest auditory sensitivity from 90 to 310 Hz with corresponding mean thresholds of -19 to -10 dB re. 1 m s(-2), respectively. Hearing thresholds of prepulse tones were considerably lower than previously predicted by startle response assays. The PPI assay was also used to investigate the relative contribution of the lateral line to the detection of acoustic stimuli. After aminoglycoside-induced neuromast hair-cell ablation, we found no difference in PPI thresholds between treated and control fish. We propose that this PPI assay can be used to screen for novel zebrafish hearing mutants and to investigate the ontogeny of hearing in zebrafish and other fishes.

Keywords: hearing; lateral line; sensorimotor; startle response.


Figures

Fig. 1.
Fig. 1.
Log-linear representation of the root mean square acceleration output of the shaker system (dB re. 1 m s −2) as a function of input voltage (V) by frequency with a 6×6 array of wells in a 96 well plate filled with 400 μl water. Each line indicates a separate frequency tested. Note that a doubling of the input voltage resulted in a doubling of the measured acceleration (6 dB increase).
Fig. 2.
Fig. 2.
Representative power spectrum of a subset (90, 410 and 1070 Hz) of sound stimuli used for pure-tone startle stimuli and prepulse stimuli measured at the highest level used (14 dB re. 1 m s−2). Data are normalized to a relative value of 0 dB assigned to the maximum sound level for the fundamental frequency tested. Insets, time course of pure-tone stimuli used for the startle response assay at 14 dB (re. 1 m s−2).
Fig. 3.
Fig. 3.
(A) Diagram of time course of the acoustic startle response of 5–6 d.p.f. zebrafish, digitized from a representative positive response fish. The response is characterized by a fast, coordinated contraction on one side of the body, forming a distinctive C-shape (frame 4). Successive frames are 4 ms apart. (B) Diagrammatic representation of the four points marked throughout startle characterization: two eyes (green), caudal edge of the swimbladder (blue) and caudal fin (red). Point tracking was used to measure head–tail Euclidean length and head–midpoint–tail angle throughout responses.
Fig. 4.
Fig. 4.
Diagram of the prepulse inhibition (PPI) protocol. Prepulse trials and no prepulse catch trials are interleaved, with an inter-trial interval of ~70 s for a total of 16 trials per group. Prepulse frequency and level are randomized between trials, but all trials contain the same catch stimulus. Inset, example of a prepulse trial. A 50 ms prepulse stimulus is separated from the 100 ms catch stimulus by an empirically determined 70 ms inter-stimulus interval.
Fig. 5.
Fig. 5.
Representative examples of curve-fitting the acoustic startle percentage response at a given frequency at the various stimulus levels tested for 5–6 d.p.f. zebrafish. For each frequency, observed response percentages are shown as filled circles. The Weibull curve is fitted using an MLE criterion and threshold is characterized as the sound level (dB re. 1 m s−2; x-axis) at which the model predicts a response probability of 5% (y-axis).
Fig. 6.
Fig. 6.
Example of the acoustic startle response characterization. (A) Euclidean length from head–tail throughout the response, relative to initial length. Time 0 denotes the onset of the stimulus. A positive startle response (red) shows a marked decrease in head–tail distance at the apex of the initial C-bend, followed by smaller refractory bends. The non-startle response (cyan) shows some decrease, but is smaller in magnitude than the startle. No response (black) is also shown. (B) Head–midpoint–tail angle throughout the response. Initial position is 180 deg. Length and angle measurements are highly correlated (r=0.83, N=18 responses).
Fig. 7.
Fig. 7.
Behavioral audiogram of the acoustic startle response of 5–6 d.p.f. zebrafish (N=10 plates of 24 fish) to particle motion stimuli (open circles) and audiogram of hearing sensitivity using the PPI assay (N=10 plates, filled circles) to sub-threshold particle motion stimuli. Thresholds were defined as a 5% probability of startle for the startle response assay or a 5% inhibition of startle from the paired catch trials in the PPI assay. Data are presented as median ± 1 quartile. Lower numbers indicate higher sensitivities. Note that all prepulse thresholds are significantly lower than startle response thresholds.
Fig. 8.
Fig. 8.
Example of curve-fitting to prepulse response data. Each point shown is the mean difference between the response percentage at that frequency and sound level (dB re. 1 m s−2; x-axis) and paired no-prepulse catch trials preceding and following the prepulse stimulus. Similar to the startle response data, a Weibull curve is fitted using an MLE criterion and threshold is characterized as the sound level at which the model predicts a response reduction of 5% (y-axis).
Fig. 9.
Fig. 9.
(A) PPI thresholds of 5–6 d.p.f. larval zebrafish (N=10 plates) treated with 400 μmol l−1 neomycin at 90, 210 and 820 Hz. There is no difference between neomycin-treated (open circles) and control (filled circles) fish. All data are presented as median ± 1 quartile. Note that at 90 Hz, medians for treated and control data overlap and lower quartile bars are slightly obscured. (B) Box plots of DASPEI scores for control and neomycin-treated fish, normalized to percentage relative to DASPEI scores for controls. The 400 μmol l−1 neomycin treatment had a high rate of superficial neuromast hair cell ablation. Note that the 95% confidence interval bars are obscured for the 400 μmol l−1 neomycin treatment.

References

    1. Bang P. I., Sewell W. F., Malicki J. J. (2000). Behavioral screen for dominant mutations affecting zebrafish auditory system. Assoc. Res. Otolaryngol. Abs. 23, 177-187
    1. Bang P. I., Sewell W. F., Malicki J. J. (2001). Morphology and cell type heterogeneities of the inner ear epithelia in adult and juvenile zebrafish (Danio rerio). J. Comp. Neurol. 438, 173-190 - PubMed
    1. Bang P. I., Yelick P. C., Malicki J. J., Sewell W. F. (2002). High-throughput behavioral screening method for detecting auditory response defects in zebrafish. J. Neurosci. Methods 118, 177-187 - PubMed
    1. Buck L. M. J., Winter M. J., Redfern W. S., Whitfield T. T. (2012). Ototoxin-induced cellular damage in neuromasts disrupts lateral line function in larval zebrafish. Hear. Res. 284, 67-81 - PubMed
    1. Burgess H. A., Granato M. (2007). Sensorimotor gating in larval zebrafish. J. Neurosci. 27, 4984-4994 - PMC - PubMed

Publication types