. 2013 Aug 21;33(34):13639-53.
doi: 10.1523/JNEUROSCI.1620-13.2013.

Involvement of the globus pallidus in behavioral goal determination and action specification

Affiliations

Involvement of the globus pallidus in behavioral goal determination and action specification

Nariko Arimura et al. J Neurosci. .

Abstract

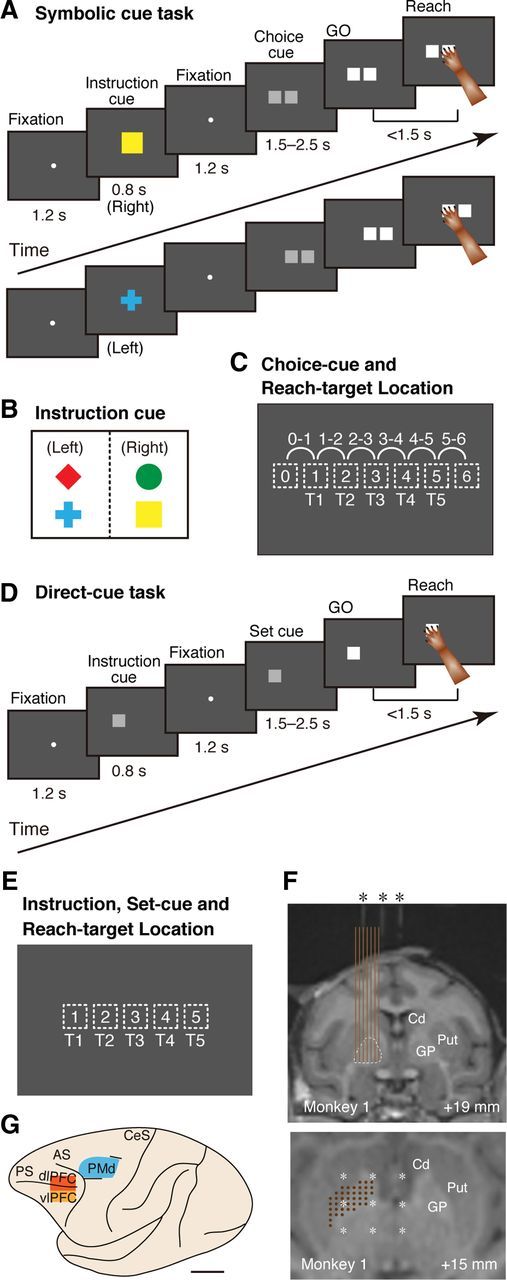
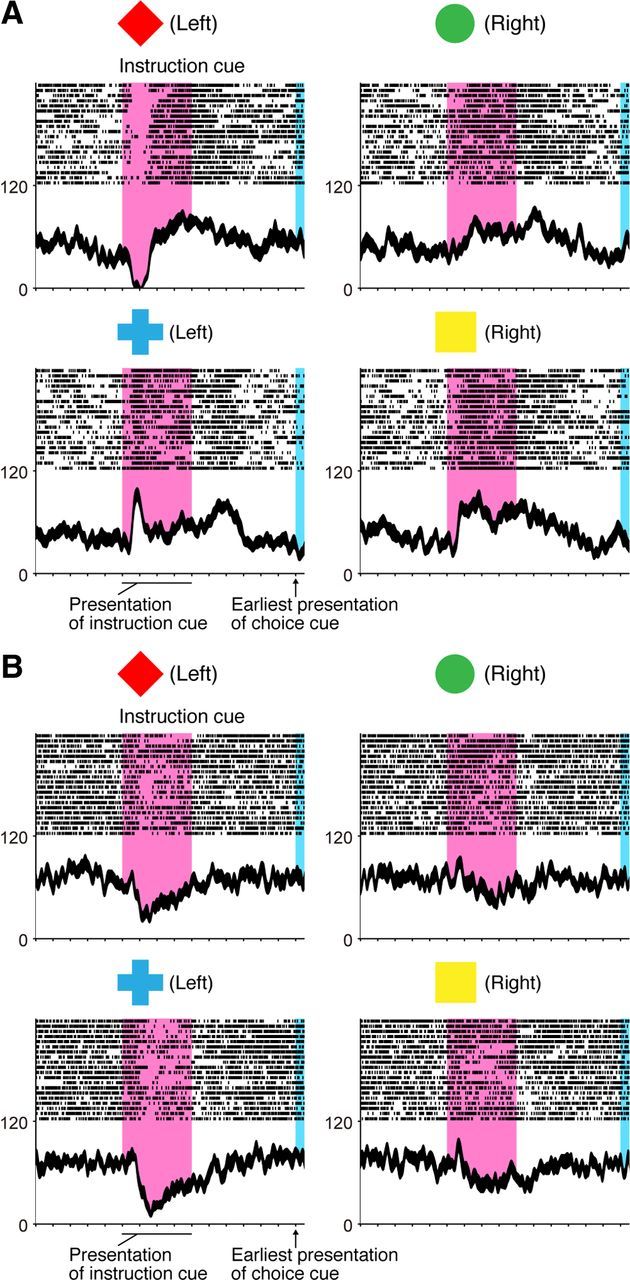
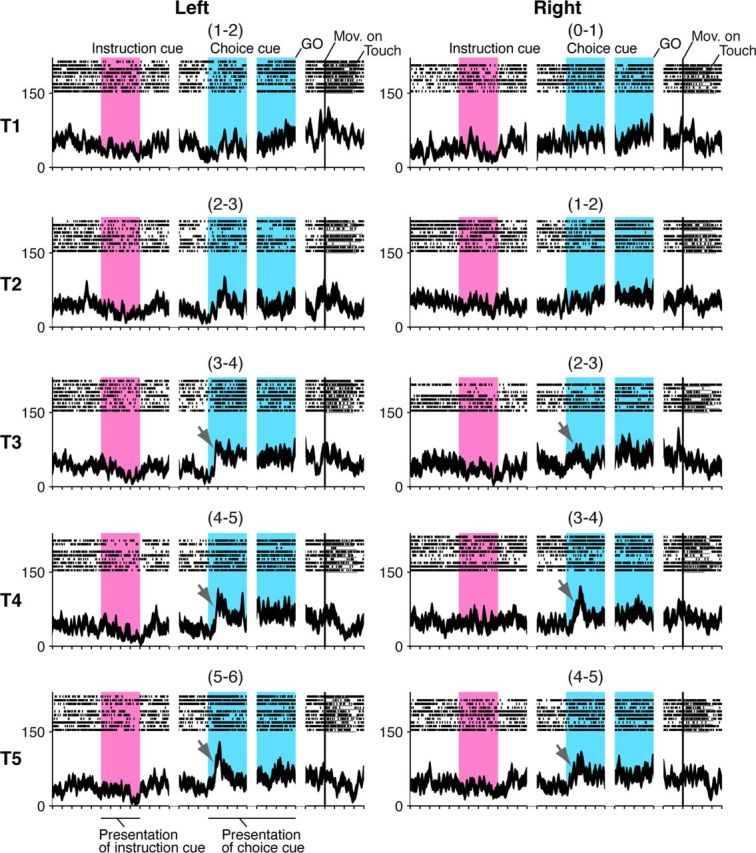
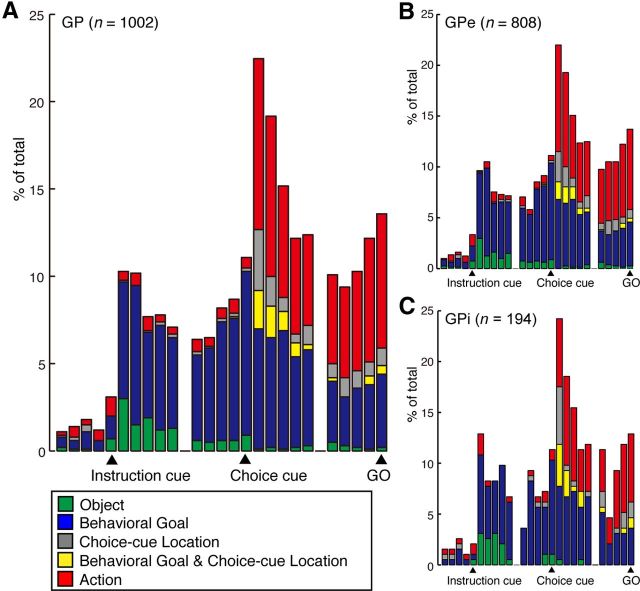
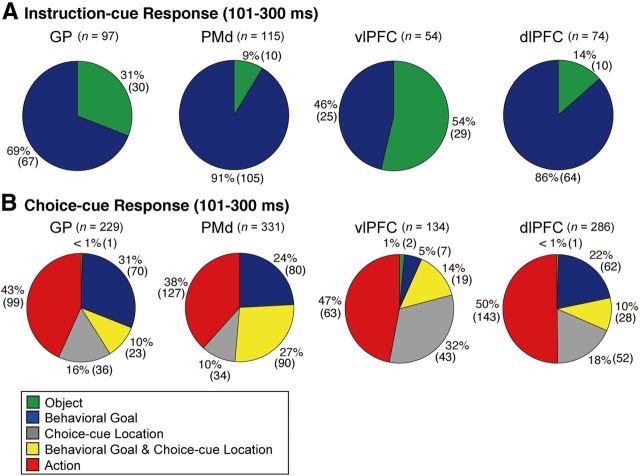
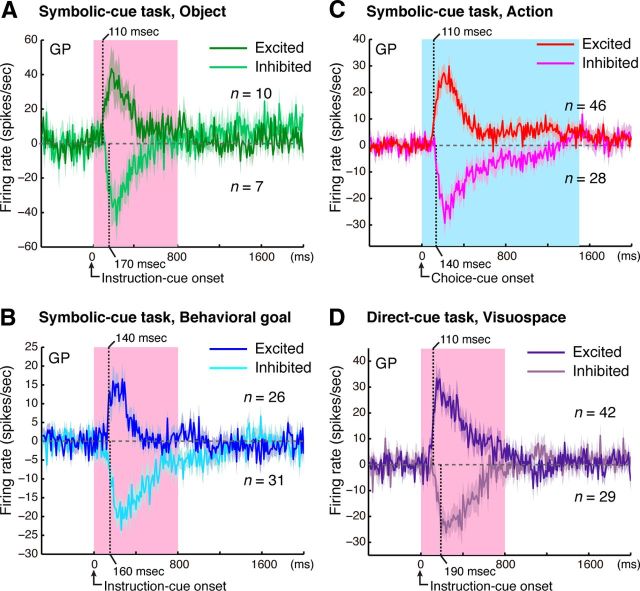
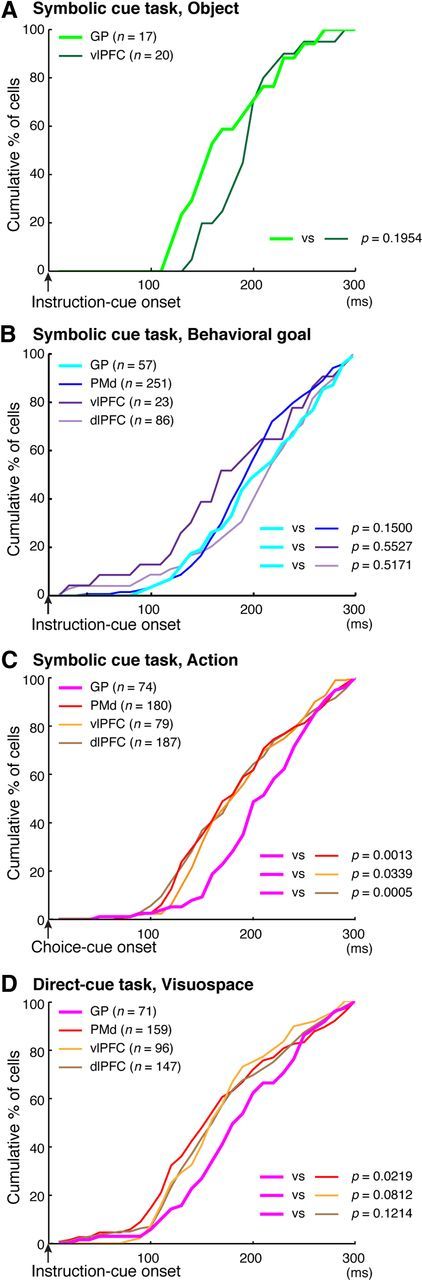
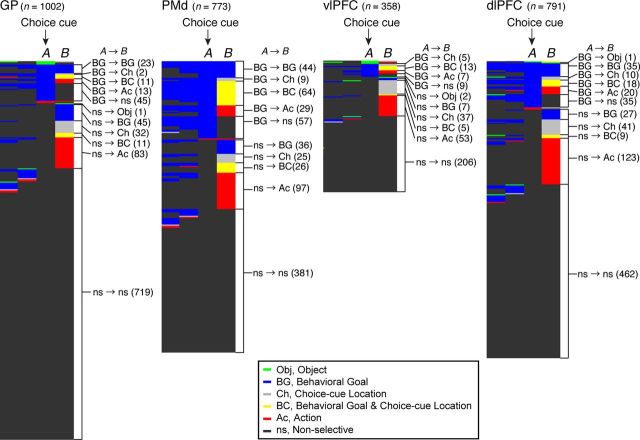
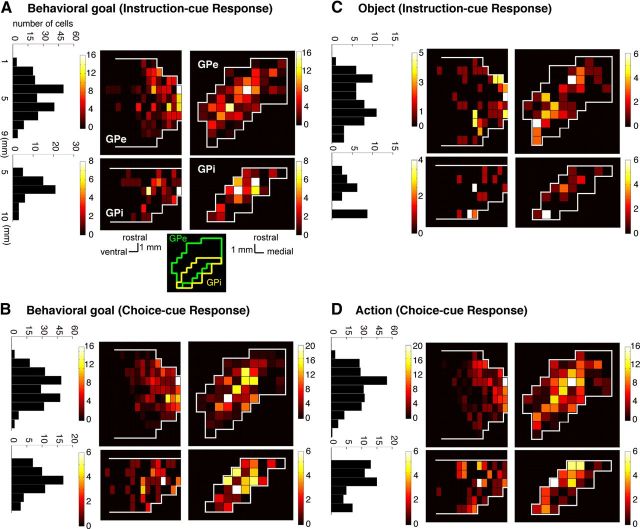
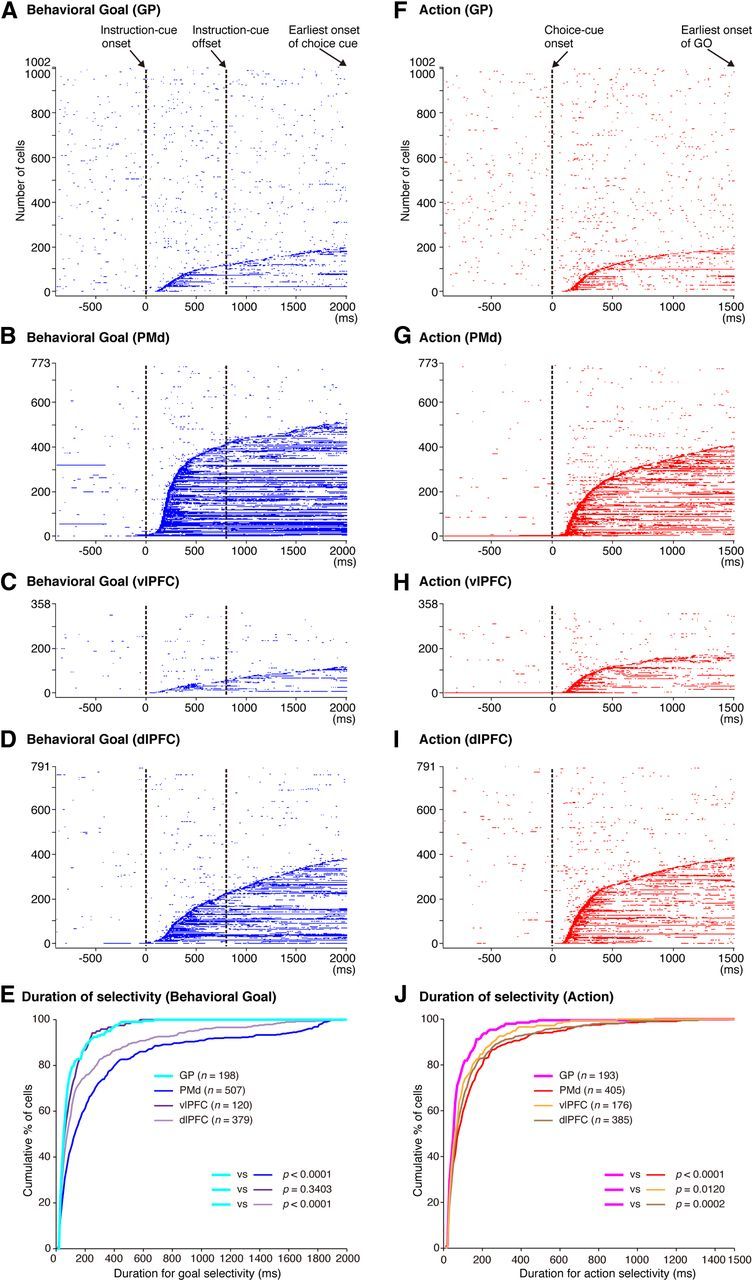
Multiple loop circuits interconnect the basal ganglia and the frontal cortex, and each part of the cortico-basal ganglia loops plays an essential role in neuronal computational processes underlying motor behavior. To gain deeper insight into specific functions played by each component of the loops, we compared response properties of neurons in the globus pallidus (GP) with those in the dorsal premotor cortex (PMd) and the ventrolateral and dorsolateral prefrontal cortex (vlPFC and dlPFC) while monkeys performed a behavioral task designed to include separate processes for behavioral goal determination and action selection. Initially, visual signals instructed an abstract behavioral goal, and seconds later, a choice cue to select an action was presented. When the instruction cue appeared, GP neurons started to reflect visual features as early as vlPFC neurons. Subsequently, GP neurons began to reflect goals informed by the visual signals no later than neurons in the PMd, vlPFC, and dlPFC, indicating that the GP is involved in the early determination of behavioral goals. In contrast, action specification occurred later in the GP than in the cortical areas, and the GP was not as involved in the process by which a behavioral goal was transformed into an action. Furthermore, the length of time representing behavioral goal and action was shorter in the GP than in the PMd and dlPFC, indicating that the GP may play an important role in detecting individual behavioral events. These observations elucidate the involvement of the GP in goal-directed behavior.


Figures

Figure 1.
Figure 1.
Behavioral tasks, instructions, cue locations, and recording sites. A, Temporal sequence of behavioral events in the symbolic-cue task. B, Visual signals used to designate the selection of left or right in the forthcoming choice cue. C, Choice-cue and reach-target locations on the screen. For the choice cue, two gray squares appeared at neighboring positions (locations 0–6, depicted with dotted squares). The target position was selected from five potential targets (T1–T5), which were either the left or right component of the choice cue. T3 was located at the center of the screen, aligned with the center of the monkey's body. D, Temporal sequence of behavioral events in the direct-cue task. E, Instruction, set-cue, and reach-target locations on the screen in the direct-cue task. The position was selected from five potential targets (T1–T5) as in the symbolic cue task (shown in C). F, Localization of recording sites with magnetic resonance images from Monkey 1. Monkeys were scanned with tubes containing contrast agent (asterisks) in place in the grid (at intervals of 5 mm). Top, Coronal plane. The recording sites (at intervals of 1 mm, brown vertical lines) were verified based on grid coordinates with holes every 1 mm and on electrode depth measurements. The GP is depicted with dotted lines. Bottom, Position of recording sites (brown dots) and tubes containing contrast agent (white asterisk) that projected onto a horizontal plane through the recording site. Numbers indicate the distance from the interaural line in the rostrocaudal (top) and dorsoventral axis (bottom). Cd, Caudate; Put, putamen. G, Cortical map of the recorded areas. Neurons from the PMd (blue), dlPFC (red), and vlPFC (orange) were analyzed. PS, Principal sulcus; AS, arcuate sulcus; CeS, central sulcus. Scale bar, 10 mm.
Figure 2.
Figure 2.
Representative neurons selective for a visual object (A) and behavioral goal (B) in the symbolic cue task. A, Activity of this GP neuron decreased when a red diamond was presented, whereas it increased when a blue cross was presented as an instruction cue. B, Activity of this GP neuron decreased when either a red diamond or a blue cross was presented. A, B, Neuronal activity was sorted according to the visual object identity. Rasters and spike density functions (smoothed using a Gaussian kernel; σ = 10 ms, mean ± SEM) indicate activity in sorted trials. The ordinate represents the instantaneous firing rate (in spikes/s). Neuronal activity was aligned with the onset of the instruction cue. The pink areas on the left indicate when the instruction was presented, and the blue areas on the right represent the earliest presentation period of the choice cue. The tick marks on the horizontal axis are placed at 200 ms intervals.
Figure 3.
Figure 3.
Neuronal activity reflecting action in the symbolic cue task. In this display, neuronal activity is sorted according to the location of the target on the screen (Fig. 1C, T1–T5 rows) as well as to the instructions signaling a left or right future target (left and right columns). This neuron exhibited progressively greater activity after choice-cue presentation as the reach target was placed in positions farther to the right (marked with arrows). Neuronal activity was aligned to the onset of the instruction, choice cue, GO signal, and movement. The pink areas on the left indicate when the instruction was presented, and the blue areas on the right represent the choice-cue presentation period. The location of the choice cue is shown in parentheses (Fig. 1C).
Figure 4.
Figure 4.
Temporal profiles of the number of selective GP neurons in the symbolic cue task. A, The histogram shows the time course of the appearance of neurons exhibiting each type of selectivity for the total GP neurons. B, C, Histograms show the same set of data as in A separately for the GPe (B) and GPi (C). The bin width is set to 200 ms. Each category is color-coded: the object (green), behavioral goal (blue), choice-cue location (gray), mixed selectivity for the behavioral goal and choice-cue location (yellow), and action (red). Bins are centered at the instruction-cue onset, choice-cue onset, and GO onset.
Figure 5.
Figure 5.
Distribution of selective neurons in the GP, PMd, vlPFC, and dlPFC. Pie charts summarize the proportion of neurons classified into five categories using an ANOVA. Two sets of data are shown during 101–300 ms after the onset of instruction (A) and during 101–300 ms after the onset of choice cue (B). Each category is color-coded, which is indicated in the inset. Green, object neurons; blue, goal neurons; gray, neurons selective for the choice-cue location; yellow, neurons selective for both goal and choice-cue location; red, action neurons.
Figure 6.
Figure 6.
Development of selective responses. Time courses of object selectivity (A), behavioral goal selectivity (B), action selectivity (C) in the symbolic cue task, and visuospatial selectivity in the direct-cue task (D). Bin-by-bin plots of the mean activity modification (±SEM) were calculated as the difference in activity for the preferred and nonpreferred cases. Analyses were performed for neurons exhibiting selective responses after presentation of the instruction cue (A, B, D) or choice cue (C). Dark green (A), blue (B), red (C), and purple (D) lines represent excited responses; and light green (A), light blue (B), pink (C), and light purple (D) lines represent inhibited responses. A, B, D, Pink areas indicate when the instruction cues were presented. C, Blue areas indicate the minimum period of choice-cue presentation. Translucent ribbons around the solid line indicate ±SEM. Each vertical dotted line represents the onset latency: a point at which the selectivity exceeds the mean ± 4 SD of the baseline period (500 ms period preceding the cue onset).
Figure 7.
Figure 7.
Comparison of activity-selective development for the visual objects, behavioral goals, and actions. A, Cumulative fractions of selectivity onset for visual objects after the instruction cue onset in the GP (light green) and vlPFC (dark green) in the symbolic cue task. B, Cumulative fractions of selectivity onset for the behavioral goal after instruction-cue presentation in the GP (light blue), PMd (dark blue), vlPFC (dark purple), and dlPFC (light purple) in the symbolic cue task. C, Cumulative fractions of action-selectivity onset after the choice-cue onset in the GP (pink), PMd (red), vlPFC (orange), and dlPFC (brown) in the symbolic cue task. D, Cumulative fractions of selectivity onset for cue visuospatial position in the direct-cue task after the instruction-cue onset in the GP (pink), PMd (red), vlPFC (orange), and dlPFC (brown). AD, p values indicate the results of the statistical analysis (Kolmogorov–Smirnov test) between the GP and the other three areas.
Figure 8.
Figure 8.
Time-dependent selectivity of each neuron for each behavioral factor. For each 200 ms time bin in the task period, individual neuron properties were classified into one of six categories based on their specific selectivity for each of the behavioral factors. Activity profiles of individual neurons are displayed consecutively. Each row represents data from a single neuron. Data from the GP, PMd, vlPFC, and dlPFC are displayed separately. In each panel, neurons were sorted according to selectivity at the choice-cue onset (A). To the right of each panel, we compared the selectivity of each neuron in two distinct bins (at A and B). Different colors indicate the selectivity for the object (Obj, green), behavioral goal (BG, blue), choice-cue location (Ch, gray), combined behavioral goal and choice-cue location (BC, yellow), action (Ac, red), and the nonselective neuron (ns, black). The numbers in parentheses indicate the number of neurons in each group.
Figure 9.
Figure 9.
Density distributions of cue-responsive neurons in the GP in the symbolic cue task. Horizontal (right) and sagittal (middle) section maps of the GPe (top) and GPi (bottom) and show the distribution of neurons selective for the behavioral goal (A, B), the visual object (C), and the action (D). The distribution is expressed as the number of neurons with significant selectivity during 101–300, 301–500, 501–700, or 701–900 ms after the cue onset (Fig. 4). The fraction was calculated after each neuron projected into the horizontal (right) and sagittal (middle) planes. Data from two animals are overlaid with reference to the central portion of each GPe and GPi. The color scale indicates the fraction of selective neurons (among all task-related neurons within each miniature portion). Left, Histogram adds the total number of selective neurons within each 1-mm-thick GP slice vertical to the rostrocaudal axis. A, bottom right, Line drawings inset indicates approximate spatial locations of GPe (green) and GPi (yellow) along the mediolateral and rostrocaudal axis.
Figure 10.
Figure 10.
Temporal profiles of neuronal selectivity for behavioral goals and actions in the symbolic cue task. A–D, Time of appearance of goal selectivity in individual neurons in the GP (A), PMd (B), vlPFC (C), and dlPFC (D), plotted along the behavioral task period. The blue dots indicate the time points at which each neuron was selective for the goals. Each row represents a neuron. Neurons were sorted according to the onset of goal selectivity after the instruction-cue onset, from bottom to top. E, Cumulative fractions of the duration of goal selectivity after the instruction cue onset in the GP (light blue), PMd (dark blue), vlPFC (dark purple), and dlPFC (light purple) in the symbolic cue task. F–I, Time of appearance of action selectivity in the GP (F), PMd (G), vlPFC (H), and dlPFC (I). The red dots indicate the time points at which each neuron was selective for the actions. Each row represents a neuron. Neurons were sorted according to the onset of action selectivity after the choice-cue onset, from bottom to top. J, Cumulative fractions of the duration of action selectivity after the choice cue presentation in the GP (pink), PMd (red), vlPFC (orange), and dlPFC (brown) in the symbolic cue task. E, J, The parentheses enclose the number of neurons with the onset of selectivity ≤2000 ms after the instruction-cue onset (for goal selectivity, E) and ≤1500 ms after the choice-cue onset (for action selectivity, J). The p values indicate the results of the statistical analysis conducted with these neurons (Kolmogorov–Smirnov test) examining differences between the GP and the three cortical areas.

References

    1. Alexander GE, Crutcher MD. Functional architecture of basal ganglia circuits: neural substrates of parallel processing. Trends Neurosci. 1990;13:266–271. doi: 10.1016/0166-2236(90)90107-L. - DOI - PubMed
    1. Alexander GE, DeLong MR, Strick PL. Parallel organization of functionally segregated circuits linking basal ganglia and cortex. Annu Rev Neurosci. 1986;9:357–381. doi: 10.1146/annurev.ne.09.030186.002041. - DOI - PubMed
    1. Amiez C, Kostopoulos P, Champod AS, Petrides M. Local morphology predicts functional organization of the dorsal premotor region in the human brain. J Neurosci. 2006;26:2724–2731. doi: 10.1523/JNEUROSCI.4739-05.2006. - DOI - PMC - PubMed
    1. Antzoulatos EG, Miller EK. Differences between neural activity in prefrontal cortex and striatum during learning of novel abstract categories. Neuron. 2011;71:243–249. doi: 10.1016/j.neuron.2011.05.040. - DOI - PMC - PubMed
    1. Asaad WF, Rainer G, Miller EK. Neural activity in the primate prefrontal cortex during associative learning. Neuron. 1998;21:1399–1407. doi: 10.1016/S0896-6273(00)80658-3. - DOI - PubMed

Publication types

LinkOut - more resources