. 2013 Aug 21;33(34):13791-804.
doi: 10.1523/JNEUROSCI.2366-13.2013.

MHCI requires MEF2 transcription factors to negatively regulate synapse density during development and in disease

Affiliations

MHCI requires MEF2 transcription factors to negatively regulate synapse density during development and in disease

Bradford M Elmer et al. J Neurosci. .

Abstract

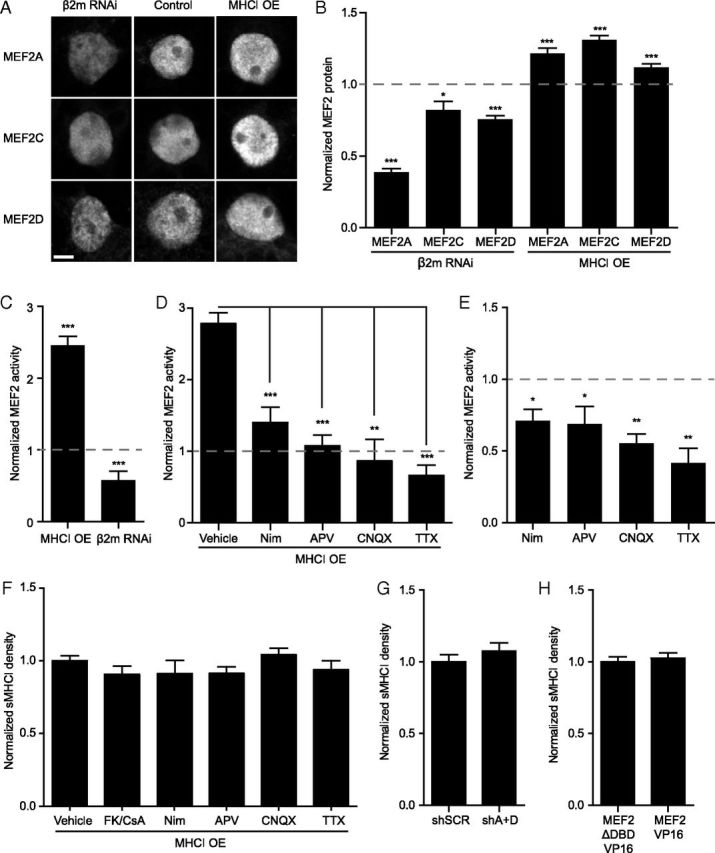
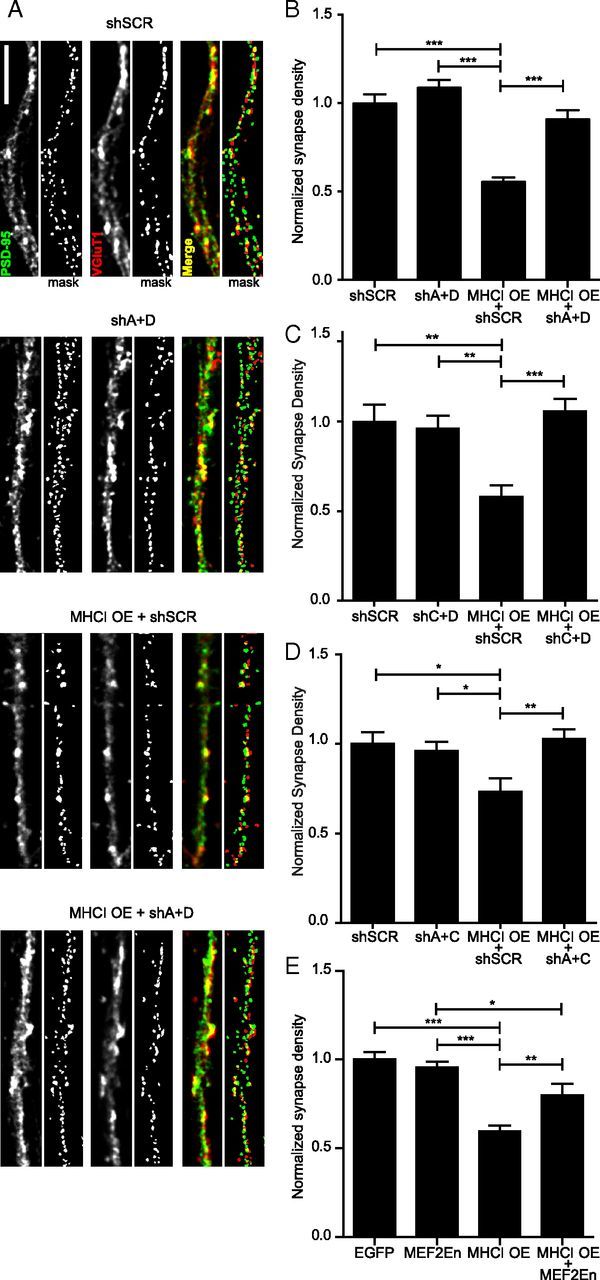
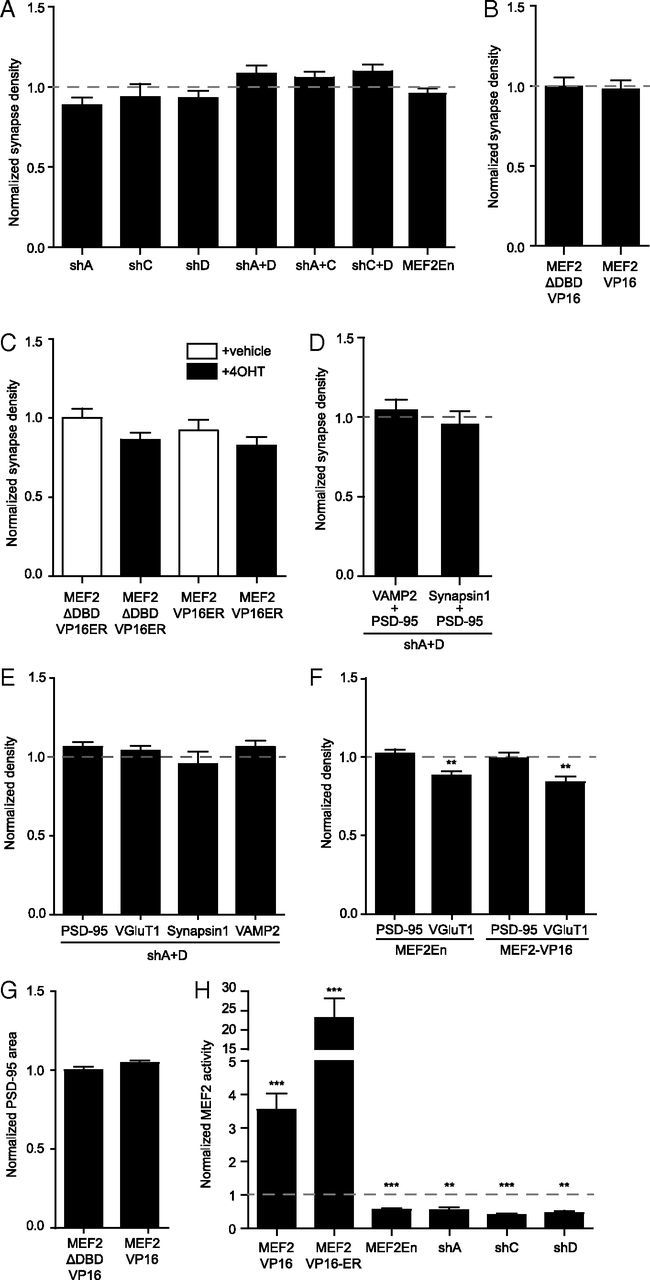
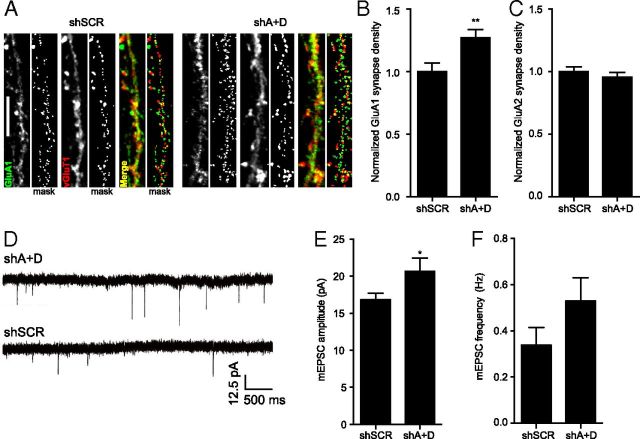
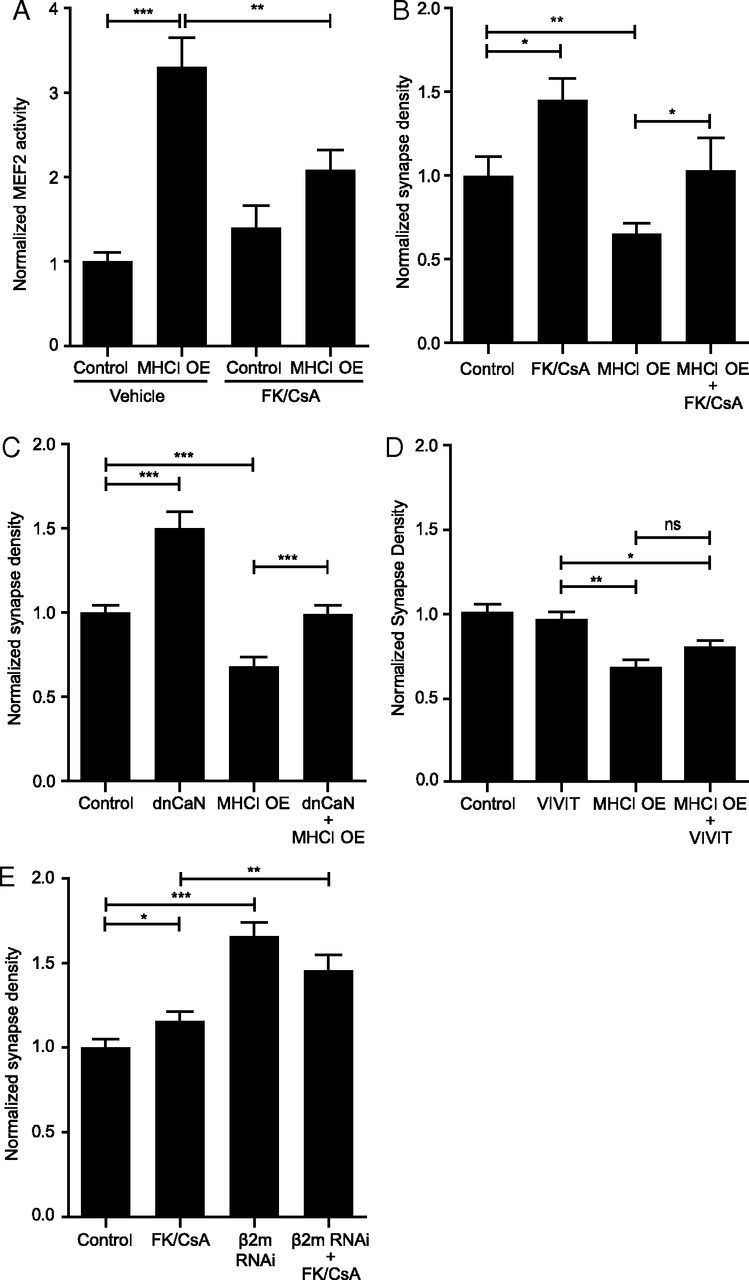
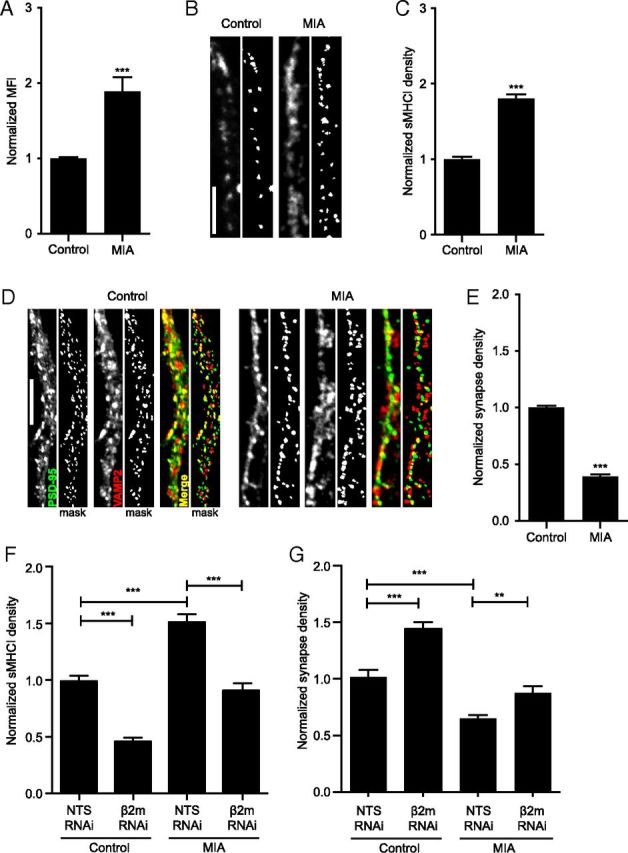
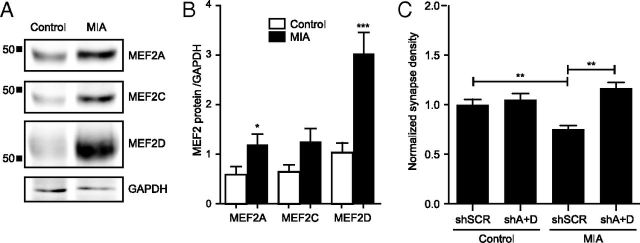
Major histocompatibility complex class I (MHCI) molecules negatively regulate cortical connections and are implicated in neurodevelopmental disorders, including autism spectrum disorders and schizophrenia. However, the mechanisms that mediate these effects are unknown. Here, we report a novel MHCI signaling pathway that requires the myocyte enhancer factor 2 (MEF2) transcription factors. In young rat cortical neurons, MHCI regulates MEF2 in an activity-dependent manner and requires calcineurin-mediated activation of MEF2 to limit synapse density. Manipulating MEF2 alone alters synaptic strength and GluA1 content, but not synapse density, implicating activity-dependent MEF2 activation as critical for MHCI signaling. The MHCI-MEF2 pathway identified here also mediates the effects of a mouse model of maternal immune activation (MIA) on connectivity in offspring. MHCI and MEF2 levels are higher, and synapse density is lower, on neurons from MIA offspring. Most important, dysregulation of MHCI and MEF2 is required for the MIA-induced reduction in neural connectivity. These results identify a previously unknown MHCI-calcineurin-MEF2 signaling pathway that regulates the establishment of cortical connections and mediates synaptic defects caused by MIA, a risk factor for autism spectrum disorders and schizophrenia.


Figures

Figure 1.
Figure 1.
MHCI regulates the levels and activity of MEF2. A, Representative confocal micrographs of MEF2 proteins. Neurons were transfected with H2-Kb-YFP (MHCI OE) or siRNAs for β2m to knockdown sMHCI for 48–72 h (Glynn et al., 2011). Scale bar, 5 μm. B, MHCI regulates MEF2 protein levels. MHCI OE increased levels of nuclear MEF2A, -C, and -D, while decreasing sMHCI (using β2m RNAi) lowered MEF2. MEF2 protein was quantified and plotted normalized relative to the appropriate control group indicated by the dashed line at 1.0 (EGFP for MHCI OE and NTS siRNA for β2m RNAi; n ≥ 25 cells per condition, ≥2 experiments). C, MHCI also regulates MEF2 transcriptional activity. MEF2 activity was quantified after transfecting 7 DIV neurons with H2-Kb-mCherry or β2m siRNAs with the MEF2 transcriptional reporter 3xMRE-EGFP for 36–48 h. EGFP fluorescence intensity was measured and plotted normalized to the appropriate control group indicated by the dashed line at 1.0 (pmCherry for MHCI OE or NTS RNAi + pmCherry for sMHCI KD; n ≥ 31 cells per condition, ≥ 2 experiments). D, The MHCI-induced increase in MEF2 activation is activity-dependent. MEF2 activity following MHCI OE was analyzed as in C), with the indicated pharmacologic manipulations. Drugs or vehicle control were added post-transfection and MEF2 activity was quantified 36–48 h later and normalized to treated controls; n ≥ 21 cells per condition, ≥2 experiments. E, MEF2 is activated by synaptic activity and Ca2+ influx through L-VSCCs. Neurons were transfected with pmCherry and 3XMRE-EGFP at 6 DIV, and cells were fixed and analyzed at 8 DIV. Drugs were added as in D, and MEF2 activity was quantified 36–48 h later; n ≥ 8 cells, ≥2 experiments. F, sMHCI overexpression is not dependent on synaptic activity or Ca2+ influx through L-VSCCs or CaN activation. Neurons were transfected with H2-Kb-YFP at 6 DIV. Inhibitors of CaN (FK506/CsA), L-VSCCs (Nim), NMDARs (APV), AMPARs (CNQX), and Na-dependent action potentials (TTX) were added 1 h post-transfection as in D and sMHCI on transfected cells was quantified 48 h later; n ≥ 8 cells, two experiments. G, MEF2 knockdown does not alter sMHCI density. sMHCI density was quantified 48 h after transfection of MEF2A+MEF2D shRNAs (shA+D) or a scrambled shRNA control (shSCR); n ≥ 22 cells per condition, ≥2 experiments. H, MEF2 activation also does not alter sMHCI density. MEF2-VP16 was expressed for 48 h and sMHCI was measured relative to cells expressing a mutant form of MEF2-VP16 unable to bind to DNA, MEF2-ΔDBD-VP16. *p < 0.05, **p < 0.01, ***p < 0.001.
Figure 2.
Figure 2.
MHCI requires MEF2 to limit synapse density. A, Representative images of dendrites from 8 DIV cortical neurons transfected with the indicated constructs for 48 h. Excitatory glutamatergic synapses were quantified as the density of postsynaptic PSD-95 puncta (green) colocalized (yellow) with presynaptic VGluT1 puncta (red). Scale bar, 5 μm. Each representative image shown includes an adjacent “mask” panel displaying the regions obtained following thresholding that were used for quantification. The intensity of the images shown was increased for publication to enable visualization of the faint puncta, in addition to the bright ones, because both are detected by our image analysis, as shown in the mask panels. The brighter puncta are saturated in those images by this increase in intensity. B, MEF2A+MEF2D knockdown alone does not alter synapse density, but completely prevents the MHCI-mediated decrease in synapse density. Expression of shRNAs against MEF2A and D (shA+D) together with MHCI OE rescued the decrease in synapse density observed in neurons expressing a scrambled shRNA (shSCR) with MHCI OE. Results are normalized to shSCR control; n ≥ 61 dendrites, 21 cells per condition; four experiments. C, MEF2C+MEF2D knockdown and MEF2A+MEF2C knockdown (D) had similar effects as MEF2A+MEF2D knockdown shown in B. E, Similarly, expression of MEF2-En, a dominant negative form of MEF2, does not alter synapse density alone, but partially rescues the MHCI-mediated decrease in synapse density; n ≥ 51 dendrites (17 cells) per condition, two experiments. *p < 0.05, **p < 0.01, ***p < 0.001.
Figure 3.
Figure 3.
MEF2 does not alter synapse density or the density of synaptic proteins. A, Decreasing MEF2 activity does not change synapse density. No combination of shRNAs targeting MEF2 isoforms changes synapse density; n ≥ 63 dendrites (21 cells) per condition, two experiments. Values are normalized to shSCR control. Similarly, MEF2-En does not change synapse density from control (EGFP) levels. Cells were transfected at 6 DIV and fixed at 8 DIV. Normalized, control levels are indicated by the dashed gray line (shSCR for RNAi and EGFP for MEF2En); n ≥ 152 dendrites (51 cells) per condition, four experiments. B, Expression of MEF2-VP16 also does not alter synapse density. Cells were transfected at 6 DIV and fixed at 8 DIV; n ≥ 71 dendrites (23 cells) per condition, four experiments. C, A tamoxifen inducible form of MEF2-VP16 (MEF2-VP16-ER) does not alter synapse density. Cells were transfected with the indicated forms of MEF2 at 5 DIV. 4OHT or vehicle control (ethanol to 0.1%) was added 24 h later and cells were fixed at 8 DIV; n ≥ 21 dendrites (7 cells), two experiments. D, MEF2A+D knockdown in young cortical neurons does not alter synapse density defined by the colocalization of PSD-95 and VAMP2 (data are the same as the control shown in Fig. 7C) or by the colocalization of PSD-95 and synapsin1. Neurons were transfected at 6 DIV and fixed at 8 DIV. Normalized control (shSCR) levels are indicated by the dashed gray line; n ≥ 21 dendrites (7 cells), one experiment. E, MEF2A+MEF2D knockdown does not alter the density of PSD-95, VGluT1, synapsin1 or VAMP2. Densities of the indicated proteins were quantified from experiments shown in D, Figure 3A, and 7C. Normalized control (shSCR) levels are indicated by the dashed gray line. F, Changing MEF2 activity by dominant negative MEF2En or constitutively active MEF2-VP16 does not alter PSD95 density, but slightly decreases VGluT1. Cells were transfected at 6 DIV and fixed at 8 DIV. Normalized control (EGFP for MEF2En or MEF2-DBD-VP16 for MEF2-VP16) levels are indicated by the dashed gray line. MEF2En; n ≥ 131 dendrites (43 cells), four experiments. MEF2-VP16; n ≥ 71 dendrites (23 cells), four experiments. G, MEF2VP16 expression does not alter PSD-95 cluster area as compared with control. Cells were transfected at 6 DIV, and fixed at 8 DIV; n ≥ 71 dendrites (23 cells), four experiments. H, MEF2 shRNAs, MEF2En, and MEF2-VP16 all alter MEF2 activity as expected. shRNAs targeting MEF2A, C, or D and MEF2En decrease MEF2 activity. MEF2-VP16 increases MEF2 activity ∼3.5-fold, and a 4OH-tamoxifen inducible form of MEF2, MEF2-VP16-ER, increases MEF2 activity ∼23-fold relative to mutant versions that cannot bind DNA (MEF2-DBD-VP16 or MEF2-DBD-VP16-ER) or to MEF2-VP16-ER without 4OHT. Respective, normalized control levels are indicated by the dashed gray line; n ≥ 8 cells per condition. *p < 0.05, **p < 0.01, ***p < 0.001.
Figure 4.
Figure 4.
MEF2 limits synaptic strength and synaptic GluA1 content. A, Representative images of synapse density defined by colocalized GluA1 and VGluT1 in 8 DIV neurons transfected with shSCR or shA+D at 6 DIV. B, MEF2 A+D knockdown increases the density of GluA1-containing synapses compared with shSCR-expressing cells; n ≥ 44 dendrites (15 cells) per condition, two experiments. C, GluA2 synapse density was unchanged following MEF2A+D knockdown; n ≥ 38 dendrites (13 cells) per condition, two experiments. D, Representative traces of mEPSCs from cells expressing shSCR or shMEF2A+D shRNAs. E, F, MEF2 A+D knockdown significantly increases mEPSC amplitude (E), but not frequency (F); n ≥ 16 cells per condition, five experiments. *p < 0.05, **p < 0.01.
Figure 5.
Figure 5.
MHCI requires CaN to activate MEF2 and limit synapse density. A, Treatment of neurons with the CaN inhibitors FK506/CsA (FK/CsA) blocks the MHCI-induced increase in MEF2 activity; n ≥ 42 cells per condition, four experiments. B, FK/CsA rescues the MHCI-mediated decrease in synapse density; n ≥ 12 dendrites per condition (4 cells), one experiment. C, Similarly, coexpression of a dominant-negative form of CaN (dnCaN, CaN-H151A-YFP) also rescues the MHCI-mediated decrease in synapse density; n ≥ 51 dendrites (17 cells) per condition, two experiments. D, CaN binding to NFAT does not alter synapse density, nor is it required for the MHCI-induced decrease in synapse density. Neurons were transfected with the indicated constructs at 6 DIV, and synapse density was quantified 48 h later. E, Inhibiting CaN activity does not increase synapse density above that seen by sMHCI KD alone. β2m siRNAs were transfected at 5 DIV with or without FK/CsA, and synapse density was analyzed at 8 DIV; n ≥ 57 dendrites (19 cells) per condition, three experiments. *p < 0.05, **p < 0.01, ***p < 0.001; ns, not significant.
Figure 6.
Figure 6.
Maternal immune activation increases sMHCI and decreases glutamatergic synapse density on cortical neurons from newborn offspring. A, Surface MHCI (H2-Kb/H2-Db) is almost doubled on acutely dissociated neurons from P0 FC from newborn offspring of poly(I:C)-injected (MIA) mothers compared to those from saline-injected (control) offspring, as assessed using flow cytometry; n ≥ 5 experiments. B, Representative images of dendritic sMHCI on 8 DIV mouse cortical neurons cultured from FC of MIA or control offspring. Scale bar, 5 μm. C, The density of sMHCI puncta is almost doubled in neurons from MIA offspring; n ≥ 89 cells per condition, ≥7 experiments. D, Representative images of synapses on dendrites from cultured MIA and control neurons immunostained for excitatory synapse density using antibodies against PSD-95 (green) and VAMP2 (red). Scale bar, 5 μm. E, Excitatory synapse density is decreased over twofold on neurons cultured from MIA offspring compared with control offspring; n ≥ 88 cells (264 dendrites) per condition, six experiments. F, The increase in sMHCI on MIA neurons returns to control levels following β2m RNAi. MIA or saline neurons were transfected with EGFP + β2m or NTS shRNAs for 48 h before quantification of sMHCI; n ≥ 24 dendrites (8 cells) per condition, three experiments. G, The MIA-induced decrease in synapse density is rescued by preventing the MIA-induced increase in sMHCI. Synapse density is graphed normalized to control (saline neurons transfected with NTS RNAi); n ≥ 21 dendrites (7 cells), two experiments. *p < 0.05, **p < 0.01, ***p < 0.001.
Figure 7.
Figure 7.
MEF2 mediates the MIA-induced reduction in synapse density. A, Representative Western blots showing increased MEF2 protein from 8 DIV cultured neurons from MIA or saline control offspring. B, Densitometry shows increased levels of MEF2A, -C, and –D protein relative to GAPDH loading controls. Data were averaged from four different cultures of each group. C, Preventing the MIA-induced increase in MEF2 rescues the MIA-induced reduction in synapse density. MIA or saline control neurons were transfected with shSCR or MEF2A+D shRNAs from 6 to 8 DIV. Synapse density was quantified as in Figure 5; n ≥ 65 dendrites (22 cells) per condition, three experiments. *p < 0.05, **p < 0.01, ***p < 0.001.

References

    1. Adelson JD, Barreto GE, Xu L, Kim T, Brott BK, Ouyang YB, Naserke T, Djurisic M, Xiong X, Shatz CJ, Giffard RG. Neuroprotection from stroke in the absence of MHCI or PirB. Neuron. 2012;73:1100–1107. doi: 10.1016/j.neuron.2012.01.020. - DOI - PMC - PubMed
    1. Akhtar MW, Kim MS, Adachi M, Morris MJ, Qi X, Richardson JA, Bassel-Duby R, Olson EN, Kavalali ET, Monteggia LM. In vivo analysis of MEF2 transcription factors in synapse regulation and neuronal survival. PLoS One. 2012;7:e34863. doi: 10.1371/journal.pone.0034863. - DOI - PMC - PubMed
    1. Andreassen OA, Thompson WK, Schork AJ, Ripke S, Mattingsdal M, Kelsoe JR, Kendler KS, O'Donovan MC, Rujescu D, Werge T, Sklar P, Roddey JC, Chen CH, McEvoy L, Desikan RS, Djurovic S, Dale AM. Improved detection of common variants associated with schizophrenia and bipolar disorder using pleiotropy-informed conditional false discovery rate. PLoS Genet. 2013;9:e1003455. doi: 10.1371/journal.pgen.1003455. - DOI - PMC - PubMed
    1. Aramburu J, Yaffe MB, López-Rodriguez C, Cantley LC, Hogan PG, Rao A. Affinity-driven peptide selection of an NFAT inhibitor more selective than cyclosporin A. Science. 1999;285:2129–2133. doi: 10.1126/science.285.5436.2129. - DOI - PubMed
    1. Arnold MA, Kim Y, Czubryt MP, Phan D, McAnally J, Qi X, Shelton JM, Richardson JA, Bassel-Duby R, Olson EN. MEF2C transcription factor controls chondrocyte hypertrophy and bone development. Dev Cell. 2007;12:377–389. doi: 10.1016/j.devcel.2007.02.004. - DOI - PubMed

Publication types

MeSH terms

LinkOut - more resources