. 2013 Aug 21;33(34):13903-13.
doi: 10.1523/JNEUROSCI.0037-13.2013.

Reliable sex and strain discrimination in the mouse vomeronasal organ and accessory olfactory bulb

Affiliations

Reliable sex and strain discrimination in the mouse vomeronasal organ and accessory olfactory bulb

Illya I Tolokh et al. J Neurosci. .

Abstract

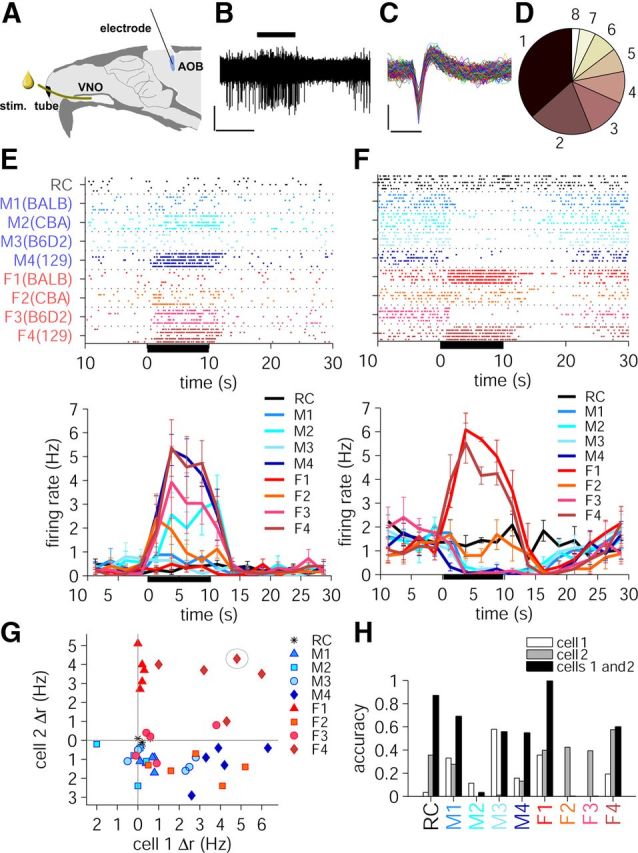
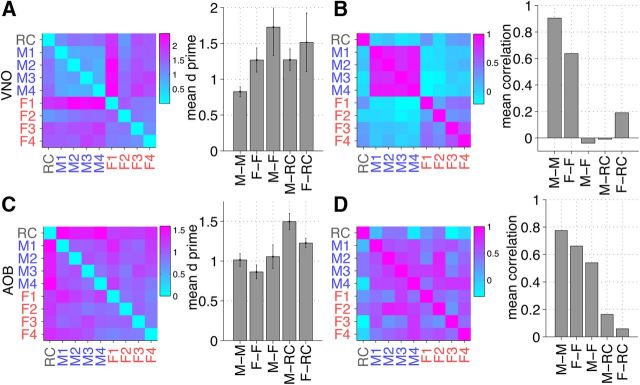
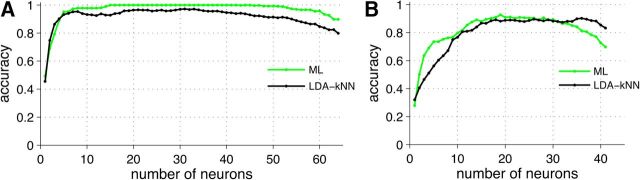
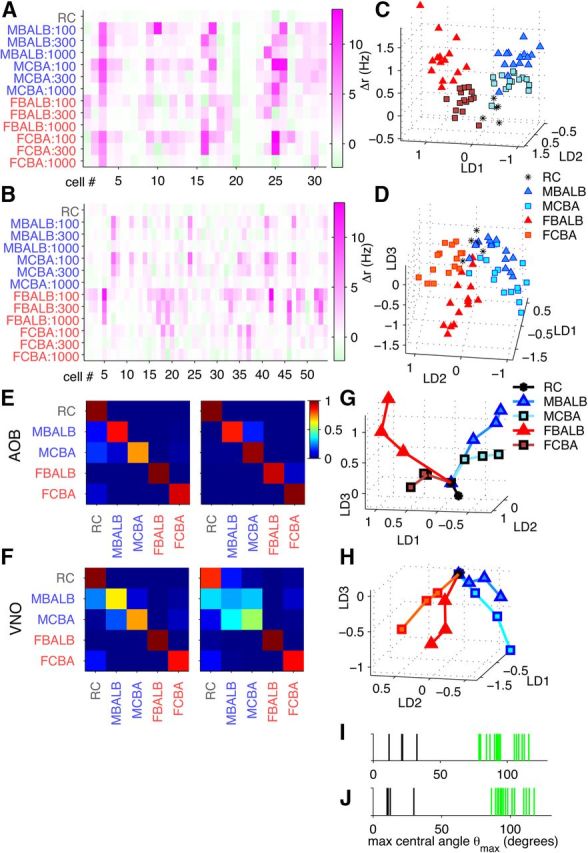
Animals modulate their courtship and territorial behaviors in response to olfactory cues produced by other animals. In rodents, detecting these cues is the primary role of the accessory olfactory system (AOS). We sought to systematically investigate the natural stimulus coding logic and robustness in neurons of the first two stages of accessory olfactory processing, the vomeronasal organ (VNO) and accessory olfactory bulb (AOB). We show that firing rate responses of just a few well-chosen mouse VNO or AOB neurons can be used to reliably encode both sex and strain of other mice from cues contained in urine. Additionally, we show that this population code can generalize to new concentrations of stimuli and appears to represent stimulus identity in terms of diverging paths in coding space. Together, the results indicate that firing rate code on the temporal order of seconds is sufficient for accurate classification of pheromonal patterns at different concentrations and may be used by AOS neural circuitry to discriminate among naturally occurring urine stimuli.


Figures

Figure 1.
Figure 1.
Recording from AOB and using responses of individual neurons to distinguish between stimuli. A, Experimental AOB recording setup: dilute urine from male and female mice of four different strains and Ringer's saline are delivered through a stimulus tube in random order to the VNO of the anesthetized female B6D2F1 mouse while AOB neuronal responses are recorded using 16 channel Neuronexus electrodes. B, Application of a urine stimulus to VNO for 10 s (horizontal black bar, top; female 129Sv urine) results in a neuronal firing rate increase in AOB. Calibration: 50 μV, 10 s. C, Single-unit neuronal spikes from complete recording, partially represented in B. Calibration: 50 μV, 1 ms. D, Proportion of neurons that responded to one or more stimuli. E, F, Raster plots (top) and peristimulus time histograms (bottom) of firing rate of two example cells in response to 10 s presentation of stimulus. The mean ± SD is shown. The stimulus naming convention is shown in D: strains BALB/c, CBA, B6D2, and 129Sv are renamed 1, 2, 3, and 4, respectively. The same convention applies in all subsequent figures. G, Firing rate responses, Δr, of two example neurons from E and F (here called Cell 1 and Cell 2, respectively) calculated over the 10 s stimulus presentation period. Each point is the Δr resulting from one stimulus repeat. Tight clustering of points for the same stimulus (e.g., red triangles, F1, female BALB/c urine) corresponds to a reliable response. On the other hand, high degree of scatter (e.g., red-orange squares, F2, female CBA urine) generally corresponds to high trial-to-trial variability. The circled point shows one of the five trials of female 129Sv urine (stimulus that yielded large responses in both neurons.) H, Stimulus classification accuracy of individual and combined cells 1 and 2, calculated using normalized Δr and the k nearest neighbors algorithm (see Materials and Methods). RC, Ringer's control.
Figure 2.
Figure 2.
Distinguishing both sex and strain using AOB neurons. A, Firing rate responses of all single units responsive to at least one of the urine stimuli, recorded from female B6D2F1 mice (n = 14). Highlighted by two arrowheads are the two example cells from Figure 1, E and F. B, C, First two and three LDA projections of the AOB data set. LD1, LD2, and LD3 are the LDA directions 1, 2, and 3, respectively. D, Classification result matrix (confusion matrix) for the AOB, using k = 4, LDA dimensions 1–5 [vertical axis, patterns presented; horizontal axis, patterns predicted (classified)]. E, Classification accuracy is not strongly dependent on the number of LDA dimensions used beyond 3, nor is it dependent on the number of neighbors (k) used. F, Classification success rate as a function of cell pool size. Using k = 4 and LDA dimensions 1–5 as determined in (E), we built up the ensemble of cells. Black line, Success rate across all stimuli (4M+4F); blue line, success rate when distinguishing only among male urine stimuli (4M); red line, success rate when distinguishing only among female urine stimuli (4F). RC, Ringer's control.
Figure 3.
Figure 3.
Classification of stimuli by the VNO. A, Firing rates of 64 VNO single units collected from female mice (n = 12) responsive to at least one stimulus at p < 0.05. B, Classification success rate as a function of cell pool size (k = 5, LDA dimensions 1–7). Black line, Success rate across all stimuli (4M+4F); blue line, success rate when distinguishing only among male urine stimuli (4M); red line, success rate when distinguishing only among female urine stimuli (4F). C, D, First two and three LDA projections of best 25 cells in the VNO data set. LD1, LD2, and LD3 are the LDA directions 1, 2, and 3, respectively. E, Classification result matrix (confusion matrix) for best 25 cells in the VNO [k = 5, LDA dimensions 1–7; vertical axis, patterns presented; horizontal axis, patterns predicted (classified)]. F, Classification matrix for all 64 cells. RC, Ringer's control.
Figure 4.
Figure 4.
VNO, 25 presentations of each stimulus. A, Firing rate responses (Δr) of 87 single units recorded from n = 5 female B6D2F1 mice. Similar segregation of responses to male (M) and female (F) cues among the population of neurons as seen in Figure 3A. B, Varying k and number of dimensions to find the best parameters. Classification accuracy is not strongly dependent on the number of LDA dimensions used beyond 4, nor is it dependent on number of neighbors (k) used beyond 10. C, Classification success rate as a function of neuronal pool size (k = 11, 6 LDA dimensions). Black line, Success rate across all stimuli (4M+4F); blue line, success rate when distinguishing only among male urine stimuli (4M); red line, success rate when distinguishing only among female urine stimuli (4F). D, Three-dimensional LDA for best 44 cells. LD1, LD2, and LD3 are the LDA directions 1, 2, and 3, respectively. E, Confusion matrix for the best 44 cells. The color scale is the same as in F. F, Confusion matrix for all cells. For 25 repeats, the decline in accuracy is much less dramatic than for 5 repeats (compare Fig. 3E,F). RC, Ringer's control.
Figure 5.
Figure 5.
Statistical measures of stimulus response similarity for neuronal ensembles. A, Left, Average across all cells of pairwise d′ values between cell Δr responses to stimuli in VNO; right, d′ is averaged across cells for all 6 possible pairs of male stimuli (-M), 6 pairs of female stimuli (-F), 16 pairs of male–female stimuli (M–F), 4 pairs of male–Ringer's (M–RC), and 4 pairs of female–Ringer's (F–RC). The mean ± SD is shown. B, Left, Pairwise correlations between neuronal ensemble responses to stimuli; right, correlation values averaged for the corresponding pairs of stimuli. C, Same as A, but for AOB. D, Same as B, but for AOB.
Figure 6.
Figure 6.
Distinguishing both sex and strain using maximum likelihood classifiers. A, Building up the VNO cell ensemble with two different classifiers: ML (green line) and LDA–kNN (black line, same as in Fig. 3B). B, Building up the AOB cell ensemble with two different classifiers: ML (green line) and LDA–kNN (black line, same as in Fig. 2F).
Figure 7.
Figure 7.
Using temporal dynamics of AOB and VNO neuronal firing to code for urine stimuli from males and females of different strains. A, Classification accuracy for AOB (n = 41 neurons, urine at 1:100 dilution in Ringer's) using binned firing rate independently and time bin size 2.5 s. Firing rates at time points denoted by green squares are used together in B. Stimulus is presented at time 0, lasting 10 s. Classification algorithm LDA followed by kNN is used (k = 4, dimensions 1–5, as in Fig. 2). Error bars indicate SD of accuracy after 10 iterations of the fivefold validation procedure. B, AOB classification accuracy of nine stimuli [including Ringer's control (RC)] using jointly the firing rates at four specific time points during the stimulus presentation cycle (marked by green squares in A). C, PCA of the time course of firing rate in AOB (mean across 5 stimulus trials) for the entire stimulus presentation cycle: 10 s on, 30 s Ringer's flush. The 40 s interval is divided into 16 time bins. Left and right panels show different aspects of the response time course trajectory: left, pattern trajectories separate into different “leaflets”; right, responses traverse ellipsoidal trajectories. D–F, Same analysis as in A–C, respectively, performed for VNO (n = 64 neurons, urine at 1:100 dilution in Ringer's, k = 5, dimensions 1–7 as in Fig. 3).
Figure 8.
Figure 8.
Concentration-invariant odor coding in AOB and VNO. A, AOB firing rate responses of 31 neurons to male and female BALB/c and CBA urine at three different dilutions (1:100, 1:300, and 1:1000). B, VNO firing rate responses of 54 neurons to the same urine stimuli at three different dilutions as in A. C, LDA projections of AOB responses at 1:100, 1:300, and 1:1000 stimulus dilutions intermixed. Each group, such as male BALB/c (MBALB), contains 15 points, 5 points at each dilution. D, LDA projections of VNO responses at dilutions 1:100, 1:300, and 1:1000. E, Classification accuracy matrix for AOB for the best 29 cells (left) and all 31 cells (right). F, Classification for VNO for the best 29 cells (left) and all 54 cells (right). G, H, Mean centroids for LDA projections of the best AOB (G) and VNO (H) cell responses for every stimulus at each of the three dilutions. Colored lines join points corresponding to the same stimulus. For every stimulus, making it more concentrated resulted in cell responses farther away from the origin in the LDA space. I, J, Maximum central angles θmax for the original trajectories (black bars) and trajectories resulting from shuffled labels (green) at each dilution. The difference between distributions was assessed with Wilcoxon's rank-sum test: AOB, p = 0.003 (I); VNO, p = 0.003 (J). RC, Ringer's control; FBALB, female BALB/c; FCBA, female CBA; MCBA, male CBA.
Figure 9.
Figure 9.
Concentration-invariant odor coding in AOB and VNO: training and testing on different dilutions. A, Train to classify male and female urine on two strains (BALB/c and CBA) at one dilution (for AOB). Resultant linear directions (LDs) from this dilution were used to test on the other two dilutions. Horizontal axis, Dilution of the test urine in Ringer's control (RC); vertical axis, classification accuracy. Black line (control), Train and test classifier at the same urine dilution. The horizontal position for some circles was shifted by a small amount to reduce overlap. B, Same as in A, but for VNO.

Similar articles

Cited by

References

    1. Arnson HA, Holy TE. Chemosensory burst coding by mouse vomeronasal sensory neurons. J Neurophysiol. 2011;106:409–420. doi: 10.1152/jn.00108.2011. - DOI - PMC - PubMed
    1. Arnson H, Holy T. Robust encoding of stimulus identity and concentration in the accessory olfactory system. J Neurosci. 2013;33:13388–13397. - PMC - PubMed
    1. Arnson H, Fu X, Holy T. Multielectrode array recordings of the vomeronasal epithelium. J Vis Exp. 2010:1845. - PMC - PubMed
    1. Beach FA. Sexual attractivity, proceptivity, and receptivity in female mammals. Horm Behav. 1976;7:105–138. doi: 10.1016/0018-506X(76)90008-8. - DOI - PubMed
    1. Ben-Shaul Y, Katz LC, Mooney R, Dulac C. In vivo vomeronasal stimulation reveals sensory encoding of conspecific and allospecific cues by the mouse accessory olfactory bulb. Proc Natl Acad Sci U S A. 2010;107:5172–5177. doi: 10.1073/pnas.0915147107. - DOI - PMC - PubMed

Publication types

LinkOut - more resources