

Characteristic effects of stochastic oscillatory forcing on neural firing: analytical theory and comparison to paddlefish electroreceptor data
- PMID: 23966844
- PMCID: PMC3744407
- DOI: 10.1371/journal.pcbi.1003170
Characteristic effects of stochastic oscillatory forcing on neural firing: analytical theory and comparison to paddlefish electroreceptor data
Abstract
Stochastic signals with pronounced oscillatory components are frequently encountered in neural systems. Input currents to a neuron in the form of stochastic oscillations could be of exogenous origin, e.g. sensory input or synaptic input from a network rhythm. They shape spike firing statistics in a characteristic way, which we explore theoretically in this report. We consider a perfect integrate-and-fire neuron that is stimulated by a constant base current (to drive regular spontaneous firing), along with Gaussian narrow-band noise (a simple example of stochastic oscillations), and a broadband noise. We derive expressions for the nth-order interval distribution, its variance, and the serial correlation coefficients of the interspike intervals (ISIs) and confirm these analytical results by computer simulations. The theory is then applied to experimental data from electroreceptors of paddlefish, which have two distinct types of internal noisy oscillators, one forcing the other. The theory provides an analytical description of their afferent spiking statistics during spontaneous firing, and replicates a pronounced dependence of ISI serial correlation coefficients on the relative frequency of the driving oscillations, and furthermore allows extraction of certain parameters of the intrinsic oscillators embedded in these electroreceptors.
Conflict of interest statement
The authors have declared that no competing interests exist.
Figures
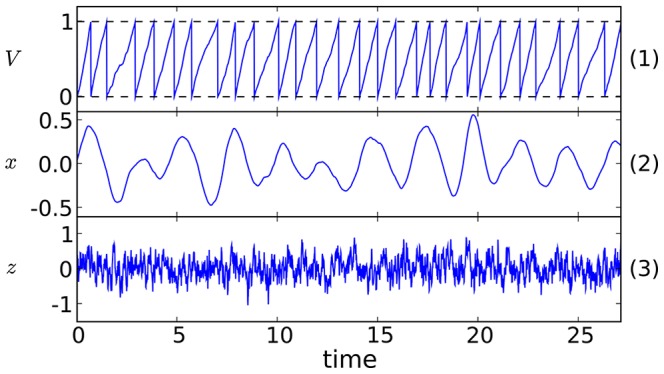
 (top panel),
  (middle panel), or
  (bottom panel). Parameters:
  ,
,  ,
,  , and
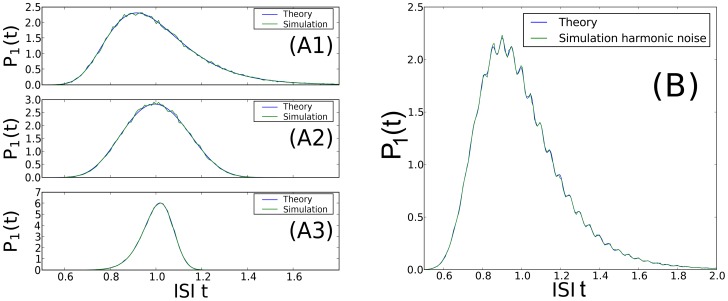
, and  . B: Example of a multimodal ISI histogram at high relative driving frequency
  , with harmonic noise input that was nearly periodic (large quality factor
  ). Parameters:
  ,
,  ,
,  ,
,  ,
,  ,
,  and, consequently,
  .
.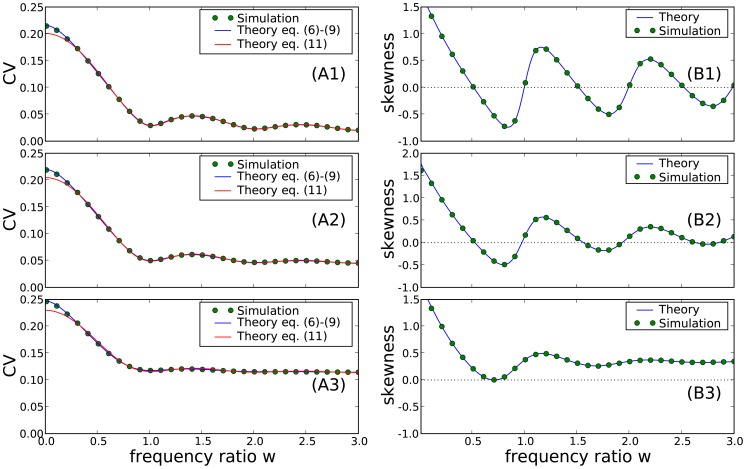
 (A1),
(A1),  (A2), or
  (A3). B: Skewness
  for
for  (B1)
(B1)  (B2), or
  (B3). Theoretical CV and skewness (blue) were computed by numerical integration from the theoretical ISI distribution Eq.(6)–Eq.(9) ; the simpler expression Eq.(11) is shown in red in A.
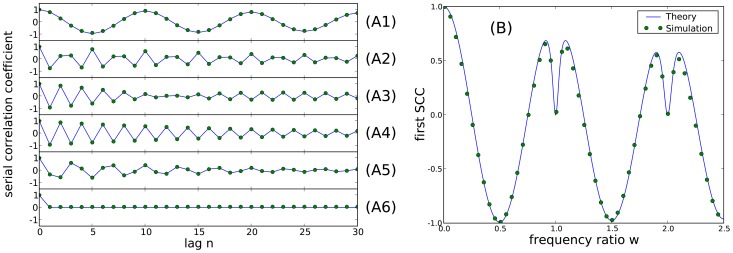
 of interspike intervals, for different values of the frequency ratio:
  (A1),
(A1),  (A2),
(A2),  (A3),
(A3),  (A4),
(A4),  (A5), or
  (A6). Parameters:
  ,
,  , and
, and  . Dots: simulation. Lines: theory. B: SCC at lag
  ,
,  , for highly coherent harmonic noise, as a function of
  . Parameters:
  ,
,  ,
,  . Theoretical curves were computed from Eq.(11) and Eq.(12).
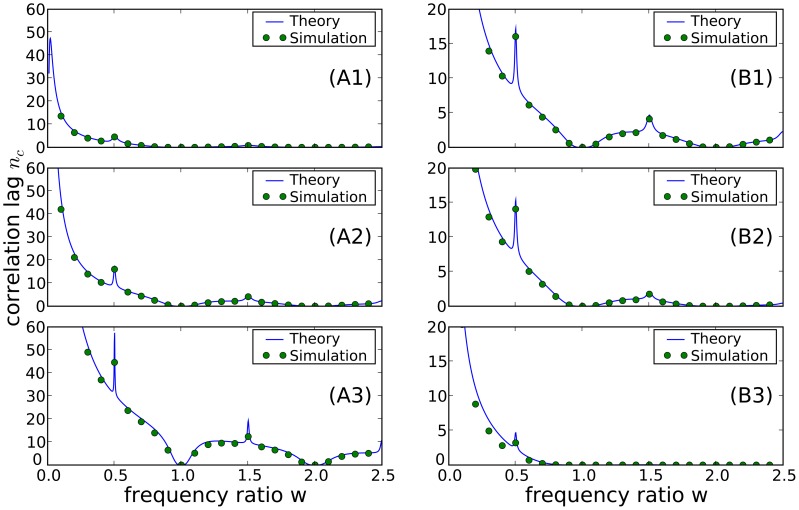
 (A1),
(A1),  (A2), and
  (A3). Parameters:
  , and
, and  . B: Correlation lag at different levels of OU broadband noise:
  (B1),
(B1),  (B2), and
  (B3). Parameters:
  ,
,  , and
, and  .
.
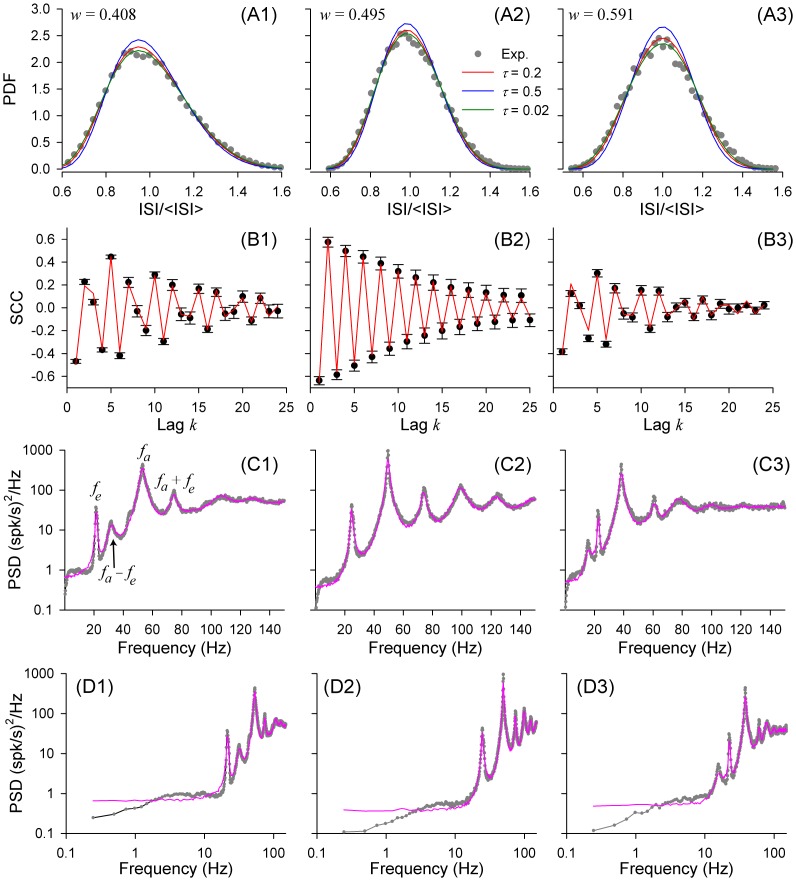
 ;
;  , 0.2 and 0.5 (legend in A2), and other parameters derived from fitting the SCCs, as explained in the Methods, final section. B: Serial correlation coefficients (SCCs). Theoretical red lines show least square fits using Eq.(12). C–D: Power spectral densities (PSDs). Theoretical lines (magenta) were obtained from numerical simulation of the PIF model using Eqs.(1–4), with
  , and other parameters the same as for theoretical curves in panels A1–3, derived from the SCC fitting procedure.
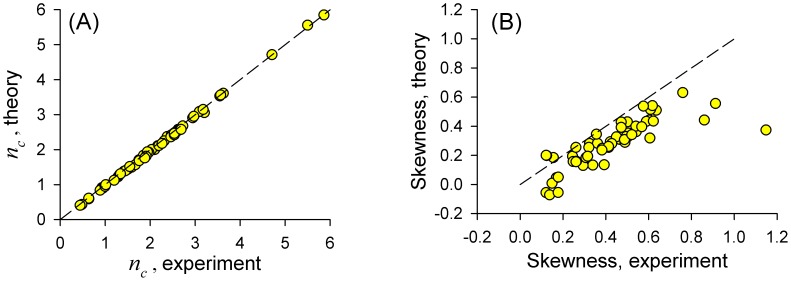
 calculated from the experimental data according to Eq.(14), vs. values from theory, Eq.(15), calculated using parameters obtained from fitting experimental SCCs. B: Skewness of experimental vs. theoretical ISI distributions. 45° line is shown by dashed strokes on both panels.
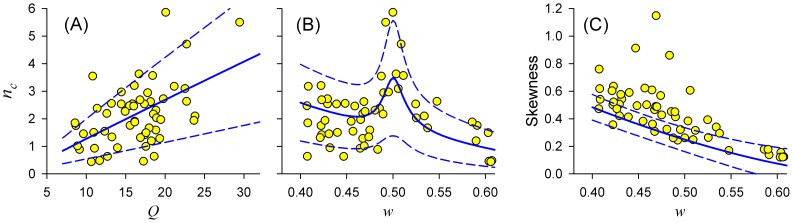
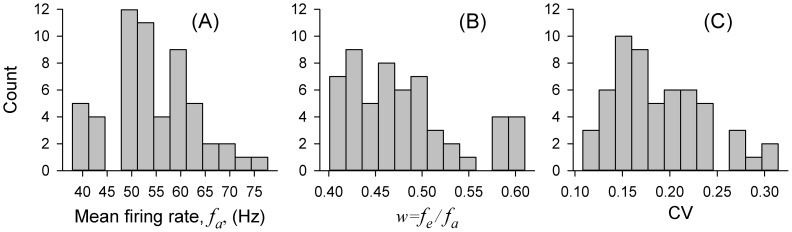
 , versus values of
  (A), or the frequency ratio
  (B), of epithelial oscillations. C: Skewness of ISI distributions versus frequency ratio
  . Blue lines: Theoretical results from PIF models for parameters extracted from each ER by fitting (Methods, final section), while varying
  or
or  . Solid blue lines: Mean curves for the sample. Dashed blue lines:
  standard deviation.
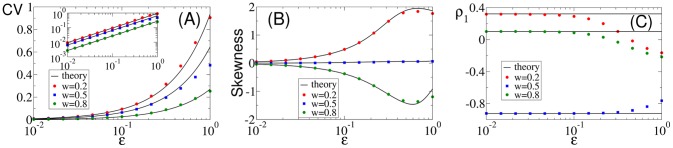
 ,
,  ,
,  , and
, and  .
.References
-
- Schmitz D, Gloveli T, Behr J, Dugladze T, Heinemann U (1998) Subthreshold membrane potential oscillations in neurons of deep layers of the entorhinal cortex. Neuroscience 85: 999–1004. - PubMed
-
- Donoghue JP, Sanes JN, Hatsopoulos NG, Gaál G (1998) Neural discharge and local field potential oscillations in primate motor cortex during voluntary movements. J Neurophysiol 79: 159–173. - PubMed
-
- Buzsáki G (2006) Rhythms of the Brain. New York, Oxford: Oxford University Press.
-
- Heiligenberg W (1991) Neural Nets in Electric Fish. Cambridge: MIT Press.
Publication types
MeSH terms
Grants and funding
LinkOut - more resources
Full Text Sources
Other Literature Sources
