. 2013 Aug;9(8):e1003543.
doi: 10.1371/journal.ppat.1003543. Epub 2013 Aug 15.

The role of selection in shaping diversity of natural M. tuberculosis populations

Affiliations

The role of selection in shaping diversity of natural M. tuberculosis populations

Caitlin S Pepperell et al. PLoS Pathog. 2013 Aug.

Erratum in

  • PLoS Pathog. 2013 Aug;9(8). doi:10.1371/annotation/cff22061-44d5-4301-b853-41702d160203. Holmes, Eddie C [corrected to Holmes, Edward C]

Abstract

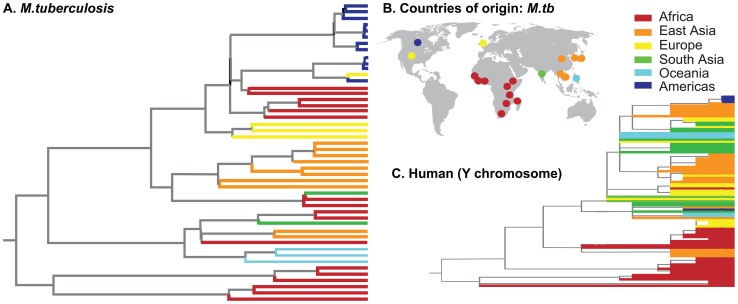
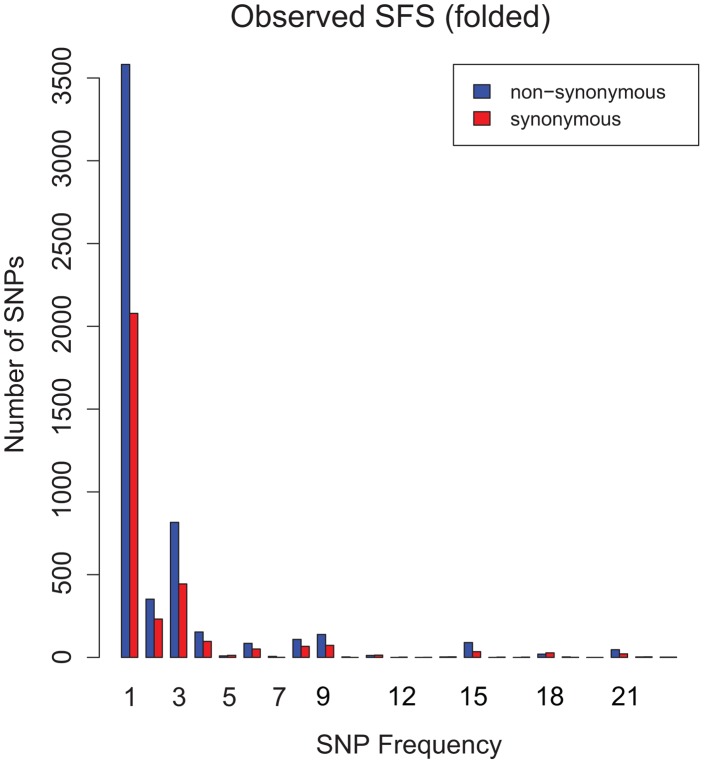
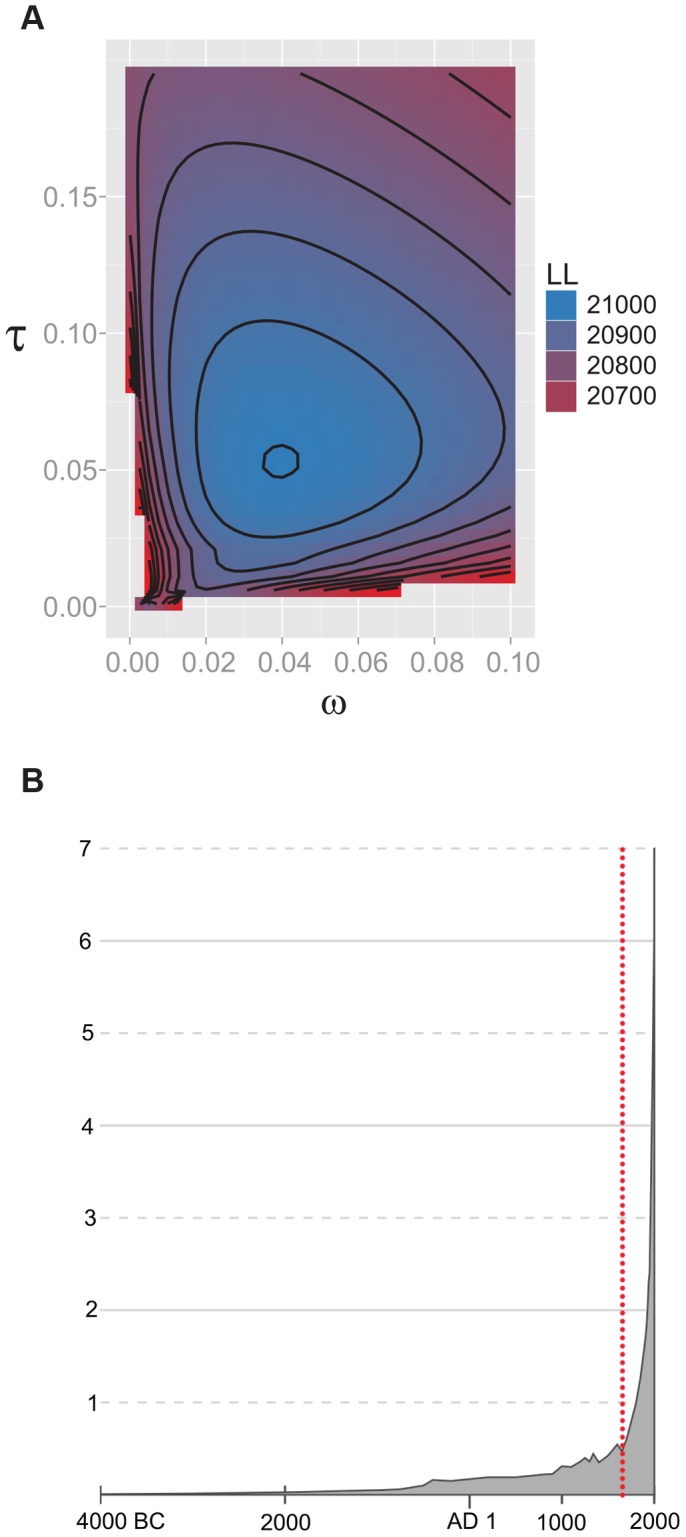
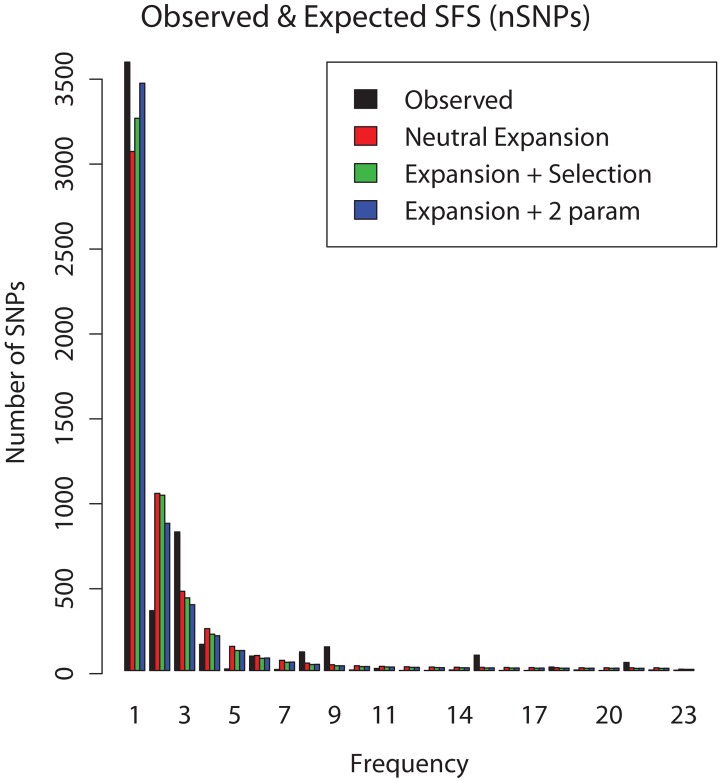
Mycobacterium tuberculosis (M.tb), the cause of tuberculosis (TB), is estimated to infect a new host every second. While analyses of genetic data from natural populations of M.tb have emphasized the role of genetic drift in shaping patterns of diversity, the influence of natural selection on this successful pathogen is less well understood. We investigated the effects of natural selection on patterns of diversity in 63 globally extant genomes of M.tb and related pathogenic mycobacteria. We found evidence of strong purifying selection, with an estimated genome-wide selection coefficient equal to -9.5 × 10(-4) (95% CI -1.1 × 10(-3) to -6.8 × 10(-4)); this is several orders of magnitude higher than recent estimates for eukaryotic and prokaryotic organisms. We also identified different patterns of variation across categories of gene function. Genes involved in transport and metabolism of inorganic ions exhibited very low levels of non-synonymous polymorphism, equivalent to categories under strong purifying selection (essential and translation-associated genes). The highest levels of non-synonymous variation were seen in a group of transporter genes, likely due to either diversifying selection or local selective sweeps. In addition to selection, we identified other important influences on M.tb genetic diversity, such as a 25-fold expansion of global M.tb populations coincident with explosive growth in human populations (estimated timing 1684 C.E., 95% CI 1620-1713 C.E.). These results emphasize the parallel demographic histories of this obligate pathogen and its human host, and suggest that the dominant effect of selection on M.tb is removal of novel variants, with exceptions in an interesting group of genes involved in transportation and defense. We speculate that the hostile environment within a host imposes strict demands on M.tb physiology, and thus a substantial fitness cost for most new mutations. In this respect, obligate bacterial pathogens may differ from other host-associated microbes such as symbionts.


Conflict of interest statement

The authors have declared that no competing interests exist.

Figures

Figure 1
Figure 1. Geographic and genetic structure of global sample of M.tb genomes.
A) Maximum clade credibility phylogeny inferred from genome-wide M.tb SNP data using BEAST . Tips are colored by the geographic origin of the M.tb isolate (see key). Descriptions of the 48 M.tb isolates shown here are in Table S1. B) Countries of origin for M.tb isolates used in this study are shown as colored dots on global map. One dot is shown per country but some countries were represented by >1 M.tb isolate. Colors correspond to global regions (see key). C) Phylogeny of global human populations from , based on Y chromosome data. Tips are colored according to the same scheme as the M.tb phylogeny (A).
Figure 2
Figure 2. Observed folded site frequency spectrum (SFS) of synonymous and non-synonymous SNPs.
Numbers of single nucleotide polymorphisms (SNPs, Y axis) in frequency classes 1–23 (X axis). The SFS is leptokurtic and bumpy, consistent with purifying selection and linkage of sites (see text).
Figure 3
Figure 3. A) Heatmap of likelihoods: demographic inference.
Heatmap of log10 likelihood values over a grid of values for two demographic parameters: τ = generations since expansion/Ne (Y axis) and ω = Nanc/Ne (X axis) where Nanc is the effective size of the ancestral population prior to expansion and Ne is the effective size of the current population. Log10 likelihood (LL) values of the data given various parameter values are indicated on the color key. There is a well demarcated peak in likelihood values. B) Historical growth of human and M.tb populations. Historical patterns of growth of human populations are shown in the gray curve, with calendar years on the X axis and size of global human population in billions on the Y axis. Data and image from http://en.wikipedia.org/wiki/World_population. The estimated timing of expansion of the global M.tb population is shown as a red dotted line (instantaneous expansion model, see text).
Figure 4
Figure 4. Expected site frequency spectrum (SFS) under various demographic and selective models.
The folded SFS for non-synonymous SNPs: observed values are shown in black, and expected values under different models are shown in colors. Expected SFS for an instantaneous past expansion is shown in red, expansion plus a single selection coefficient at all sites is shown in green, and expansion plus two coefficients of selection (one negative and the other zero) is shown in blue. The improved fit of the two parameter selection model appears to be driven primarily by the large number of singleton SNPs in the observed data.
Figure 5
Figure 5. Heatmap of likelihoods: inference of selection.
Heatmap of likelihood values over a grid of parameter values for neutral plus selected sites model. The proportion of neutral sites (p0) is shown on the X axis; the composite parameter γ (2Nes) is shown on the Y axis. There is a steep ridge of likelihoods at low values of p0.
Figure 6
Figure 6. Simulation and inference under purifying selection and complete linkage.
Results of four sets of simulation experiments (10,000 simulations/set). In all cases, a single completely linked locus of length equal to 2,753,618 bp was simulated under purifying selection, and inference of selection was done with a two parameter model (category of neutral sites plus single selection coefficient at remaining sites). The composite parameter γ ( = 2Nes) and proportion of neutral sites (p0) were estimated from the simulated data. These are shown on the Y and X axes of each panel, respectively. The number of counts of simulations with estimates within each grid value is indicated in the color key. A) Simulated γ = 1, p0 = 0; B) Simulated γ = 10, p0 = 0; C) Simulated γ = 1, p0 = 0.9; D) Simulated γ = 10, p0 = 0.9. Simulations of relatively weak purifying selection (panels A & C) paradoxically result in inference of extremely strong purifying selection (γ∼−3,000) in a large proportion of cases. This pattern disappears when stronger selection is simulated (panel B). Even when 90% of sites are evolving neutrally, purifying selection is inferred at a large proportion of sites (panels C & D), likely due to linkage of sites.
Figure 7
Figure 7. Median dN/dS values for pairwise comparisons among 47 M.tb isolates.
Observed median dN/dS values for pairwise comparisons among 47 isolates of M.tb. Median dN/dS values are shown on the X axis, while the number of COG (annotation) categories with each median value is shown on the Y axis.
Figure 8
Figure 8. Null distributions of median dN/dS for two COG categories.
Distributions of median dN/dS from 10,000 simulations in which synonymous and non-synonymous sites within the COG category were shuffled randomly. Red lines show observed median dN/dS value for the category. A: category J, translation and ribosomal structure. B: category V, defense.

References

    1. Achtman M (2008) Evolution, population structure, and phylogeography of genetically monomorphic bacterial pathogens. Annu Rev Microbiol 62: 53–70. - PubMed
    1. Hershberg R, Lipatov M, Small PM, Sheffer H, Niemann S, et al. (2008) High functional diversity in Mycobacterium tuberculosis driven by genetic drift and human demography. PLoS Biol 6: e311. - PMC - PubMed
    1. Udwadia ZF, Amale RA, Ajbani KK, Rodrigues C (2012) Totally drug-resistant tuberculosis in India. Clin Infect Dis 54: 579–581. - PubMed
    1. Gagneux S, DeRiemer K, Van T, Kato-Maeda M, de Jong BC, et al. (2006) Variable host-pathogen compatibility in Mycobacterium tuberculosis. Proc Natl Acad Sci U S A 103: 2869–2873. - PMC - PubMed
    1. Boyko AR, Williamson SH, Indap AR, Degenhardt JD, Hernandez RD, et al. (2008) Assessing the evolutionary impact of amino acid mutations in the human genome. PLoS Genet 4: e1000083. - PMC - PubMed

Publication types