. 2013 Aug;9(8):e1003565.
doi: 10.1371/journal.ppat.1003565. Epub 2013 Aug 15.

Coronaviruses lacking exoribonuclease activity are susceptible to lethal mutagenesis: evidence for proofreading and potential therapeutics

Affiliations

Coronaviruses lacking exoribonuclease activity are susceptible to lethal mutagenesis: evidence for proofreading and potential therapeutics

Everett Clinton Smith et al. PLoS Pathog. 2013 Aug.

Erratum in

  • PLoS Pathog. 2014 Jul;10(7):e1004342. Surdel, Matthew C [added]

Abstract

No therapeutics or vaccines currently exist for human coronaviruses (HCoVs). The Severe Acute Respiratory Syndrome-associated coronavirus (SARS-CoV) epidemic in 2002-2003, and the recent emergence of Middle East Respiratory Syndrome coronavirus (MERS-CoV) in April 2012, emphasize the high probability of future zoonotic HCoV emergence causing severe and lethal human disease. Additionally, the resistance of SARS-CoV to ribavirin (RBV) demonstrates the need to define new targets for inhibition of CoV replication. CoVs express a 3'-to-5' exoribonuclease in nonstructural protein 14 (nsp14-ExoN) that is required for high-fidelity replication and is conserved across the CoV family. All genetic and biochemical data support the hypothesis that nsp14-ExoN has an RNA proofreading function. Thus, we hypothesized that ExoN is responsible for CoV resistance to RNA mutagens. We demonstrate that while wild-type (ExoN+) CoVs were resistant to RBV and 5-fluorouracil (5-FU), CoVs lacking ExoN activity (ExoN-) were up to 300-fold more sensitive. While the primary antiviral activity of RBV against CoVs was not mutagenesis, ExoN- CoVs treated with 5-FU demonstrated both enhanced sensitivity during multi-cycle replication, as well as decreased specific infectivity, consistent with 5-FU functioning as a mutagen. Comparison of full-genome next-generation sequencing of 5-FU treated SARS-CoV populations revealed a 16-fold increase in the number of mutations within the ExoN- population as compared to ExoN+. Ninety percent of these mutations represented A:G and U:C transitions, consistent with 5-FU incorporation during RNA synthesis. Together our results constitute direct evidence that CoV ExoN activity provides a critical proofreading function during virus replication. Furthermore, these studies identify ExoN as the first viral protein distinct from the RdRp that determines the sensitivity of RNA viruses to mutagens. Finally, our results show the importance of ExoN as a target for inhibition, and suggest that small-molecule inhibitors of ExoN activity could be potential pan-CoV therapeutics in combination with RBV or RNA mutagens.


Conflict of interest statement

The authors have declared that no competing interests exist.

Figures
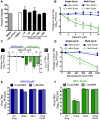
Figure 1
Figure 1. The antiviral activity of RBV against ExoN− viruses is not primarily due to mutagenesis.
(A) DBT cells in 96-well plates were incubated with DMEM alone, or DMEM containing 20% ethanol (EtOH), 4% DMSO, or the indicated concentration of RBV for 12 h. Cell viability was determined using CellTiter-Glo (Promega) according to manufacturer's instructions. All values were normalized to the untreated (DMEM) control. No significant differences were found when RBV-treated values were compared to DMEM samples containing DMSO (+DMSO) using an unpaired, two-tailed Student's t test. Mean values ± S.E.M. are shown, n = 2. (B) MHV-ExoN+ (filled circle) and MHV-ExoN− (open circle) virus sensitivity to RBV during single- (solid lines; MOI = 1 PFU/cell) and multi-cycle (dotted lines; MOI = 0.01 PFU/cell) replication. MHV-ExoN+ viruses are shown in blue and MHV-ExoN− viruses are shown in green. The change in virus titer was calculated by dividing virus titers following treatment by the untreated controls. Mean values ± S.E.M. are shown, n = 4. (C) The change in titer (filled bars) and genomic RNA levels (hatched bars) of MHV-ExoN+ (blue) and MHV-ExoN− (green) viruses following treatment with RBV is shown. DBT cells were infected with MHV-ExoN+ or MHV-ExoN− in the presence or absence of RBV, and virus titer was determined by plaque assay. Genomic RNA levels were determined using two-step real-time qRT-PCR and primers optimized to amplify a ∼120 nt region of ORF1a . The change in genomic RNA levels (2−ΔΔCt) is shown relative to endogenous GAPDH expression and was normalized to RNA levels from untreated samples. Mean values ± S.E.M. are shown, n = 6. (D) MHV-ExoN+ (filled circle) and MHV-ExoN− (open circle) virus sensitivity to mycophenolic acid (MPA) during single- (solid lines; MOI = 1 PFU/cell) and multi-cycle (dotted lines; MOI = 0.01 PFU/cell) replication. Mean values ± S.E.M. are shown, n = 2–4. RBV- or MPA-treated MHV-ExoN+ (E) and MHV-ExoN− (F) viruses with or without the addition of 100 µM guanosine (GUA) during single-cycle replication (MOI = 1 PFU/cell). Mean values ± S.E.M. are shown, n = 2. For all parts, statistical significance was determined using an unpaired, two-tailed Student's t test (*P<0.05, **P<0.01, ***P<0.0001).
Figure 2
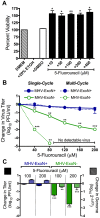
Figure 2. The increased sensitivity of MHV-ExoN− viruses to 5-FU is consistent with mutagenesis.
(A) DBT cells in 96-well plates were incubated with DMEM alone, or DMEM containing 20% ethanol (EtOH), 4% DMSO, or the indicated concentration of 5-FU for 12 h. Cell viability was determined using CellTiter-Glo (Promega) according to manufacturer's instructions. All values were normalized to the untreated (DMEM) control. Mean values ± S.E.M. are shown, n = 2. (B) MHV-ExoN+ (filled circle) and MHV-ExoN− (open circle) virus sensitivity to 5-FU during single- (solid lines; MOI = 1 PFU/cell) and multi-cycle (dotted lines; MOI = 0.01 PFU/cell) replication. MHV-ExoN+ viruses are shown in blue and MHV-ExoN− viruses are shown in green. The change in virus titer was calculated by dividing virus titers following treatment by the untreated controls. Mean values ± S.E.M. are shown, n = 4. (C) The change in titer (filled bars) and genomic RNA levels (hatched bars) of MHV-ExoN+ (blue) and MHV-ExoN− (green) viruses following treatment with 5-FU is shown. DBT cells were infected with MHV-ExoN+ or MHV-ExoN− in the presence or absence of 5-FU, and virus titer was determined by plaque assay. Genomic RNA levels were determined using two-step real-time qRT-PCR and primers optimized to amplify a ∼120 nt region of ORF1a . The change in genomic RNA levels (2−ΔΔCt) is shown relative to endogenous GAPDH expression and was normalized to RNA levels from untreated samples. Mean values ± S.E.M. are shown, n = 6. For all parts, statistical significance was determined using an unpaired, two-tailed Student's t test (*P<0.05, **P<0.01, ***P<0.0001).
Figure 3
Figure 3. SARS-ExoN− viruses have increased sensitivity to 5-FU.
(A) Vero cells in 96-well plates were incubated with DMEM alone, or DMEM containing 20% ethanol (EtOH), 4% DMSO, or the indicated concentration of RBV or 5-FU for 24 h. Cell viability was determined using CellTiter-Glo (Promega) according to manufacturer's instructions. All values were normalized to the untreated (DMEM) control. Mean values ± S.E.M. are shown, n = 3. The change in SARS-ExoN+ (filled blue circles) and SARS-ExoN− (empty green circles) titers following treatment with RBV (B) or 5-FU (C) during single-cycle replication. Vero cells were infected with either virus at an MOI of 0.1 PFU/cell, and virus supernatant was harvest 24 h post-infection following replication in the presence or absence of RBV or 5-FU. Virus titer was determined by plaque assay on Vero cells. Mean values ± S.E.M. are shown, n = 2 (RBV) and n = 4 (5-FU). (D) Comparison of unique statistically significant (P<0.05) minority variants present between untreated and 5-FU treated samples for both SARS-ExoN+ and ExoN− populations. SARS-ExoN+ viruses are shown in blue, and SARS-ExoN− viruses are shown in green. For panels A–C statistical significance was determined using an unpaired, two-tailed Student's t test (*P<0.05, **P<0.01, ***P<0.0001).
Figure 4
Figure 4. Incorporation of FUMP results in increased U:C and A:G transitions.
All possible base changes are shown for SARS-ExoN+ and SARS-ExoN− viruses in panels (A) and (B), respectively. Transitions (A↔G and U↔C) are shaded in grey, and 5-FU specific transitions (U:C and A:G) are marked with an asterisk. Transversions (A↔T, A↔C, C↔G, G↔T) are shown in white boxes. All values represent the number of unique statistically significant minority variants following 5-FU treatment. (C) The percent of all unique statistically significant minority variants represented by transversions (filled dark grey bars), C:U and G:A transitions (filled light grey bars), and the 5-FU specific transitions A:G (hatched bars) and U:C (checkered bars) are shown following 0 or 400 µM 5-FU treatment. SARS-ExoN+ viruses are shown in blue, and SARS-ExoN− viruses are shown in green.
Figure 5
Figure 5. 5-FU-mediated U:C and A:G transitions are distributed across the CoV genome at low frequency.
(A) and (B) The genomic distribution of low frequency statistically significant U:C and A:G variants within the SARS-ExoN+ population following treatment with 0 or 400 µM 5-FU. (C) and (D) Same as in A and B except for the SARS-ExoN− population. For all panels, SARS-ExoN+ viruses are shown in blue, and SARS-ExoN− viruses are shown in green. U:C transitions are denoted by a diamond, whereas A:G transitions are plotted as circles.

Comment in

References

    1. Zaki AM, van Boheemen S, Bestebroer TM, Osterhaus AD, Fouchier RA (2012) Isolation of a novel coronavirus from a man with pneumonia in Saudi Arabia. N Engl J Med 367: 1814–1820. - PubMed
    1. Perlman S, Netland J (2009) Coronaviruses post-SARS: update on replication and pathogenesis. Nat Rev Microbiol 7: 439–450. - PMC - PubMed
    1. Drosten C, Gunther S, Preiser W, van der Werf S, Brodt HR, et al. (2003) Identification of a novel coronavirus in patients with severe acute respiratory syndrome. N Engl J Med 348: 1967–1976. - PubMed
    1. Ksiazek TG, Erdman D, Goldsmith CS, Zaki SR, Peret T, et al. (2003) A novel coronavirus associated with severe acute respiratory syndrome. N Engl J Med 348: 1953–1966. - PubMed
    1. Peiris JSM, Lai ST, Poon LLM, Guan Y, Yam LYC, et al. (2003) Coronavirus as a possible cause of severe acute respiratory syndrome. Lancet 361: 1319–1325. - PMC - PubMed

Publication types

MeSH terms