. 2013 Jul 25:7:123.
doi: 10.3389/fncir.2013.00123. eCollection 2013.

Improved methods for chronic light-based motor mapping in mice: automated movement tracking with accelerometers, and chronic EEG recording in a bilateral thin-skull preparation

Affiliations

Improved methods for chronic light-based motor mapping in mice: automated movement tracking with accelerometers, and chronic EEG recording in a bilateral thin-skull preparation

Gergely Silasi et al. Front Neural Circuits. .

Abstract

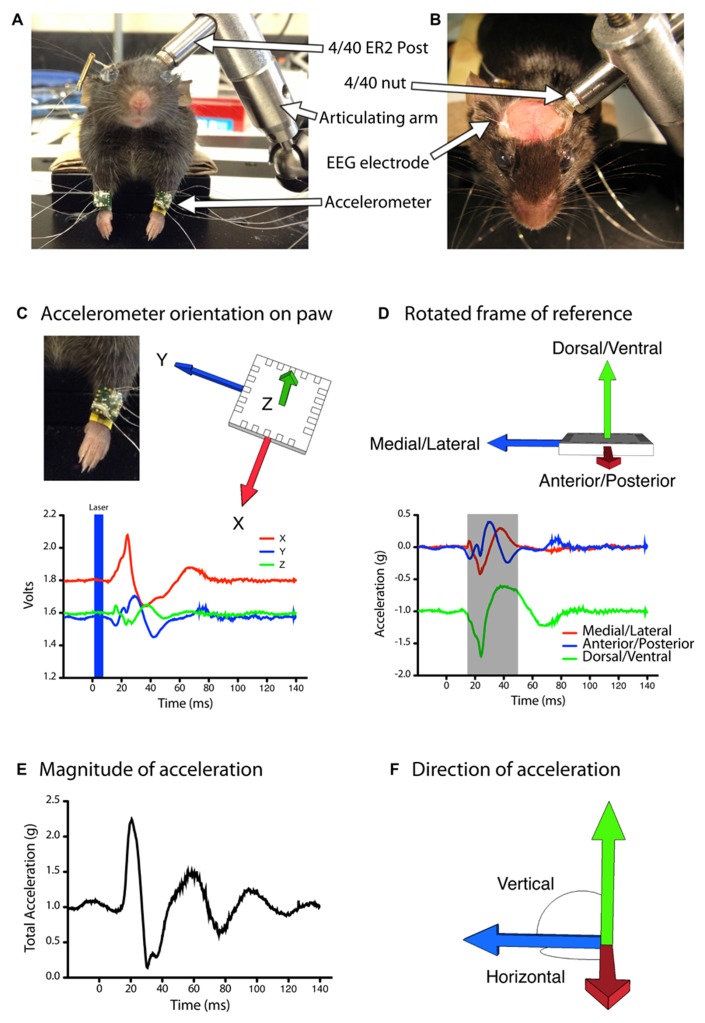
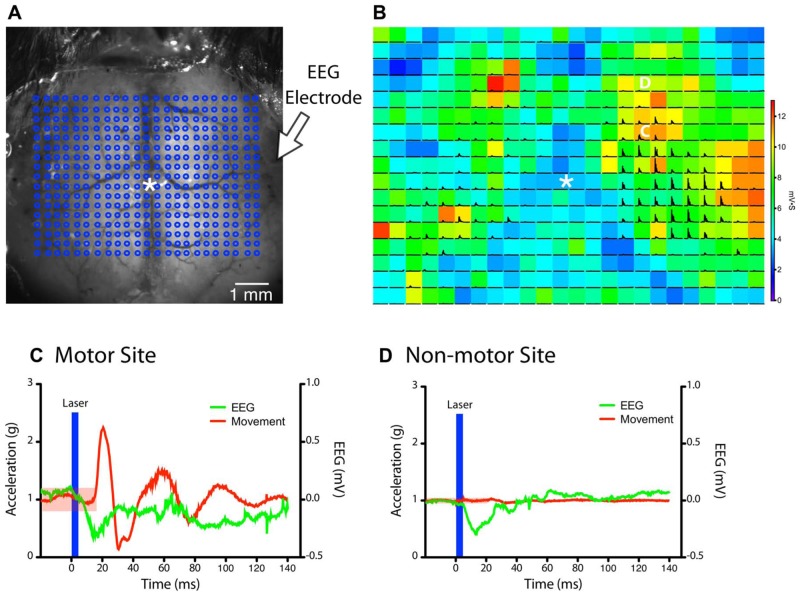
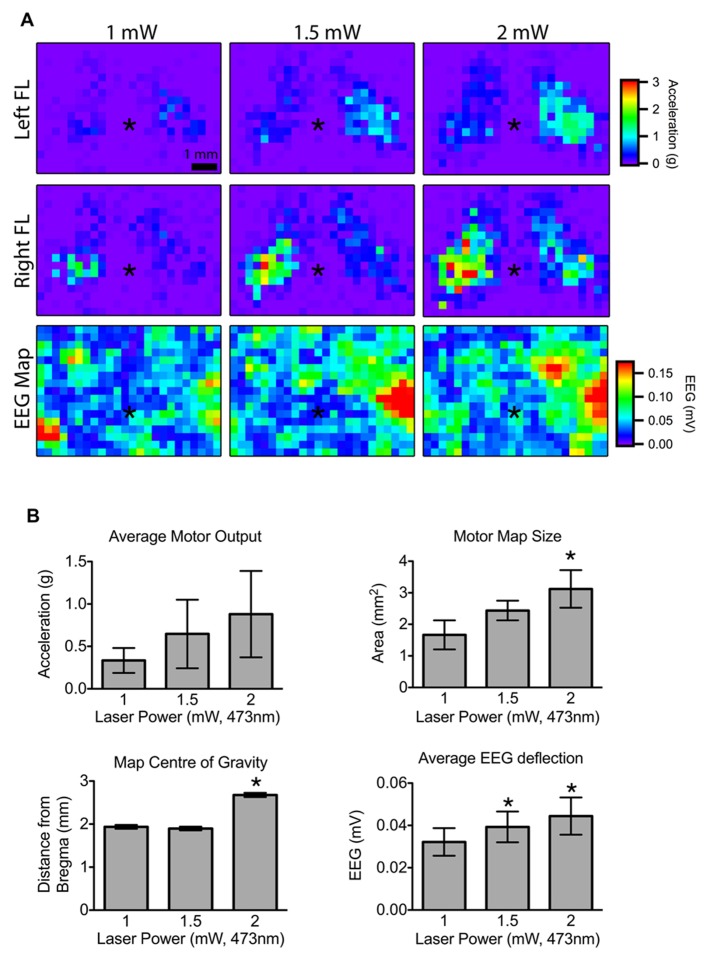
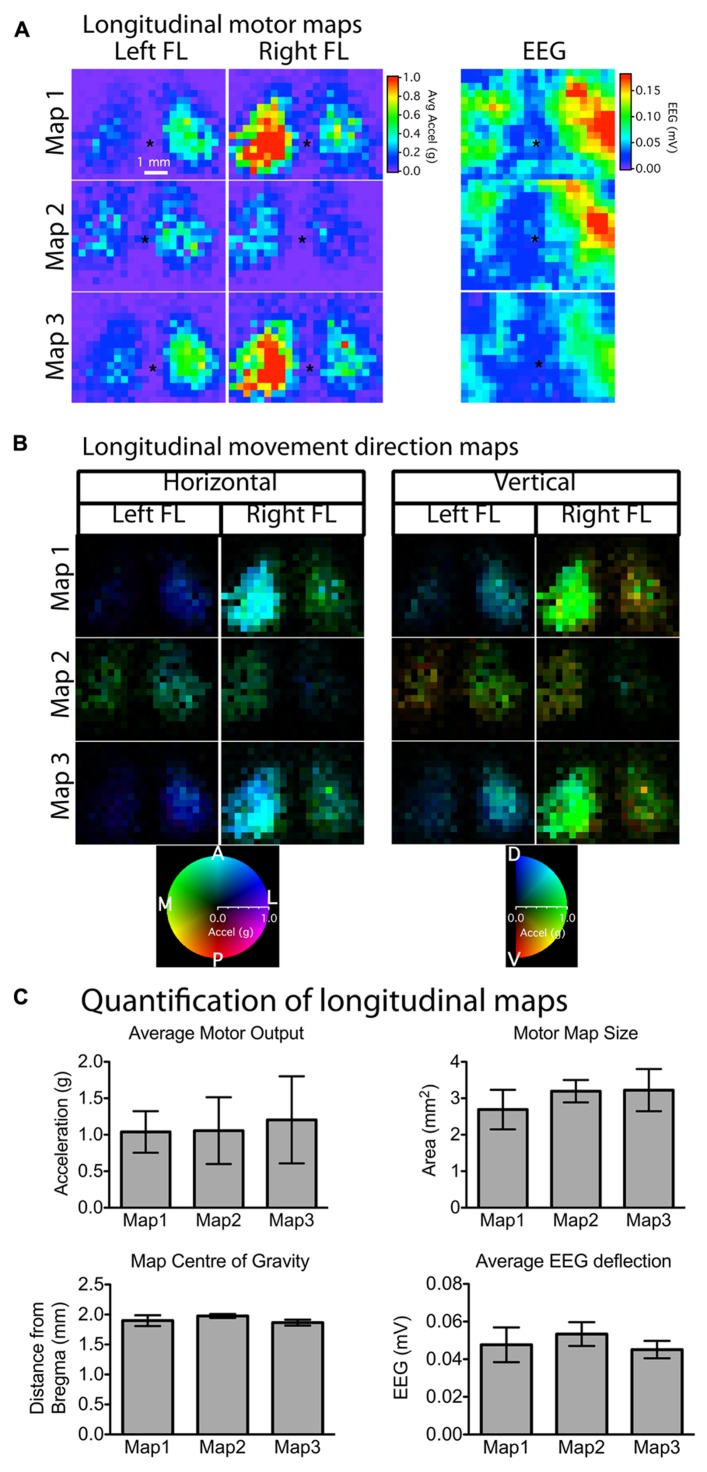
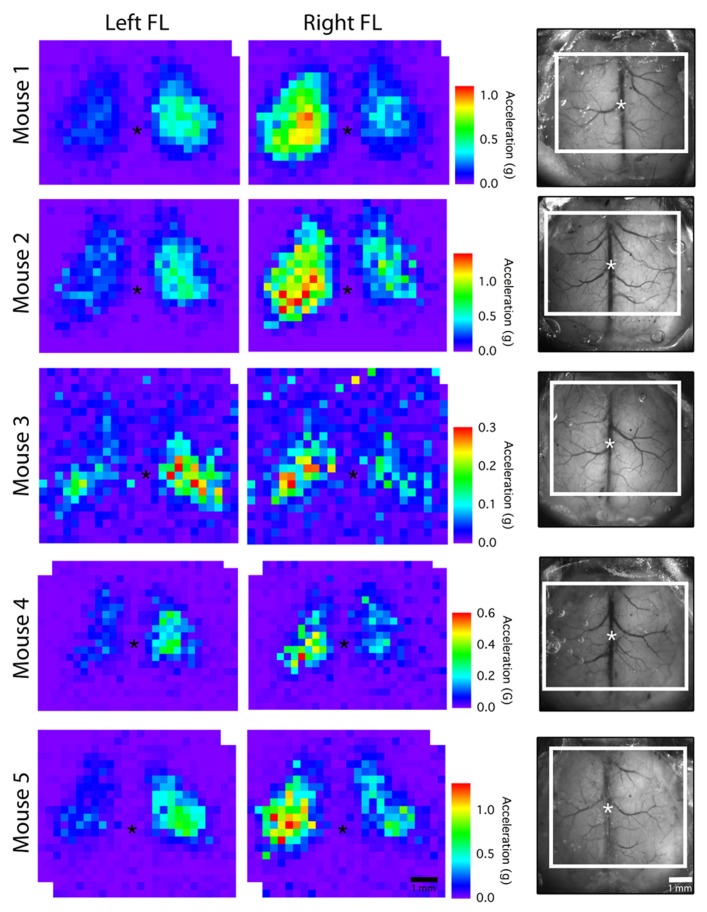
Optogenetic stimulation of the mouse cortex can be used to generate motor maps that are similar to maps derived from electrode-based stimulation. Here we present a refined set of procedures for repeated light-based motor mapping in ChR2-expressing mice implanted with a bilateral thinned-skull chronic window and a chronically implanted electroencephalogram (EEG) electrode. Light stimulation is delivered sequentially to over 400 points across the cortex, and evoked movements are quantified on-line with a three-axis accelerometer attached to each forelimb. Bilateral maps of forelimb movement amplitude and movement direction were generated at weekly intervals after recovery from cranial window implantation. We found that light pulses of ~2 mW produced well-defined maps that were centered approximately 0.7 mm anterior and 1.6 mm lateral from bregma. Map borders were defined by sites where light stimulation evoked EEG deflections, but not movements. Motor maps were similar in size and location between mice, and maps were stable over weeks in terms of the number of responsive sites, and the direction of evoked movements. We suggest that our method may be used to chronically assess evoked motor output in mice, and may be combined with other imaging tools to assess cortical reorganization or sensory-motor integration.

Keywords: accelerometer; chronic EEG; chronic window; cortex; motor mapping; mouse; optogenetics.


Figures

FIGURE 1
FIGURE 1
Automated quantification of evoked movements during light based motor mapping.(A,B) The head of the anesthetized mouse is stabilized with a head-fixing assembly consisting of a stainless steel (ER2) post, a 4/40 threaded nut and an articulating arm. The mouse is positioned with its limbs freely hanging in a natural posture. (C,D) Accelerometers are attached to each forelimb and the analog voltage signals are rotated into a frame of reference that aligns all of the acceleration due to gravity into the vertical (Z) axis. (D) The magnitude of acceleration averaged over a 30 ms period (gray shaded region) was used to construct motor maps based on peak acceleration (E) as well as movement direction in the vertical or horizontal planes (F).
FIGURE 2
FIGURE 2
Simultaneous monitoring of light stimulation evoked forelimb movements by accelerometers and cortical depolarization by EEG.(A) A grid of stimulation sites (18 × 23 points) within the chronic cranial window is targeted in random order by a collimated laser beam (asterisk “*” indicates bregma). (B) The magnitude of the EEG deflection for each pixel is represented as a colored heat-map, while black traces show the magnitude of acceleration recorded from the left forelimb (each pixel = 300 μm). The accelerometer and EEG signals from the points marked by the white C and D are expanded in the panels below. (C,D) Example traces of accelerometer (left paw) and EEG signals after stimulation of a site within the motor map (C) and outside the motor map (D) in the right hemisphere (from B). The region shaded in red indicates the threshold for detecting a movement (five times the SD of baseline data). A clearly visible EEG deflection is observed in both examples immediately after the light stimulus (blue bar). The movement response from the motor site (C) was delayed by ~18 ms after stimulus onset.
FIGURE 3
FIGURE 3
Effect of laser power on motor output and cortical depolarization.(A) Motor maps were generated from randomly interleaved trials of 1, 1.5, and 2 mW laser powers and the evoked movements from the left and right forelimbs (FL) were recorded. The corresponding EEG maps are shown below (asterisk “*” indicates bregma; each pixel = 300 μm). (B) Motor map size was significantly higher for 2 mW stimulation compared to 1 mW. The center of the 2 mW map was also significantly further from bregma compared to 1 or 1.5 mW maps. The magnitude of the average EEG deflection was significantly greater in the 1.5 and 2 mW maps relative to 1 mW (asterisk “*” indicates p <0.05 vs. 1 mW).
FIGURE 4
FIGURE 4
Stability of motor and EEG maps across mapping sessions weeks apart. (A) Motor and EEG maps generated weeks apart showed stability and reproducibility in terms of relative location (asterisk “*” indicates bregma) and size (number of responsive motor sites). Although there was noticeable variability in the absolute magnitude of movements between mapping sessions for individual animals (A), average motor output, motor map size, as well as map location were not significantly different among any of the three time-points (C). There was also no change in the magnitude of the average EEG deflection, suggesting that the preparation remained stable in terms of optical clarity and cortical excitability for the duration of the experiment. The majority of the evoked movements were in the anterior direction in the horizontal plane with a slight dorsal elevation in the vertical plane (B). The brightness of each pixel in the movement direction maps represents the magnitude of the evoked movement, whereas the direction in the horizontal and vertical planes is indicated by the color of each pixel (each pixel = 300 μm).
FIGURE 5
FIGURE 5
Average motor maps for individual mice. To assess inter-subject variability, motor output from the three mapping sessions was averaged to create an average motor map for each mouse. The dorsal view of the cranial window is shown on the right with the mapped region outlined in white (asterisk “*” indicates bregma; each pixel = 300 μm).

Similar articles

Cited by

References

    1. Asanuma H., Sakata H. (1967) Functional organization of a cortical efferent system examined with focal depth stimulation in cats. J. Neurophysiol. 30 35–54
    1. Ayling O. G. S., Harrison T. C., Boyd J. D., Goroshkov A., Murphy T. H. (2009) Automated light-based mapping of motor cortex by photoactivation of channelrhodopsin-2 transgenic mice. Nat. Methods 6 219–224 10.1038/nmeth.1303 - DOI - PubMed
    1. Barbay S., Guggenmos D., Nishibe M., Nudo R. (2012) Motor representations in the intact hemisphere of the rat are reduced after repetitive training of the impaired forelimb. Neurorehabil. Neural Repair 27 381–384 10.1177/1545968312465193 - DOI - PMC - PubMed
    1. Bonazzi L., Viaro R., Lodi E., Canto R., Bonifazzi C., Franchi G. (2013) Complex movement topography and extrinsic space representation in the rat forelimb motor cortex as defined by long-duration intracortical microstimulation. J. Neurosci. 33 2097–2107 10.1523/JNEUROSCI.3454-12.2013 - DOI - PMC - PubMed
    1. Brus-Ramer M., Carmel J. B., Martin J. H. (2009) Motor cortex bilateral motor representation depends on subcortical and interhemispheric interactions. J. Neurosci. 29 6196–6206 10.1523/JNEUROSCI.5852-08.2009 - DOI - PMC - PubMed

Publication types

LinkOut - more resources