

High and distinct range-edge genetic diversity despite local bottlenecks
- PMID: 23967038
- PMCID: PMC3744244
- DOI: 10.1371/journal.pone.0068646
High and distinct range-edge genetic diversity despite local bottlenecks
Abstract
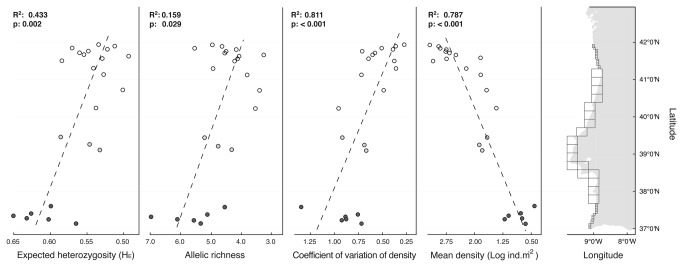
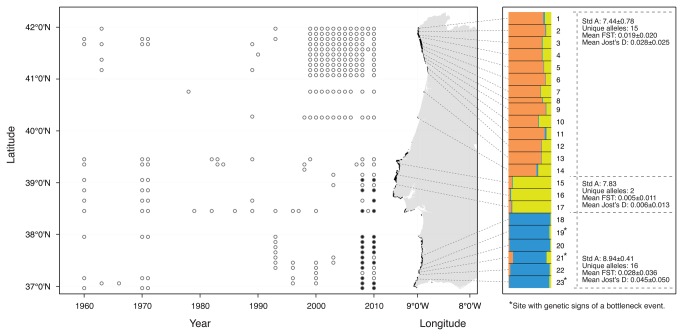
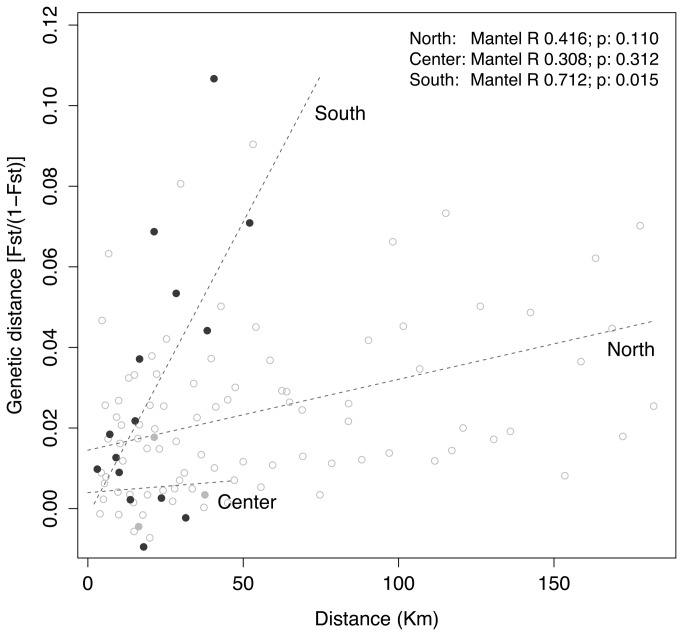
The genetic consequences of living on the edge of distributional ranges have been the subject of a largely unresolved debate. Populations occurring along persistent low latitude ranges (rear-edge) are expected to retain high and unique genetic diversity. In contrast, currently less favourable environmental conditions limiting population size at such range-edges may have caused genetic erosion that prevails over past historical effects, with potential consequences on reducing future adaptive capacity. The present study provides an empirical test of whether population declines towards a peripheral range might be reflected on decreasing diversity and increasing population isolation and differentiation. We compare population genetic differentiation and diversity with trends in abundance along a latitudinal gradient towards the peripheral distribution range of Saccorhiza polyschides, a large brown seaweed that is the main structural species of kelp forests in SW Europe. Signatures of recent bottleneck events were also evaluated to determine whether the recently recorded distributional shifts had a negative influence on effective population size. Our findings show decreasing population density and increasing spatial fragmentation and local extinctions towards the southern edge. Genetic data revealed two well supported groups with a central contact zone. As predicted, higher differentiation and signs of bottlenecks were found at the southern edge region. However, a decrease in genetic diversity associated with this pattern was not verified. Surprisingly, genetic diversity increased towards the edge despite bottlenecks and much lower densities, suggesting that extinctions and recolonizations have not strongly reduced diversity or that diversity might have been even higher there in the past, a process of shifting genetic baselines.
Conflict of interest statement
Figures
References
-
- Hampe A, Petit RJ (2005) Conserving biodiversity under climate change: the rear edge matters. Ecol Lett 8: 461-467. doi:10.1111/j.1461-0248.2005.00739.x. PubMed: 21352449. - DOI - PubMed
-
- Neiva J, Pearson GA, Valero M, Serrao EA (2012) Drifting fronds and drifting alleles: range dynamics, local dispersal and habitat isolation shape the population structure of the estuarine seaweed Fucus ceranoides L. J Biogeogr 39: 1167-1178. doi:10.1111/j.1365-2699.2011.02670.x. - DOI
-
- Billingham M, Reusch TB, Alberto F, Serrão EA (2003) Is asexual reproduction more important at geographical limits? A genetic test of the seagrass Zostera marina in the Ria Formosa, Portugal. Mar Ecol Prog Ser 265: 77-83. doi:10.3354/meps265077. - DOI
-
- Arnaud-Haond S, Teixeira S, Massa SI, Billot C, Saenger P et al. (2006) Genetic structure at range-edge: low diversity and high inbreeding in SE Asia mangrove (Avicennia marina) populations. Mol Ecol 15: 3515-3525. doi:10.1111/j.1365-294X.2006.02997.x. PubMed: 17032254. - DOI - PubMed
Publication types
MeSH terms
LinkOut - more resources
Full Text Sources
Other Literature Sources
Research Materials
Miscellaneous
