

Ovarian cancer stem cells are enriched in side population and aldehyde dehydrogenase bright overlapping population
- PMID: 23967051
- PMCID: PMC3742724
- DOI: 10.1371/journal.pone.0068187
Ovarian cancer stem cells are enriched in side population and aldehyde dehydrogenase bright overlapping population
Abstract
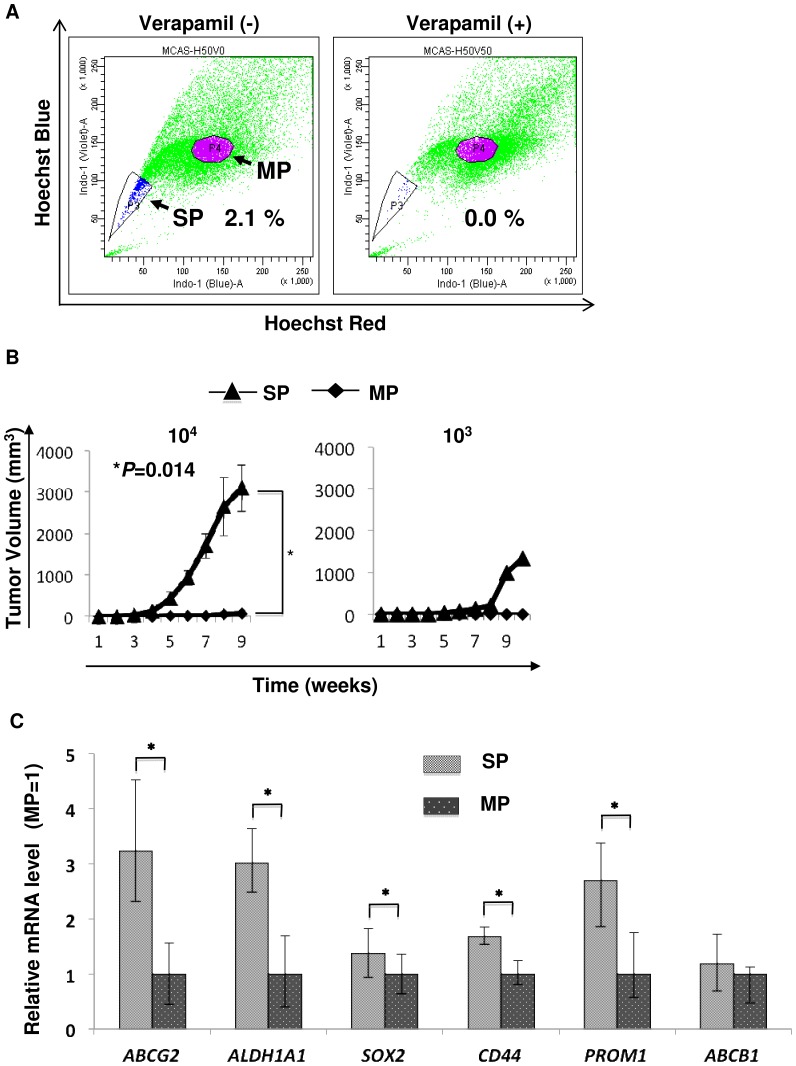
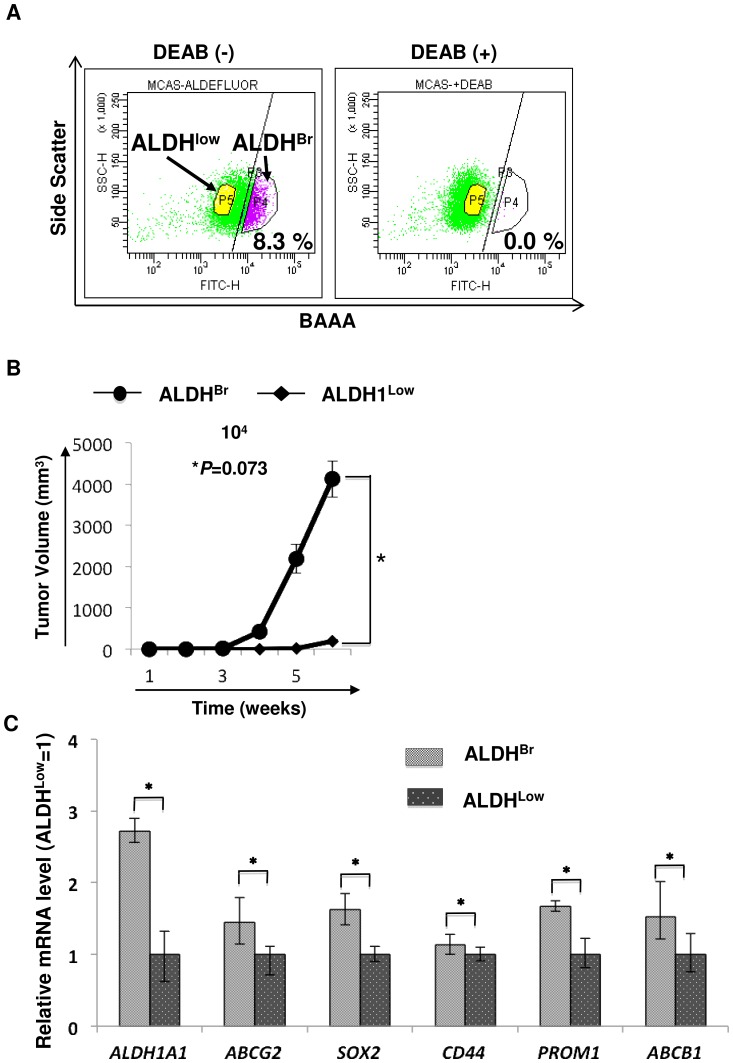
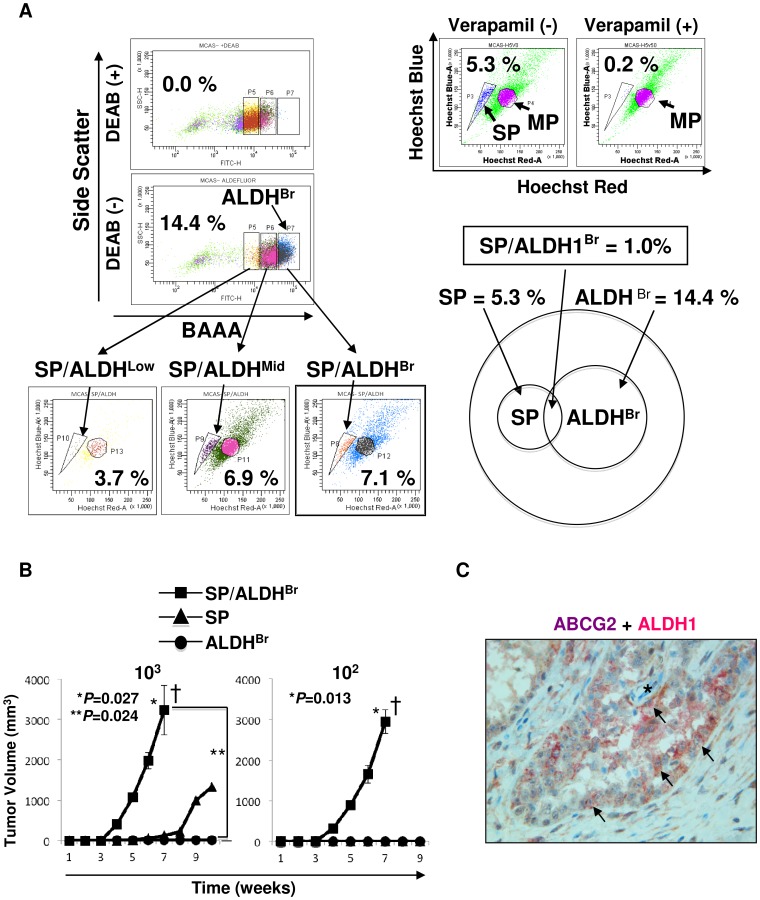
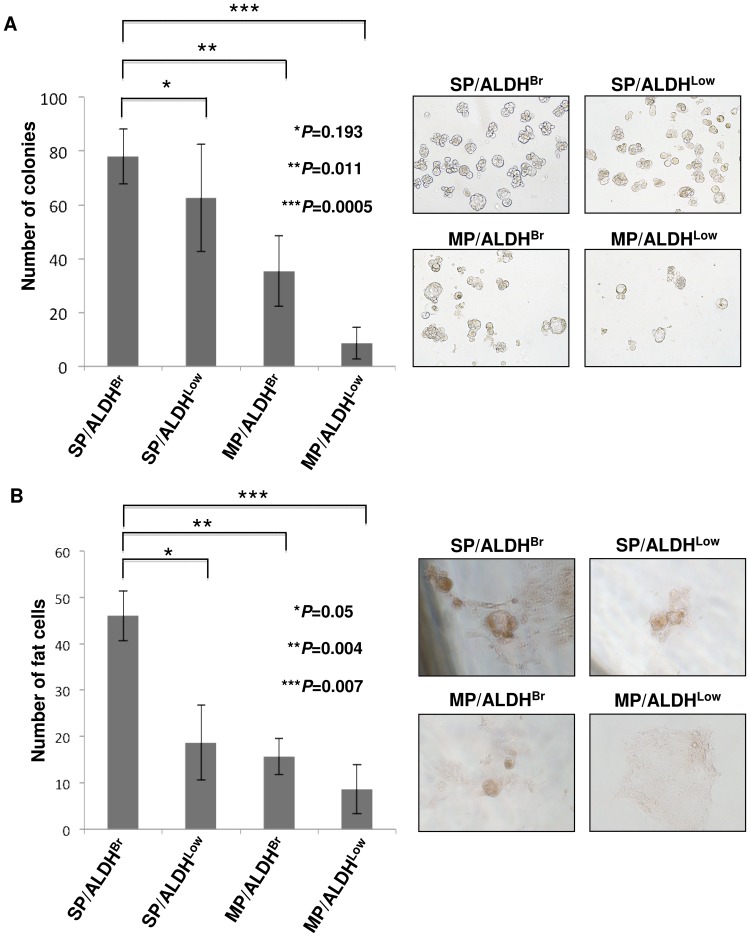
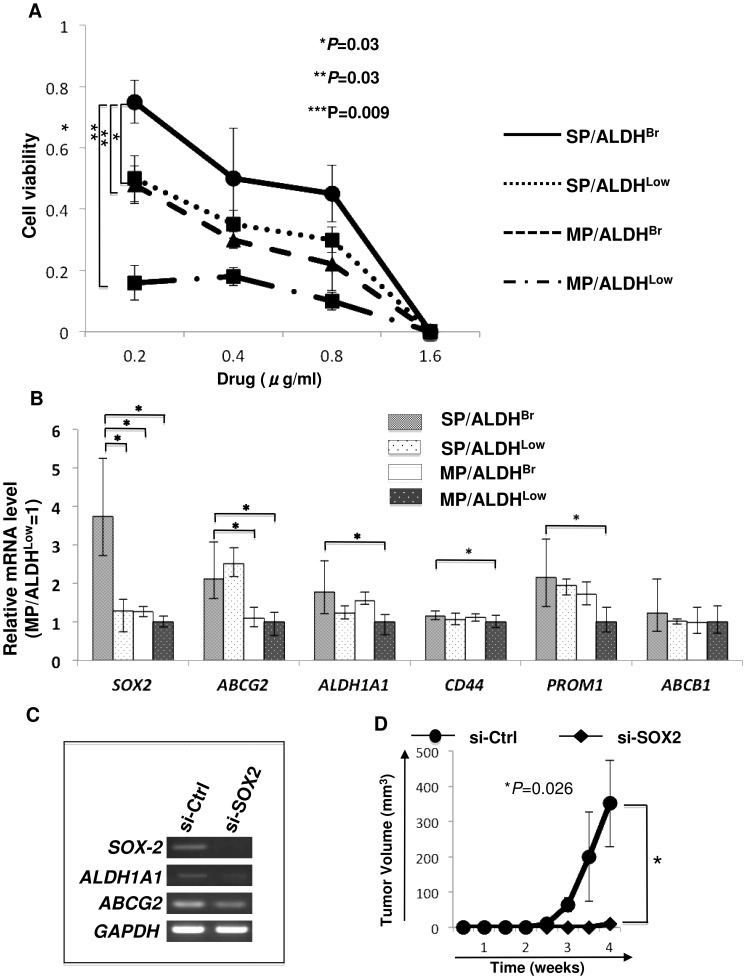
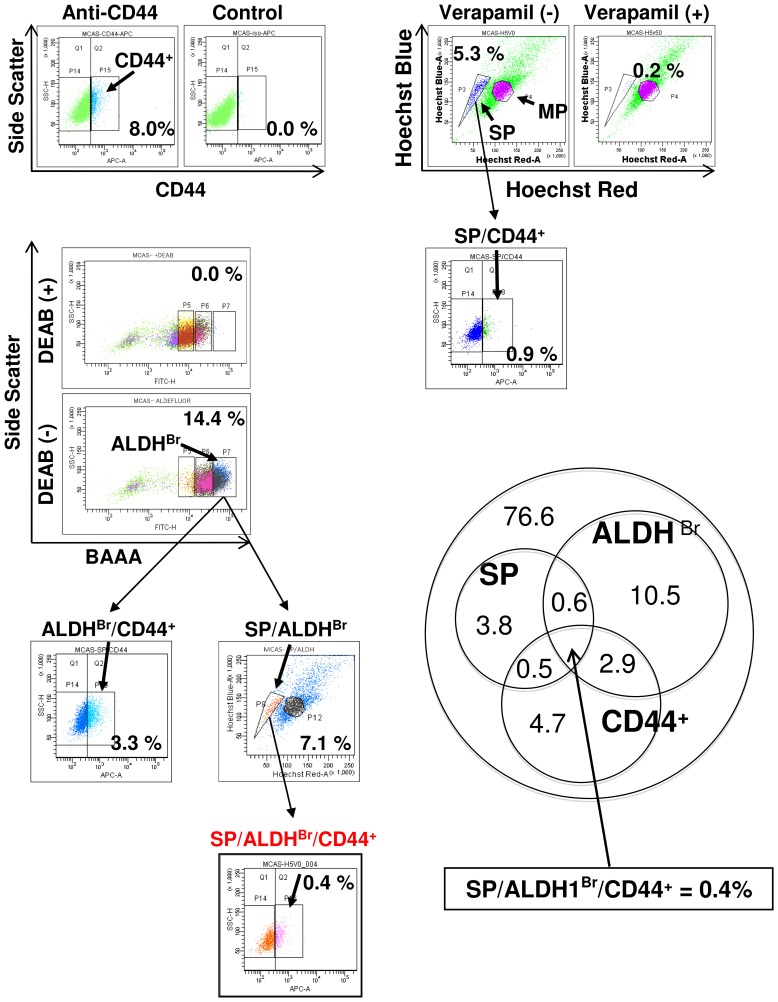
Cancer stem-like cells (CSCs)/cancer-initiaiting cells (CICs) are defined as a small population of cancer cells that have self-renewal capacity, differentiation potential and high tumor-initiating ability. CSCs/CICs of ovarian cancer have been isolated by side population (SP) analysis, ALDEFLUOR assay and using cell surface markers. However, these approaches are not definitive markers for CSCs/CICs, and it is necessary to refine recent methods for identifying more highly purified CSCs/CICs. In this study, we analyzed SP cells and aldehyde dehydrogenese bright (ALDH(Br)) cells from ovarian cancer cells. Both SP cells and ALDH(Br) cells exhibited higher tumor-initiating ability and higher expression level of a stem cell marker, sex determining region Y-box 2 (SOX2), than those of main population (MP) cells and ALDH(Low) cells, respectively. We analyzed an SP and ALDH(Br) overlapping population (SP/ALDH(Br)), and the SP/ALDH(Br) population exhibited higher tumor-initiating ability than that of SP cells or ALDH(Br) cells, enabling initiation of tumor with as few as 10(2) cells. Furthermore, SP/ADLH(Br) population showed higher sphere-forming ability, cisplatin resistance, adipocyte differentiation ability and expression of SOX2 than those of SP/ALDH(Low), MP/ALDH(Br) and MP/ALDH(Low) cells. Gene knockdown of SOX2 suppressed the tumor-initiation of ovarian cancer cells. An SP/ALDH(Br) population was detected in several gynecological cancer cells with ratios of 0.1% for HEC-1 endometrioid adenocarcinoma cells to 1% for MCAS ovary mucinous adenocarcinoma cells. Taken together, use of the SP and ALDH(Br) overlapping population is a promising approach to isolate highly purified CSCs/CICs and SOX2 might be a novel functional marker for ovarian CSCs/CICs.
Conflict of interest statement
Figures
Similar articles
-
Aldehyde Dehydrogenese-1 High Cancer Stem-like Cells/Cancer-initiating Cells Escape from Cytotoxic T Lymphocytes due to Lower Expression of Human Leukocyte Antigen Class 1.Anticancer Res. 2024 May;44(5):1877-1883. doi: 10.21873/anticanres.16989. Anticancer Res. 2024. PMID: 38677758
-
Regulation of Head and Neck Squamous Cancer Stem Cells by PI3K and SOX2.J Natl Cancer Inst. 2016 Sep 15;109(1):djw189. doi: 10.1093/jnci/djw189. Print 2017 Jan. J Natl Cancer Inst. 2016. PMID: 27634934 Free PMC article.
-
ALDH1-high ovarian cancer stem-like cells can be isolated from serous and clear cell adenocarcinoma cells, and ALDH1 high expression is associated with poor prognosis.PLoS One. 2013 Jun 6;8(6):e65158. doi: 10.1371/journal.pone.0065158. Print 2013. PLoS One. 2013. PMID: 23762304 Free PMC article.
-
C-Met pathway promotes self-renewal and tumorigenecity of head and neck squamous cell carcinoma stem-like cell.Oral Oncol. 2014 Jul;50(7):633-9. doi: 10.1016/j.oraloncology.2014.04.004. Epub 2014 May 15. Oral Oncol. 2014. PMID: 24835851 Review.
-
Potential Role of Nrf2, HER2, and ALDH in Cancer Stem Cells: A Narrative Review.J Membr Biol. 2024 Apr;257(1-2):3-16. doi: 10.1007/s00232-024-00307-2. Epub 2024 Feb 14. J Membr Biol. 2024. PMID: 38356054 Review.
Cited by
-
Therapeutic Efficacy of Cancer Stem Cell Vaccines in the Adjuvant Setting.Cancer Res. 2016 Aug 15;76(16):4661-72. doi: 10.1158/0008-5472.CAN-15-2664. Epub 2016 Jun 20. Cancer Res. 2016. PMID: 27325649 Free PMC article.
-
Combination of a thioxodihydroquinazolinone with cisplatin eliminates ovarian cancer stem cell-like cells (CSC-LCs) and shows preclinical potential.Oncotarget. 2017 Dec 26;9(5):6042-6054. doi: 10.18632/oncotarget.23679. eCollection 2018 Jan 19. Oncotarget. 2017. PMID: 29464053 Free PMC article.
-
Phosphorylation of HSF1 at serine 326 residue is related to the maintenance of gynecologic cancer stem cells through expression of HSP27.Oncotarget. 2017 May 9;8(19):31540-31553. doi: 10.18632/oncotarget.16361. Oncotarget. 2017. PMID: 28415561 Free PMC article.
-
Acquisition of a side population fraction augments malignant phenotype in ovarian cancer.Sci Rep. 2019 Oct 2;9(1):14215. doi: 10.1038/s41598-019-50794-w. Sci Rep. 2019. PMID: 31578411 Free PMC article.
-
Epigenetic targeting of ovarian cancer stem cells.Cancer Res. 2014 Sep 1;74(17):4922-36. doi: 10.1158/0008-5472.CAN-14-1022. Epub 2014 Jul 17. Cancer Res. 2014. PMID: 25035395 Free PMC article.
References
Publication types
MeSH terms
Substances
LinkOut - more resources
Full Text Sources
Other Literature Sources
Medical
