. 2013 Aug 15;8(8):e70325.
doi: 10.1371/journal.pone.0070325. eCollection 2013.

Identification of multiple subsets of ventral interneurons and differential distribution along the rostrocaudal axis of the developing spinal cord

Affiliations

Identification of multiple subsets of ventral interneurons and differential distribution along the rostrocaudal axis of the developing spinal cord

Cédric Francius et al. PLoS One. .

Abstract

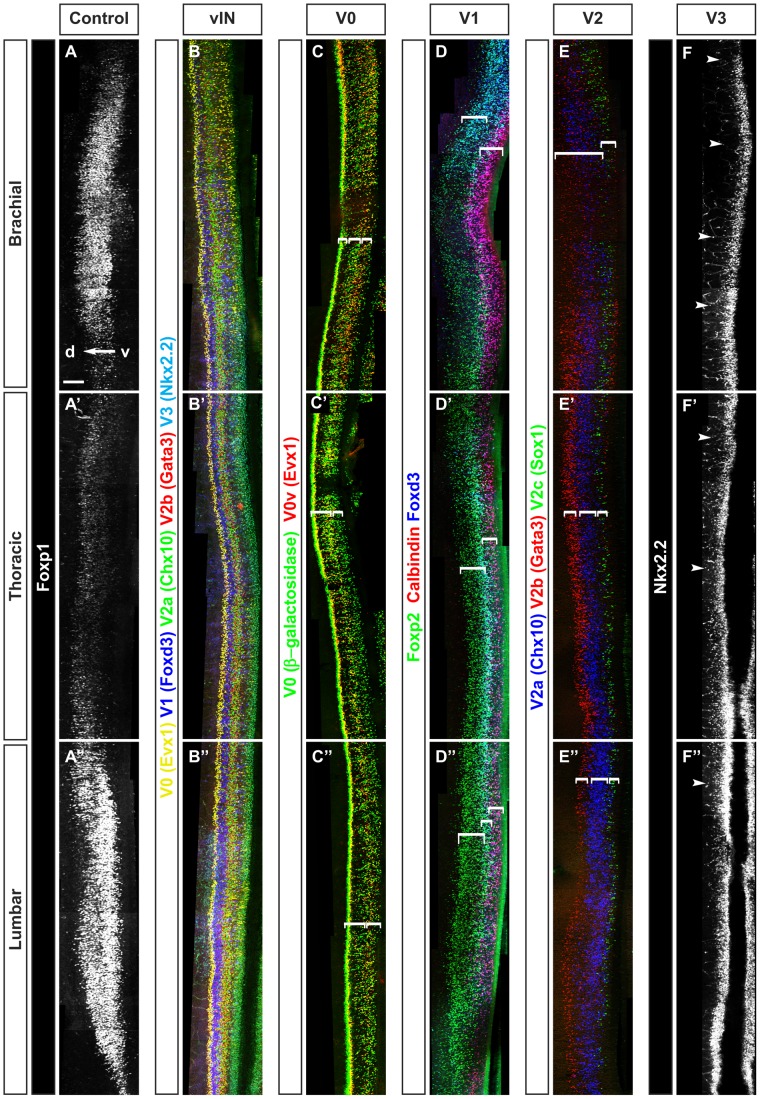
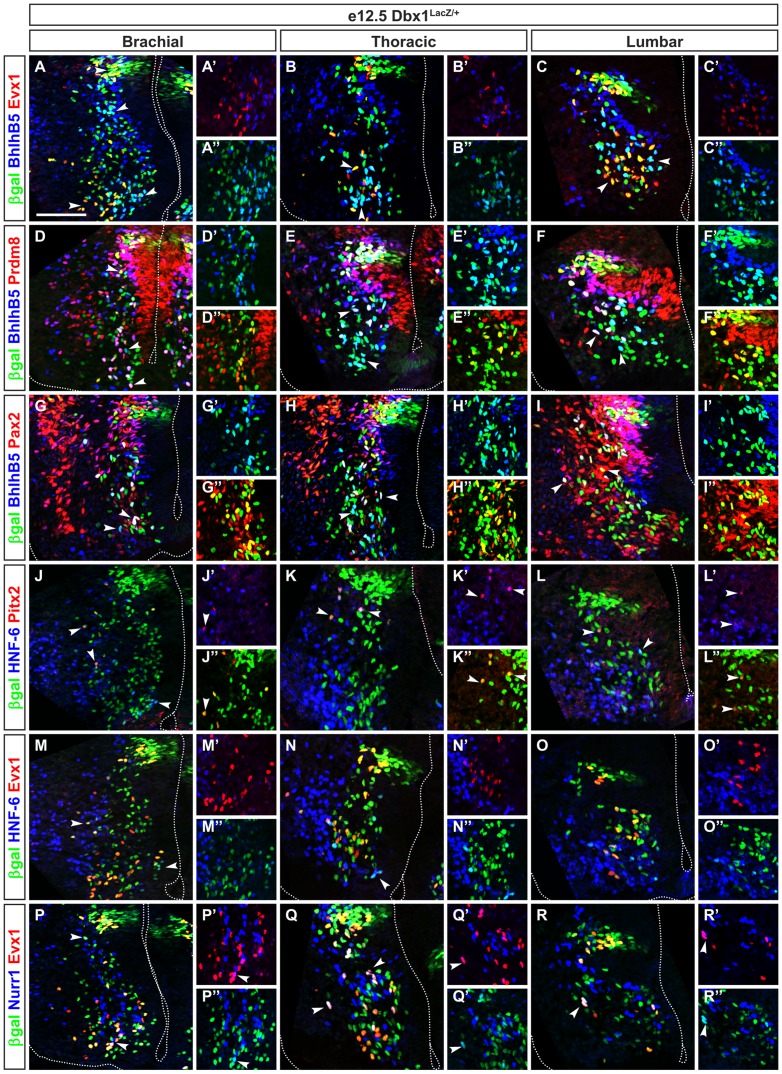
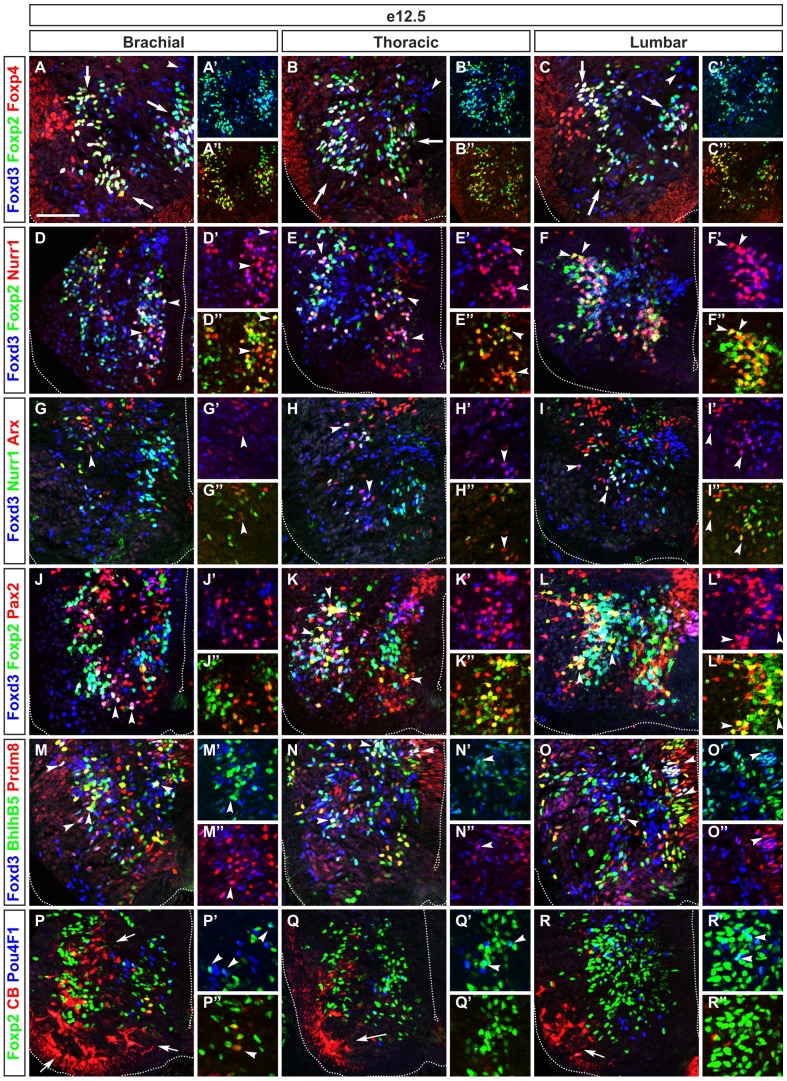
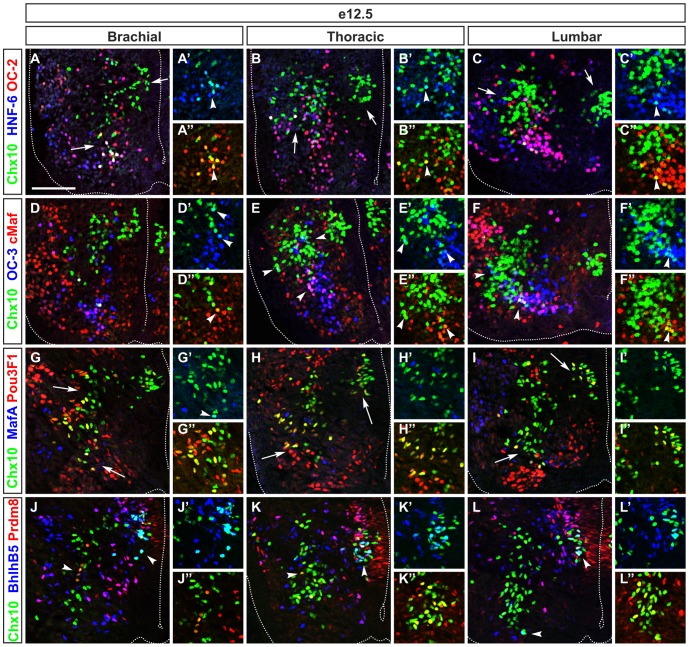
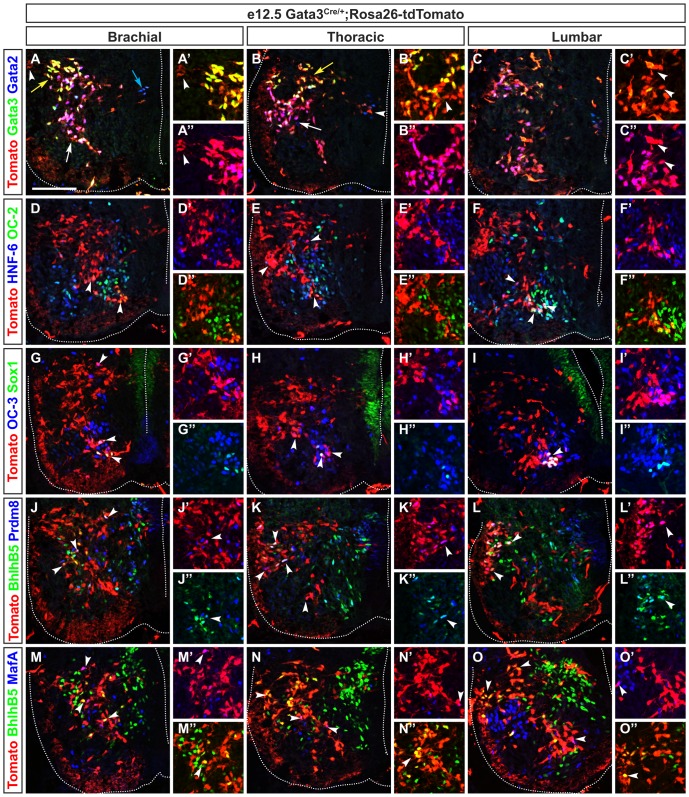
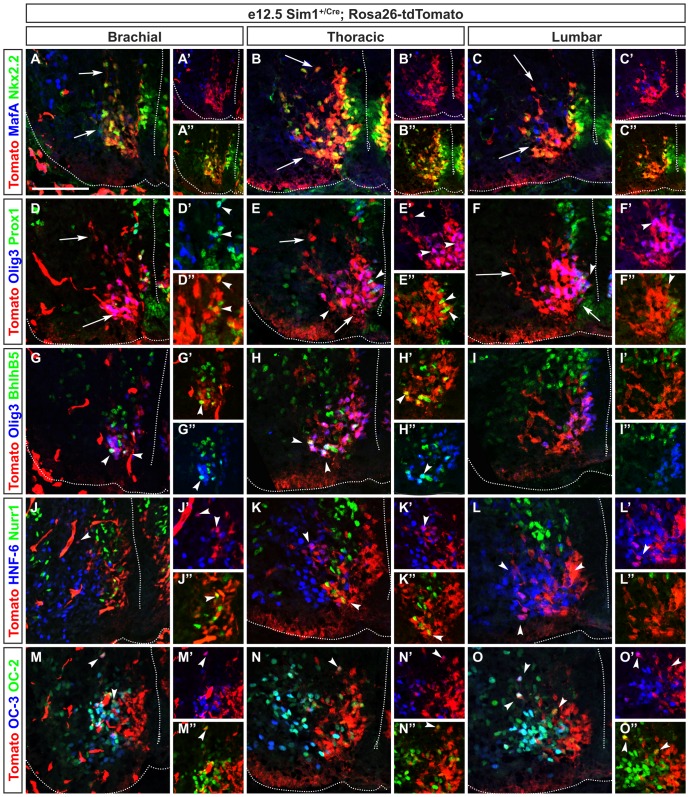
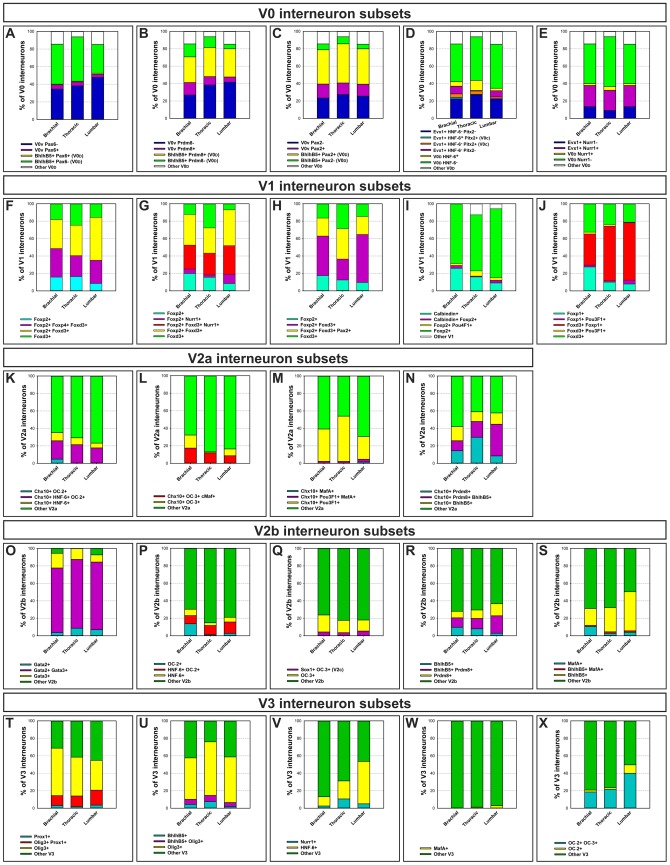
The spinal cord contains neuronal circuits termed Central Pattern Generators (CPGs) that coordinate rhythmic motor activities. CPG circuits consist of motor neurons and multiple interneuron cell types, many of which are derived from four distinct cardinal classes of ventral interneurons, called V0, V1, V2 and V3. While significant progress has been made on elucidating the molecular and genetic mechanisms that control ventral interneuron differentiation, little is known about their distribution along the antero-posterior axis of the spinal cord and their diversification. Here, we report that V0, V1 and V2 interneurons exhibit distinct organizational patterns at brachial, thoracic and lumbar levels of the developing spinal cord. In addition, we demonstrate that each cardinal class of ventral interneurons can be subdivided into several subsets according to the combinatorial expression of different sets of transcription factors, and that these subsets are differentially distributed along the rostrocaudal axis of the spinal cord. This comprehensive molecular profiling of ventral interneurons provides an important resource for investigating neuronal diversification in the developing spinal cord and for understanding the contribution of specific interneuron subsets on CPG circuits and motor control.


Conflict of interest statement

Competing Interests: The authors have declared that no competing interests exist.

Figures

Figure 1
Figure 1. Ventral spinal interneurons are differentially distributed along the rostrocaudal axis of the spinal cord.
Whole mount immunofluorescence labeling of Foxp1 or ventral interneuron markers on whole mount spinal cord of mouse embryo at e12.5. (A–A″) Foxp1 (white) shown as reference to delineate the brachial, thoracic and lumbar regions of the developing spinal cord. (B–B″) Differential distribution of ventral spinal interneurons including V0V (yellow), V1 (blue), V2a (green), V2b (red) and V3 (cyan) at brachial (B), thoracic (B′) or lumbar (B″) levels of the spinal cord. (C–C″) V0 interneurons including V0V (red or yellow) and V0D (green) display distinct distribution pattern at brachial (C), thoracic (C′) or lumbar (C″) levels in Dbx1LacZ/+ embryos. (D–D″) V1 interneurons including Renshaw cells (red or magenta) and V1 non-Renshaw cells that contain Foxp2 (green) or Foxd3 (blue) are differentially distributed at brachial (D), thoracic (D′) or lumbar (D″) along the rostrocaudal axis. (E–E″) V2 interneurons including V2a (blue), V2b (red) and V2c (green) exhibit distinct distribution pattern at brachial (E), thoracic (E′) or lumbar (E″) levels. (F–F″) By contrast, V3 interneurons (white) display relative homogenous distribution, along the rostrocaudal axis of the spinal cord. The white brackets indicate distinct columnar organization within V0, V1 and V2 neurons while white arrowheads show few cells distributed outside V3 neuron column. The white arrow indicates the ventral (v) to dorsal (d) axis. Scale bar = 100 µm.
Figure 2
Figure 2. Homogenous distribution of V0 interneuron subsets along the rostrocaudal axis of the spinal cord.
(A–A″) Immunofluorescence labeling on transverse section at brachial levels of the spinal cord of Dbx1LacZ/+ embryo at e12.5. V0D interneurons contain BhlhB5 (cyan) are intermingled with Evx1+ V0V neurons (yellow or red). Most of V0V cells are located ventrally as indicated by left arrowhead while V0D are homogenously distributed between the vicinity of the V0 progenitor domain and the ventro-medial region of the spinal cord as shown by right arrowhead. (B–B″) At thoracic levels, V0V (yellow or red) amounted less in the ventral territory of V0 interneurons compared to brachial levels (see arrowhead). Conversely, most of V0D in magenta are gathered in this ventral territory as indicated by arrowhead. (C–C″) At lumbar levels, V0V (yellow or red) form a relatively homogenous group located in the ventral territory (left arrowhead), while V0D (cyan) distribute among dorsal, ventro-medial and ventro-lateral territories (right arrowhead). (D–D″) At brachial levels, Prdm8 is detected V0 progenitors and in subsets of V0V (yellow) located close to the central canal (arrowheads). By contrast, Prdm8 is present in a few number of V0D cells (white) as shown by bottom arrowhead. (E–E″) At thoracic levels, Prdm8+ V0V interneurons (yellow) are located close to progenitor domain and in a dorso-ventral direction, while the amount of Prdm8+ V0D (white) is increased (see arrowheads). (F–F″) At lumbar levels, subsets of V0D that are Prdm8+ (white) are located in a dorso-ventral direction between the V0 progenitor domain and V0V neurons (yellow or green) as indicated by arrowheads. (G–G″) At brachial levels, Pax2 is present in a large subset of V0D neurons (white) and in a small subset of V0V neurons (yellow) distributed between the V0 progenitor domain and V0V ventral territory (see arrowheads). (H–I″) The Pax2+ V0 subsets are similarly distributed at thoracic and lumbar levels. (J–J″) At brachial levels, Pitx2 is expressed in V0C interneurons (yellow) which are located laterally to the V0 interneuron migration flux as indicated by arrowheads. A portion of V0C that co-expresses HNF-6 (magenta) is present ventrally (see bottom arrowhead). (K–K″) At thoracic levels, most of V0C express HNF-6 (magenta). V0C are detected laterally to the V0 progenitor domain and dorsally to V0V ventral territory as indicated by arrowheads. (L–L″) At lumbar levels, the amount of V0C (yellow) is reduced compared to brachial or thoracic levels (see left arrowhead). (M–M″) At brachial levels, HNF-6 is detected in a small subset of Evx1+ V0V interneurons (white or magenta) as indicated by left arrowhead and in a subset of V0D (cyan) indicated by right arrowhead. (N–N″) At thoracic levels, HNF-6 is restricted to a few number of V0V (white) and of V0D (cyan) indicated by arrowhead. (O–O″) At lumbar levels, HNF-6 is present in very few Evx1+ cells (white or magenta) or V0D (cyan) neurons compared to brachial or thoracic regions. (P–P″) At brachial levels, Nurr1 expression is detected in a small subset of V0 including V0V (white or magenta) indicated by bottom arrowhead and V0D (cyan) located ventrally, close to the floor plate (see arrowhead in insets). (Q–Q″) At thoracic levels, Nurr1+ subsets of V0V (white or magenta) indicated by arrowheads or of V0D (cyan) are expanded. (R–R″) By contrast, at lumbar levels, Nurr1 expression is only detected in small subsets within V0V (white or magenta) indicated by arrowhead and V0D (cyan). Scale bar = 100 µm.
Figure 3
Figure 3. Differential distribution of V1 interneuron subdivisions along the rostrocaudal axis of the spinal cord.
(A–A″) Immunofluorescence labeling on transverse section at brachial levels of embryonic spinal cord at e12.5 shows that V1 interneurons are subdivided into 3 large subsets (arrows) containing Foxp2 (cyan). Foxp4 is detected in a portion of these Foxp2+ V1 neurons (white). (B–B″) At thoracic levels, Foxd3+ V1 neurons form 2 groups (arrows) that contain Foxp2 (in green/cyan) and Foxp4 (in red/white). (C–C″) At lumbar levels, V1 interneurons distribute among 3 groups (arrows) and the ratio between Foxp2+ neurons and Foxp4+/Foxd3+ cells decreased compared to brachial or thoracic levels. (D–D″) At brachial levels, Nurr1 is detected in subsets (arrowheads) within 2 large V1 groups containing Foxp2 (yellow). (E–E″) At thoracic levels, Nurr1+ subsets (white) are intermingled with Foxp2+ group (cyan and green) close to the central canal and/or (in/with Foxp2+ group close) to motor neurons as indicated by arrowheads. (F–F″) At lumbar levels, Nurr1+ subsets are included in 2 groups of V1 that contain Foxp2 (yellow) indicated by arrowheads or Foxd3 and Foxp2 (white). (G–G″) At brachial levels, Arx is present in a few number of Foxd3+ V1 neurons (magenta) as indicated by arrowhead. (H–I″) By contrast, at thoracic and lumbar levels, Arx is observed in subsets of Foxd3+ (magenta) and of Foxd3+/Nurr1+ (white) V1 neurons (arrowheads). (J–J″) At brachial levels, Pax2 expression defines subsets in Foxd3+ (magenta) and in Foxp2+/Foxd3+ (white) V1 interneurons (arrowheads). (K–K″) At thoracic levels, Pax2 is distributed in Foxd3+ (magenta), Foxd3+/Foxp2+ (white) and Foxp2+ subsets (yellow) as indicated by arrowheads. (L–L″) At lumbar levels, Pax2+ subsets (yellow or white) are located within V1 containing Foxp2 located medially or close to motor neurons (arrowheads). (M–M″) At brachial levels, BhlhB5 is detected in subsets of Foxd3+ V1 neurons (cyan) located close to the central canal or to motor neurons. Prdm8 is present in small subsets of V1 neurons located close to V1 progenitor domain or more ventrally, close to motor neurons. A small subset of V1 that co-express BhlhB5 and Prdm8 (white) is observed in the vicinity of the motor neurons (arrowheads). (N–N″) At thoracic levels, the amount of V1 neurons that contain BhlhB5 (cyan), or BhlhB5 and Prdm8 (white) indicated by arrowheads, is increased while a few number of Prdm8+ V1 cells is detected. (O–O″) At lumbar levels, the amount of cells corresponding to Prdm8+ (magenta) or BhlhB5+ V1 neurons (cyan) decreases while BhlhB5+/Prdm8+ co-expressing V1 (white) indicated by arrowheads, increase compared to the thoracic region. (P–P″) At brachial levels, Pou4F1 is present in a few Foxp2+ V1 neurons (cyan) indicated by arrowheads. Renshaw cells (red) are distributed in 3 groups (arrows) with very few containing Foxp2 (yellow) indicated by arrowhead. (Q–Q″) At thoracic levels, the amount of Renshaw cells (red) decreases (arrow) while Foxp2+ V1 expressing Pou4F1 (cyan) slightly increases (arrowheads). (R–R″) At lumbar levels, similar to thoracic levels, the amount of Renshaw cells (red) decreases (arrow) but Pou4F1+ subset (cyan) is detected dorsally, close to motor neurons (arrowheads). Scale bar = 100 µm.
Figure 4
Figure 4. V2a interneurons subdivisions are differentially distributed along the rostrocaudal axis of the spinal cord.
(A–A″) Immunofluorescence labeling on transverse section at brachial levels of e12.5 embryonic spinal cord shows that V2a interneurons subdivide into medial and lateral groups (arrows). Lateral group comprise small ventral subsets (arrowhead) that contain HNF-6 (cyan), OC-2 (yellow) or HNF-6 and OC-2 (white). (B–B″) At thoracic levels, OC-2+ subset (yellow) is absent, but HNF-6+/OC-2+ subset (white) is detected dorsally to motor neurons (arrowhead) while the HNF-6+ subset (cyan) is expanded in lateral group (left arrow). (C–C″) At lumbar levels, the amount of HNF-6+/OC-2+ (white) indicated by arrowhead or of HNF-6+ V2a neurons (cyan) decreases at lateral group (left arrow). (D–D″) At brachial levels, a ventral subset of V2a contains cMaf and OC-3 (white), while OC-3 is present in subsets of V2a (cyan) located laterally to newly-born V2a interneurons (arrowheads). (E–E″) At thoracic levels, V2a that contain OC-3 (in cyan) are less numerous while cMaf+/OC-3+ subset (white) located ventrally is still present (arrowheads). (F–F″) At lumbar levels, the amount of V2a containing OC-3 (cyan) is increased (left arrowhead) and this subset is located dorsally to the cMaf+/OC-3+ division (white) as indicated by bottom arrowheads. (G–G″) At brachial levels, Pou3F1 defines a large subset of V2a (yellow) located laterally and another one close to the newly-born V2a interneurons (arrows). MafA is detected in a few V2a cells that co-express Pou3F1 (white) as indicated by arrowhead. (H–H″) At thoracic levels, Pou3F1 is detected in majority of V2a interneurons (arrows) whereas MafA remains restricted to a few cells. (I–I″) At lumbar levels, Pou3F1 is present in a subset of V2a (yellow) located ventrally and close to motor neurons (arrow). MafA define a small subset of V2a that co-express Pou3F1 (white) and is located more ventrally, close to the floor plate (arrow). (J–J″) At brachial levels, BhlhB5 define a subset of newly-born V2a interneurons (cyan) indicated by right arrowhead while Prdm8 is detected in another subset (yellow) located in the dorso-ventral flux of V2a interneurons as shown by left arrowhead. Prdm8 and BhlhB5 (white) are detected in a few V2a close to the central canal. (K–K″) At thoracic levels, this population is expanded (arrowheads). (L–L″) At lumbar levels, BhlhB5 is detected in subsets of V2a interneurons including newly-born V2a (cyan) and V2a in the dorso-ventral flux (arrowheads). Prdm8 is also detected in subsets within the dorso-ventral flux and in newly-born V2a (yellow) and is present in some BhlhB5+ V2a (white). Scale bar = 100 µm.
Figure 5
Figure 5. Differential distribution of V2b interneuron subdivisions along the rostrocaudal axis of the spinal cord.
Immunofluorescence labeling on transverse section at brachial levels of the spinal cord of Gata3Cre/+Rosa26floxstop-tdTomato embryo at e12.5. (A–A″) V2b interneurons subdivide into a dorsal subset that contains high levels of Gata3 (yellow) indicated by yellow arrow, a ventral subset that contains Gata2 (magenta) indicated by white arrow and a subset of newly-born V2b wherein high Gata2 and low Gata3 levels are detected (blue arrow). (B–B″) At thoracic levels, low content in Gata2 (blue) is detected in a dorsal Gata3+ subset (yellow) indicated by yellow arrow while low content in Gata3 is detected in the Gata2+ subset (white) located ventrally (white arrow). (C–C″) At lumbar levels, Gata2 and Gata3 are present in a dorsal and in a ventral subset of V2b interneurons (white). (D–D″) At brachial levels, HNF-6 or OC-2 are present (magenta or yellow) or co-detected (white) in subsets of V2b interneurons (arrowheads). (E–E″) Similarly, at thoracic levels, HNF-6 and OC-2 are co-detected in a ventral subset of V2b interneurons (white) as indicated by bottom arrowhead. OC-2 is present in a few V2b (yellow) while HNF-6 defines a small lateral subset (magenta) indicated by left and top arrowheads. (F–F″) At lumbar levels, HNF-6 and OC-2 are also co-detected in a ventral subset of V2b interneurons (white) indicated by bottom arrowheads while OC-2 (yellow) or HNF-6 (magenta) alone defines small subsets of V2b (left arrowhead). (G–G″) At brachial levels, OC-3 is present in all V2c interneurons (bottom arrowheads), which contain Sox1 (white), and in a subset of V2b (magenta) located dorsally to V2c neurons. (H–I″) Similarly, at thoracic and lumbar levels, all V2c are OC-3+ (white) and OC-3 is also present in another subset of V2b cells (arrowheads). (J–J″) At brachial levels, BhlhB5 defines a subset of V2b (yellow) close to motor neurons (left arrowhead). BhlhB5 and Prdm8 are co-detected in a few of these cells (white) as indicated by top arrowheads. (K–K″) At thoracic levels, BhlhB5 and Prdm8 are present in a subset of V2b (white) located dorsally to the motor neurons (left arrowheads). In addition, Prdm8 is detected in a small subset of V2b (magenta), which is located dorsally to BhlhB5+/Prdm8+ V2b subset (left and bottom arrowheads). (L–L″) At lumbar levels, BhlhB5 and Prdm8 are present in a subset of V2b (white) located dorsally to the motor neurons (top arrowhead). Similarly to thoracic levels, Prdm8 is observed in subset of V2b (magenta) laterally and close to BhlhB5+/Prdm8+ subset of V2b interneurons (bottom arrowhead). (M–M″) At brachial levels, MafA is detected in a small subset of V2b (magenta) indicated by top arrowhead whereas BhlhB5 defines another subset of V2b (yellow) indicated by arrowheads. (N–N″) At thoracic levels, the amount of V2b neurons that are MafA+ (magenta) is decreased (right arrowhead) compared to brachial levels. V2b subset expressing BhlhB5 (yellow) is detected dorsally to the motor neurons (left arrowheads). (O–O″) At lumbar levels, fewer MafA+ V2b cells (magenta) are observed than at brachial or thoracic levels (right arrowhead) while BhlhB5+ V2b subset (yellow) is located dorsally to the motor neurons and close to the basal lamina (left arrowheads). Scale bar = 100 µm.
Figure 6
Figure 6. V3 interneuron subsets are differentially distributed along the rostrocaudal axis of the spinal cord.
Immunofluorescence labeling on transverse section at brachial levels of the spinal cord of Sim1Cre/+;Rosa26floxstop-tdTomato embryo at e12.5. (A–A″) All the V3 interneurons contain Nkx2.2 (yellow) and subdivide in 2 groups (arrows), while MafA (magenta) is present in a few V3 cells. (B–B″) At thoracic levels, a majority of V3 neurons are labeled for Nkx2.2 (yellow) and very few of them contain MafA (white). (C–C″) Similarly, at lumbar levels, almost all V3 neurons (in red) are labeled for Nkx2.2 (yellow) and MafA define a very small subset of V3 neurons (white or magenta), located close to the floor plate. (D–D″) At brachial levels, a majority of V3 neurons located ventrally, possibly corresponding to V3V, contain Olig3 (magenta) indicated by bottom arrow. In contrast, Prox1 is detected in very few V3 neurons (yellow or white) indicated by arrowheads. (E–E″) At thoracic levels, a large subset of V3 neurons located ventrally is defined by Olig3 (magenta) indicated by bottom arrow, a part of them containing Prox1 (white) indicated by right arrowhead. (F–F″) At lumbar levels, Olig3 is detected in more ventral V3 neurons (magenta) indicated by right arrow but not in V3 cells that migrate more dorsally indicated by left arrow, possibly corresponding to V3D. Prox1 is present in some V3V neurons (yellow or white) as shown by arrowhead. (G–G″) At brachial levels, BhlhB5 is detected in some V3V Olig3+ neurons (white) indicated by arrowheads. (H–H″) At thoracic levels, the amount of V3V neurons that contain BhlhB5 (white) is increased (arrowheads). (I–I″) At lumbar levels, BhlhB5 is detected neither in V3V nor V3D. (J–J″) At brachial levels, HNF-6 is detected in migrating V3D neurons (magenta) indicated by arrowhead while Nurr1 is present in very few V3V neurons (yellow). (K–K″) Similarly, at thoracic levels, HNF-6 is observed in migrating V3D neurons (magenta) indicated by left arrowhead whereas Nurr1 is present in a small subset of V3V neurons (yellow) indicated by right arrowhead. (L–L″) At lumbar levels, HNF-6 is detected in migrating V3D neurons (magenta) indicated by left arrowheads while Nurr1 is absent from V3 neurons (see right arrow). (M–M″) At brachial levels, OC-2 and OC-3 are co-detected in all V3D neurons (white) indicated by top arrowhead while a few V3V are labeled for OC-2 only (yellow) as indicated by bottom arrowhead. (N–N″) Similarly, at thoracic levels, OC-2 and OC-3 are present in all V3D neurons (white) indicated by arrowhead while OC-2 alone is detected in a small subset of V3V (yellow). (O–O″) At lumbar levels, a large subset of V3D contain OC-2 and OC-3 (white) indicated by top arrowheads, but OC-2 is also present in subsets of V3D and V3V neurons (yellow) as shown by right arrowhead. Scale bar = 100 µm.
Figure 7
Figure 7. Quantification of ventral interneuron subsets along the anterposterior axis of the spinal cord.
(A–X) Histograms of quantification of V0, V1, V2a, V2b and V3 interneuron subsets at brachial, thoracic and lumbar levels of the spinal cord of mouse embryos at e12.5 show distinct distribution and proportion of different subsets within each interneuron cardinal classes. Histograms are normalized according to the total amount of cells in each ventral IN population, which corresponds to 100% (n = 3).

Similar articles

Cited by

References

    1. Berkowitz A (2001) Rhythmicity of spinal neurons activated during each form of fictive scratching in spinal turtles. Journal of neurophysiology 86: 1026–1036. - PubMed
    1. Cazalets JR (2000) Organization of the spinal locomotor network in neonatal rat. In: Inc Hp, editor. Neurobiology of spinal cord injury: R. Kalb and S.M. Stritmatter. pp. 89–111.
    1. Kjaerulff O, Kiehn O (1996) Distribution of networks generating and coordinating locomotor activity in the neonatal rat spinal cord in vitro: a lesion study. J Neurosci 16: 5777–5794. - PMC - PubMed
    1. Cazalets JR, Borde M, Clarac F (1995) Localization and organization of the central pattern generator for hindlimb locomotion in newborn rat. J Neurosci 15: 4943–4951. - PMC - PubMed
    1. Armstrong DM (1986) Supraspinal contributions to the initiation and control of locomotion in the cat. Progress in neurobiology 26: 273–361. - PubMed

Publication types

LinkOut - more resources