. 2013 Aug 14;8(8):e71207.
doi: 10.1371/journal.pone.0071207. eCollection 2013.

Beneficial impact of CCL2 and CCL12 neutralization on experimental malignant pleural effusion

Affiliations

Beneficial impact of CCL2 and CCL12 neutralization on experimental malignant pleural effusion

Antonia Marazioti et al. PLoS One. .

Abstract

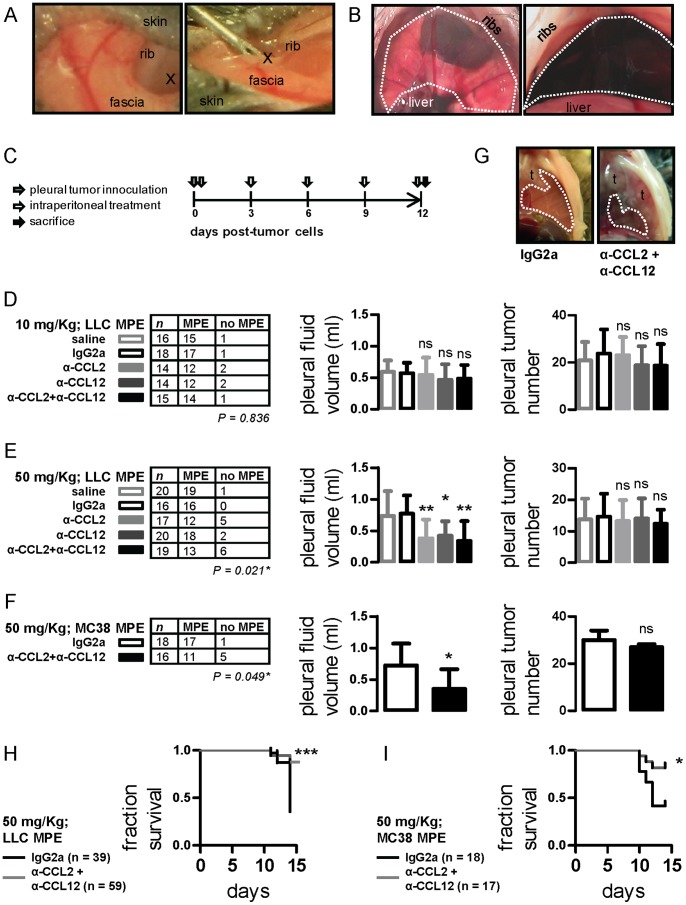
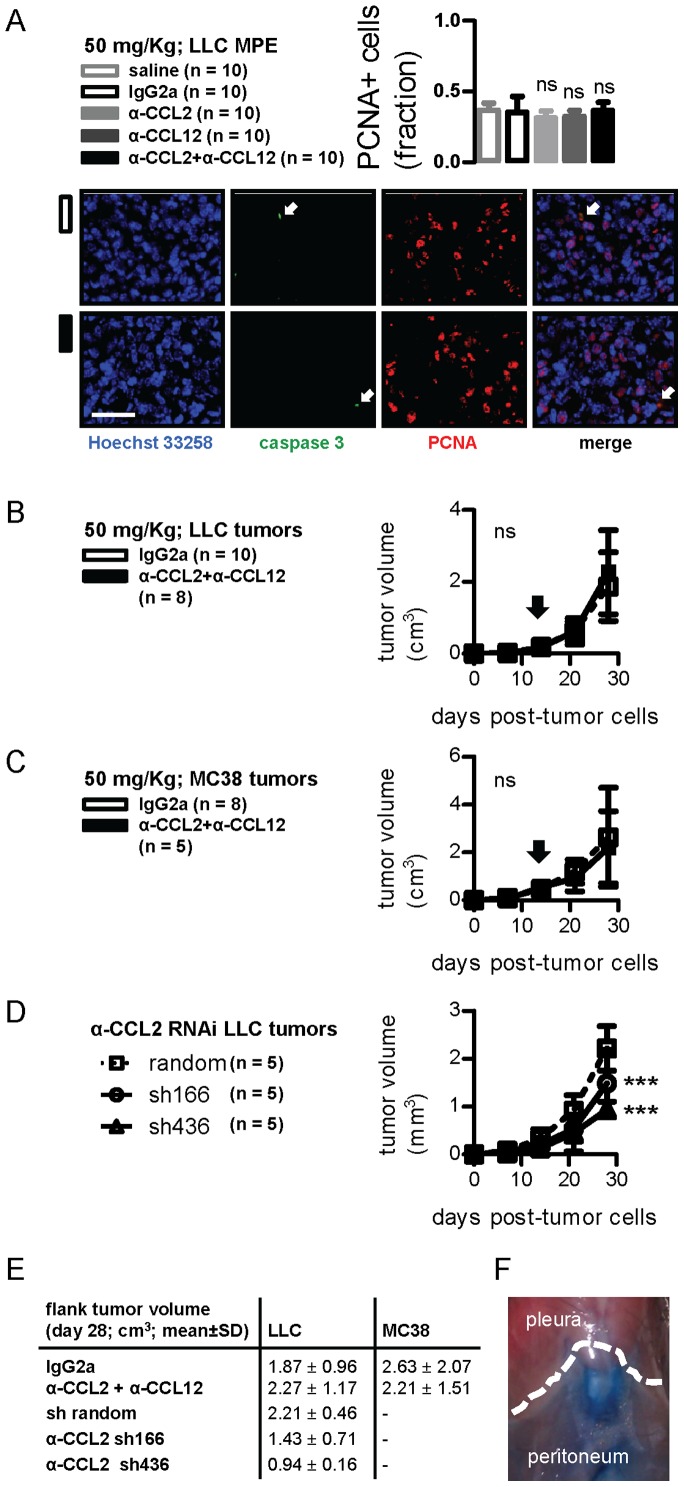
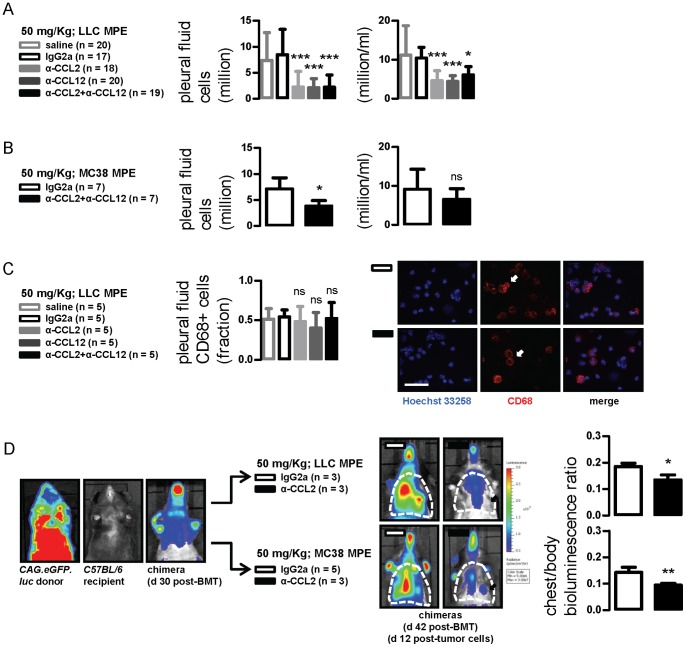
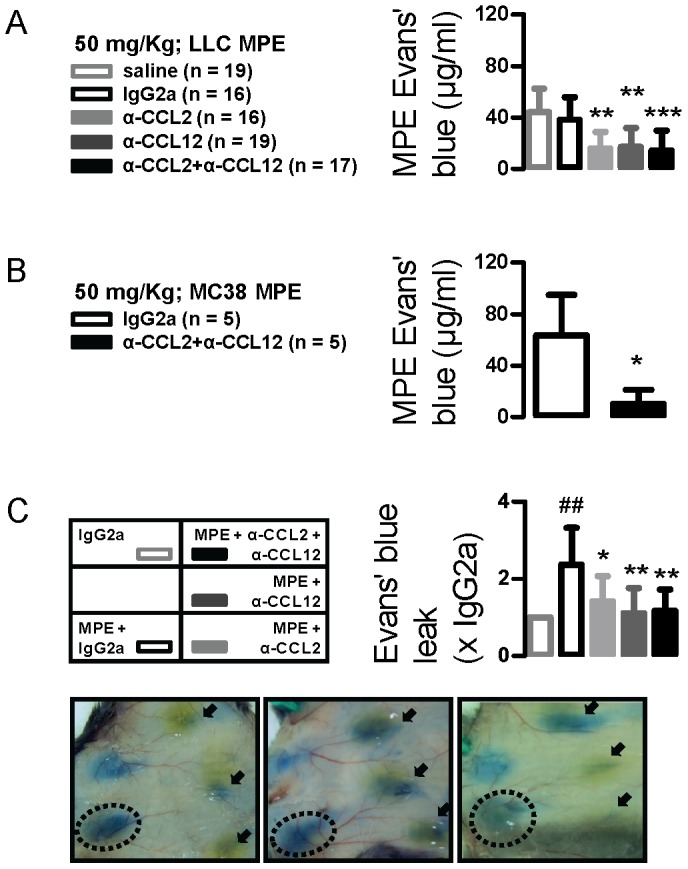
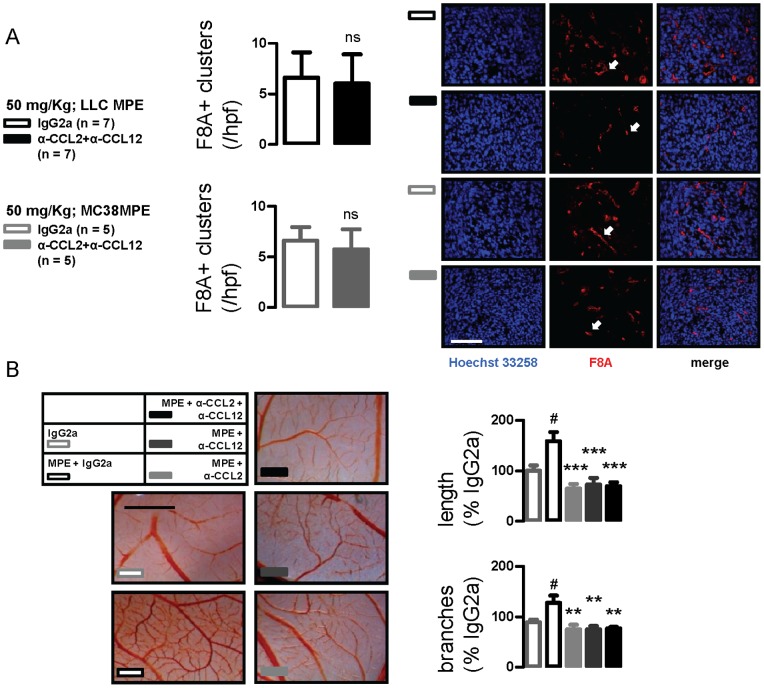
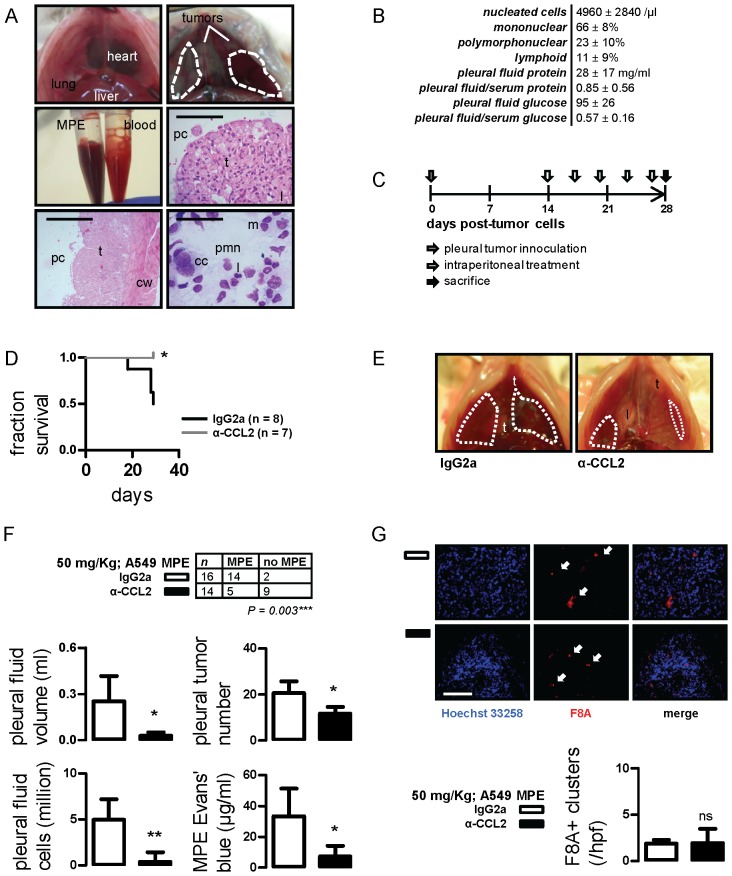
Using genetic interventions, we previously determined that C-C motif chemokine ligand 2 (CCL2) promotes malignant pleural effusion (MPE) formation in mice. Here we conducted preclinical studies aimed at assessing the specific therapeutic potential of antibody-mediated CCL2 blockade against MPE. For this, murine MPEs or skin tumors were generated in C57BL/6 mice by intrapleural or subcutaneous delivery of lung (LLC) or colon (MC38) adenocarcinoma cells. Human lung adenocarcinoma cells (A549) were used to induce MPEs in severe combined immunodeficient mice. Intraperitoneal antibodies neutralizing mouse CCL2 and/or CCL12, a murine CCL2 ortholog, were administered at 10 or 50 mg/kg every three days. We found that high doses of CCL2/12 neutralizing antibody treatment (50 mg/kg) were required to limit MPE formation by LLC cells. CCL2 and CCL12 blockade were equally potent inhibitors of MPE development by LLC cells. Combined CCL2 and CCL12 neutralization was also effective against MC38-induced MPE and prolonged the survival of mice in both syngeneic models. Mouse-specific CCL2-blockade limited A549-caused xenogeneic MPE, indicating that host-derived CCL2 also contributes to MPE precipitation in mice. The impact of CCL2/12 antagonism was associated with inhibition of immune and vascular MPE-related phenomena, such as inflammation, new blood vessel assembly and plasma extravasation into the pleural space. We conclude that CCL2 and CCL12 blockade are effective against experimental MPE induced by murine and human adenocarcinoma in mice. These results suggest that CCL2-targeted therapies may hold promise for future use against human MPE.


Conflict of interest statement

Competing Interests: Linda A. Snyder is an employee of Janssen R&D, LLC, the manufacturer of the antibodies used in these studies. The remaining authors declare no conflict of interest. The study was undertaken in the academic environment and was controlled solely by the senior author. Moreover, the other authors have no financial or other conflict of interest with the study matter. This does not alter the authors' adherence to all the PLOS ONE policies on sharing data and materials.

Figures

Figure 1
Figure 1. Impact of anti-CCL2 and/or anti-CCL12 monoclonal antibody treatment on syngeneic models of malignant pleural effusion (MPE).
(A) Photographs of intrapleural injection technique (x indicates the injection site). (B) Transdiaphragmatic photograph of mouse pleural space before (left) and four hours after (right) intrapleural Evans’ blue delivery. The dashed lines indicate the pleural confines. (C) Graphical outline of in vivo experiments. C57BL/6 mice received intrapleural Lewis lung carcinoma (LLC) or MC38 colon adenocarcinoma cells (grey arrow) followed by intraperitoneal treatment with normal saline, IgG2a, anti-CCL2, anti-CCL12, or anti-CCL2 plus anti-CCL12 every three days (white arrows). Mice were terminated after 12 days (black arrow). Primary end-points were MPE incidence and volume. Secondary end-points were pleural tumor number and survival. (D) MPE incidence (left), volume (middle), and pleural tumor number (right) of mice with LLC-induced MPE after regular-dosed antibody treatment. (E) MPE incidence (left), volume (middle), and pleural tumor number (right) of mice with LLC-induced MPE after high-dose antibody treatment. (F) MPE incidence (left), volume (middle), and pleural tumor number (right) of mice with MC38-induced MPE treated with high-dose IgG2a control or anti-CCL2/12 combination regimen. (G) Transdiaphragmatic photographs of representative MC38-induced MPEs from an IgG2a and an anti-CCL2/12 combination-treated mouse. Dashed lines outline MPEs and t designates pleural tumors. (H,I) Fractional survival of mice with LLC- and MC38-induced MPE. Columns, mean; bars, SD; n, sample size; P, probability by χ2 test; ns, *, **, ***: P>0.05, P<0.05, P<0.01, and P<0.001 compared with saline and/or IgG2a control.
Figure 2
Figure 2. CCL2 and/or CCL12 blockade impact on tumor growth.
(A) Pleural tumors from mice with LLC-induced MPE treated as in Figure 1A were stained with Hoechst 33258, anti-Caspase-3, and PCNA antibodies. Shown are summary of data for PCNA staining (left) and representative images from pleural tumors of an IgG2a and a combination-treated mouse (right). Scale bar = 100 µm, Å = 400. Arrows indicate rare caspase-3 positive cells. (B,C) Volume of flank tumors induced by subcutaneous injection of LLC and MC38 cells after treatment with IgG2a control or anti-CCL2/CCL12 combination therapy. Arrows indicate the day of antibody therapy start. (D) Volume of flank tumors induced by subcutaneous injection of LLC cells stably expressing random or anti-CCL2-specific shRNAs (sh166 and sh436). (E) Tumor volumes from flank tumor experiments at four weeks. (F) Photograph of mouse thoracic-abdominal border (dashed line) four hours after intraperitoneal Evans’ blue delivery. Columns and squares, mean; bars, SD; n, sample size; ns and ***, P>0.05 and P<0.001 compared with saline and/or IgG2a or random shRNA controls.
Figure 3
Figure 3. CCL2 and/or CCL12 neutralization limits MPE-associated inflammation.
(A, B) Pleural fluid nucleated cells from mice with LLC- and MC38-induced MPE treated as in Figure 1. (C) Results of staining of pleural cells from LLC-induced MPEs for CD68. (D) Representative bioluminescent-photographic image overlays (left) and summary of data obtained from C57BL/6 mice adoptively transplanted with labeled bone marrow obtained from CAG.luc.eGFP-donors. In this model that can be used to monitor inflammation, bioluminescence stems exclusively from alien bone marrow transplants. Chimeric mice were imaged for light emission before and after MPE induction followed by IgG2a or anti-CCL2/12 combination treatment. Increased thoracic (dashed outlines) bioluminescence was observed after MPE induction, reflecting the inflammatory response that develops with MPE. The phenomenon was markedly inhibited in mice treated with anti-CCL2/12 antibody combination (arrows). Columns, mean; bars, SD; n, sample size; ns, *, **, and ***: P>0.05, P<0.05, P<0.01, and P<0.001 compared with saline and/or IgG2a control.
Figure 4
Figure 4. CCL2 and/or CCL12 neutralization inhibits MPE-precipitating vascular hyperpermeability.
(A,B) Pleural fluid Evans’ blue levels from mice with LLC- and MC38-induced MPE treated as in Figure 1A. Mice received intravenous Evans’ blue before sacrifice, followed by quantification of the albumin tracer in MPE. *, ** and ***: P<0.05, P<0.01, and P<0.001 compared with saline and/or IgG2a. (C) Summary of data (n = 5) and photographs of representative skin test sites from C57BL/6 mice that received intradermal injections of IgG2a or cell-free MPE fluid admixed with IgG2a or anti-CCL2/12 antibodies, followed immediately by intravenous delivery of Evans’ blue. Mice were euthanized after one hour, followed by skin inversion and imaging. Shown is test spot area relative to the control test spot on the same mouse. ##: P<0.01 compared with IgG2a; * and **: P<0.05 and P<0.01 compared with MPE. Columns, mean; bars, SD; n, sample size.
Figure 5
Figure 5. CCL2 and/or CCL12 neutralization impacts new vessel assembly in pleural tumors.
(A) Microvessel density of pleural tumors from mice with LLC- and MC38-induced MPE treated with IgG2a or anti-CCL2/12 combination as in Figure 1A. Shown is summary of data and representative images of factor-VIII-associated protein (F8A) immunoreactivity. Scale bar = 100 µm; Å = 400. Arrows indicate new vessels. (B) Representative chorioallantoic membranes and summary of data obtained from six membranes/group that were incubated with IgG2a or cell-free MPE fluid admixed with IgG2a or anti-CCL2/12 antibodies. Scale bar = 5 mm. Columns, mean; bars, SD; n, sample size; ns: P>0.05; #: P<0.05 compared with IgG2a; *, **, and ***, P<0.05, P<0.01, and P<0.001 compared with MPE.
Figure 6
Figure 6. CCL2 blockade limits MPE induced by A549 human lung adenocarcinoma.
(A) Development of a novel model of MPE induced by A549 cells. Shown are transdiaphragmatic photographs of SCID mouse indicating the normal anatomy (top left) and SCID mouse with A549-induced MPE (top right; dashed lines); retrieved MPE and blood samples (middle left); hematoxylin & eosin-stained visceral (middle right; scale bars = 400 µm; Å = 100) and parietal (bottom left; scale bars = 800 µm; Å = 50) pleural tumor tissue sections indicating the pleural cavity (pc), tumors (t), lung (l) and the chest wall (cw); and May-Gruenwald-Giemsa-stained pleural fluid cell cytocentrifugal specimen (scale bar = 100 µm; Å = 400) showing a mixture of cancer (cc), mononuclear (m), polymorphonuclear (pmn), and lymphoid (l) cells (bottom right). (B) Cellular and biochemical composition of A549-induced MPE in SCID mice (values given represent mean ± SD; n = 10). (C) Experimental set-up of host-directed anti-CCL2 trial using the xenogeneic A549/SCID MPE model. (D) Kaplan-Meier survival curve of SCID mice after intrapleural delivery of A549 cells followed by IgG2a or anti-CCL2 antibody treatment. (E,F) Representative transdiaphragmatic photographs and experimental end-points of A549/SCID MPE trial. Dashed lines outline MPEs; t, tumor; l, lung. (G) Summary of data and representative images of F8A-stained pleural tumors from the A549/SCID MPE model. Scale bar = 100 µm; Å = 400. Arrows indicate new vessels. Columns, mean; bars, SD; n, sample size; P, probability; ns, *, and **: P>0.05, P<0.05, and P<0.01 compared with IgG2a.

Similar articles

  • Host-derived interleukin-5 promotes adenocarcinoma-induced malignant pleural effusion.
    Stathopoulos GT, Sherrill TP, Karabela SP, Goleniewska K, Kalomenidis I, Roussos C, Fingleton B, Yull FE, Peebles RS Jr, Blackwell TS. Stathopoulos GT, et al. Am J Respir Crit Care Med. 2010 Nov 15;182(10):1273-81. doi: 10.1164/rccm.201001-0001OC. Epub 2010 Jul 1. Am J Respir Crit Care Med. 2010. PMID: 20595227 Free PMC article.
  • Tumor necrosis factor-alpha promotes malignant pleural effusion.
    Stathopoulos GT, Kollintza A, Moschos C, Psallidas I, Sherrill TP, Pitsinos EN, Vassiliou S, Karatza M, Papiris SA, Graf D, Orphanidou D, Light RW, Roussos C, Blackwell TS, Kalomenidis I. Stathopoulos GT, et al. Cancer Res. 2007 Oct 15;67(20):9825-34. doi: 10.1158/0008-5472.CAN-07-1064. Cancer Res. 2007. PMID: 17942913
  • Mast cells mediate malignant pleural effusion formation.
    Giannou AD, Marazioti A, Spella M, Kanellakis NI, Apostolopoulou H, Psallidas I, Prijovich ZM, Vreka M, Zazara DE, Lilis I, Papaleonidopoulos V, Kairi CA, Patmanidi AL, Giopanou I, Spiropoulou N, Harokopos V, Aidinis V, Spyratos D, Teliousi S, Papadaki H, Taraviras S, Snyder LA, Eickelberg O, Kardamakis D, Iwakura Y, Feyerabend TB, Rodewald HR, Kalomenidis I, Blackwell TS, Agalioti T, Stathopoulos GT. Giannou AD, et al. J Clin Invest. 2015 Jun;125(6):2317-34. doi: 10.1172/JCI79840. Epub 2015 Apr 27. J Clin Invest. 2015. PMID: 25915587 Free PMC article.
  • Malignant pleural effusion: tumor-host interactions unleashed.
    Stathopoulos GT, Kalomenidis I. Stathopoulos GT, et al. Am J Respir Crit Care Med. 2012 Sep 15;186(6):487-92. doi: 10.1164/rccm.201203-0465PP. Epub 2012 May 31. Am J Respir Crit Care Med. 2012. PMID: 22652027 Free PMC article. Review.
  • Animal models of malignant pleural effusion.
    Stathopoulos GT, Kalomenidis I. Stathopoulos GT, et al. Curr Opin Pulm Med. 2009 Jul;15(4):343-52. doi: 10.1097/MCP.0b013e32832af07c. Curr Opin Pulm Med. 2009. PMID: 19387350 Review.

Cited by

References

    1. Maskell NA (2012) Treatment options for malignant pleural effusions: patient preference does matter. JAMA 307: 2432–2433. - PubMed
    1. Wu SG, Yu CJ, Tsai MF, Liao WY, Yang CH, et al... (2012) Survival of lung adenocarcinoma patients with malignant pleural effusion. Eur Respir J, In press. - PubMed
    1. Burgers JA, Kunst PW, Koolen MG, Willems LN, Burgers JS, et al. (2008) Pleural drainage and pleurodesis: implementation of guidelines in four hospitals. Eur Respir J 32: 1321–1327. - PubMed
    1. Puri V, Pyrdeck TL, Crabtree TD, Kreisel D, Krupnick AS, et al. (2012) Treatment of malignant pleural effusion: a cost-effectiveness analysis. Ann Thorac Surg 94: 374–379. - PMC - PubMed
    1. Davies HE, Mishra EK, Kahan BC, Wrightson JM, Stanton AE, et al. (2012) Effect of an indwelling pleural catheter vs chest tube and talc pleurodesis for relieving dyspnea in patients with malignant pleural effusion: the TIME2 randomized controlled trial. JAMA 307: 2383–2389. - PubMed

Publication types

MeSH terms

LinkOut - more resources