. 2013 Aug 15;8(8):e72134.
doi: 10.1371/journal.pone.0072134. eCollection 2013.

Reciprocal activation of transcription factors underlies the dichotomy between proliferation and invasion of glioma cells

Affiliations

Reciprocal activation of transcription factors underlies the dichotomy between proliferation and invasion of glioma cells

Harshil D Dhruv et al. PLoS One. .

Abstract

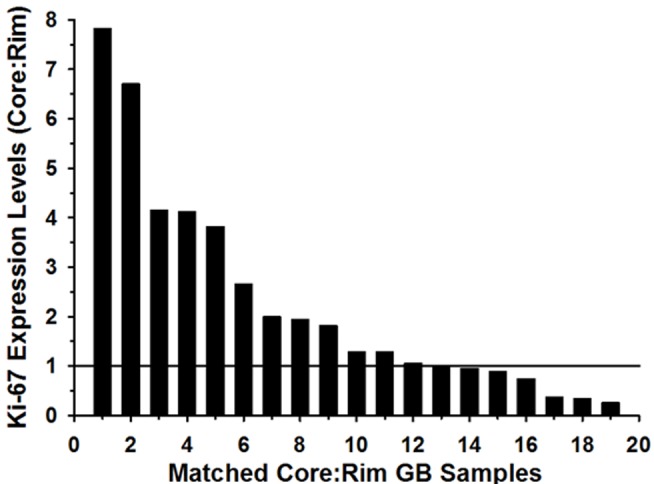
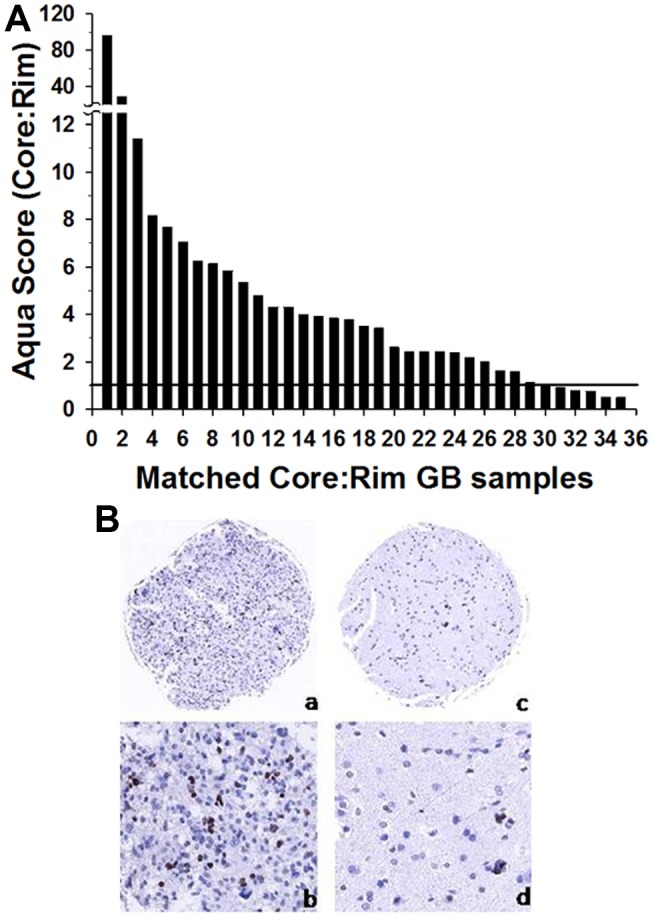
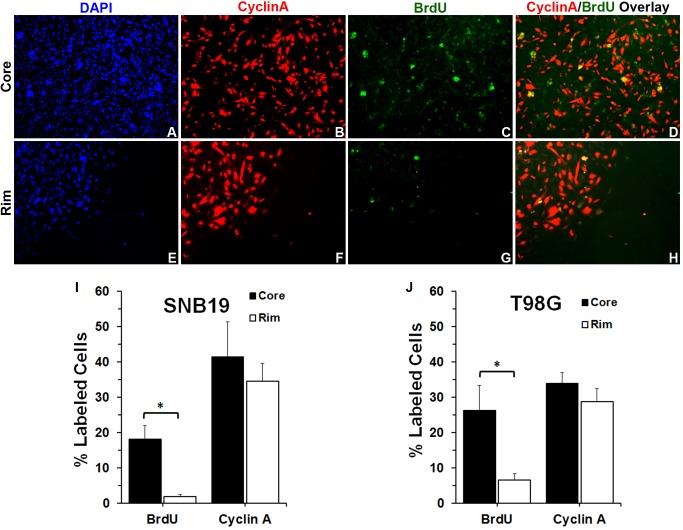
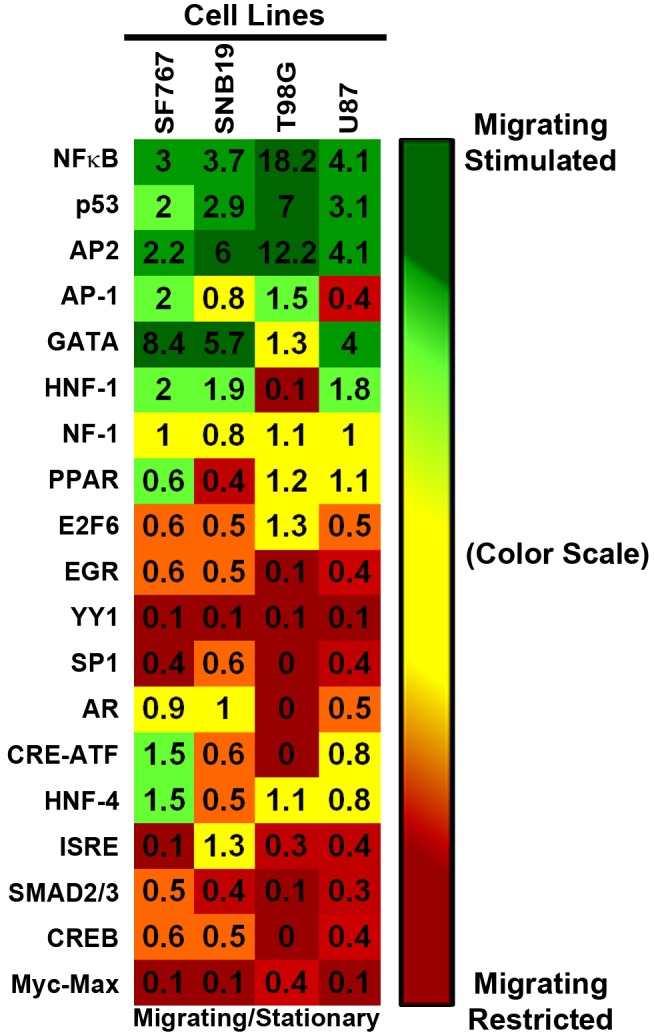
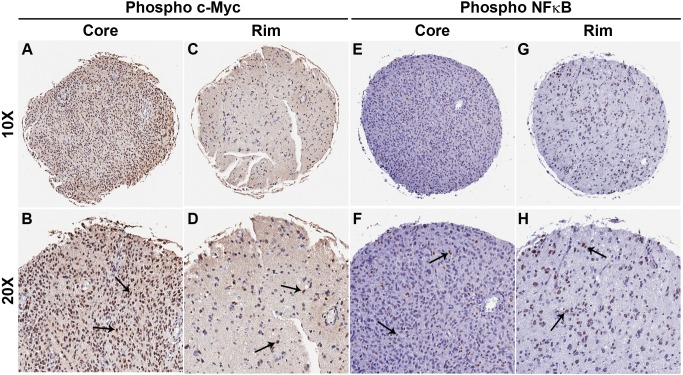
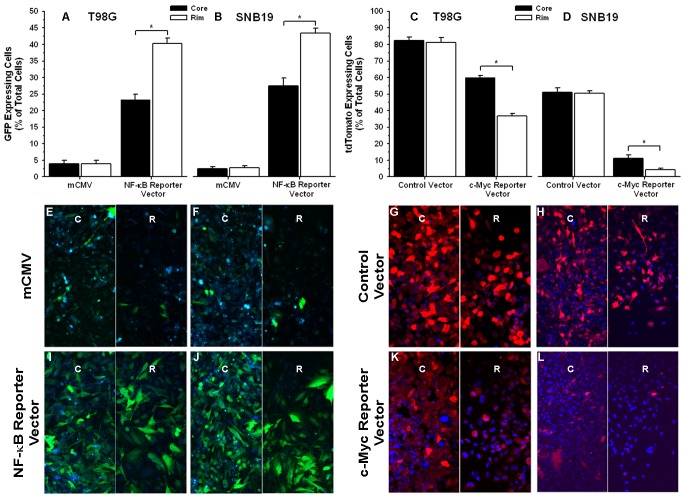
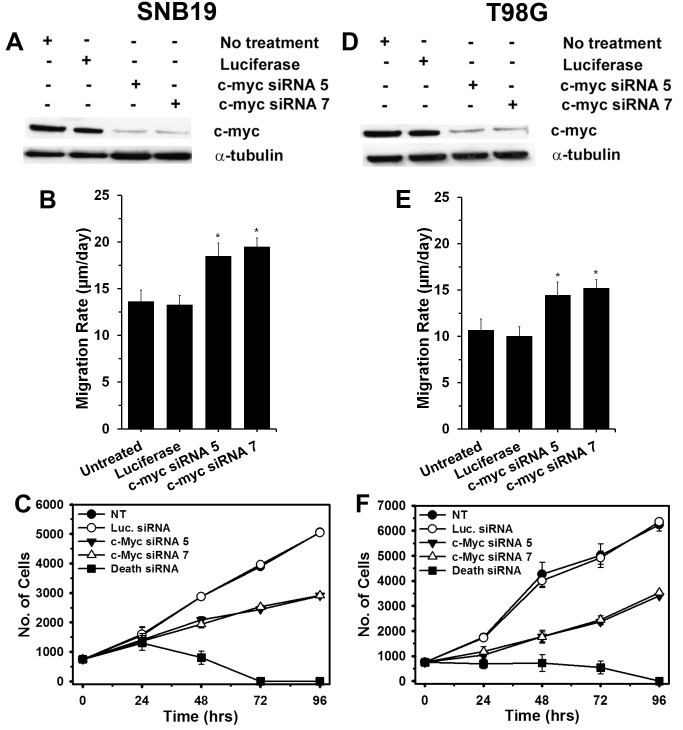
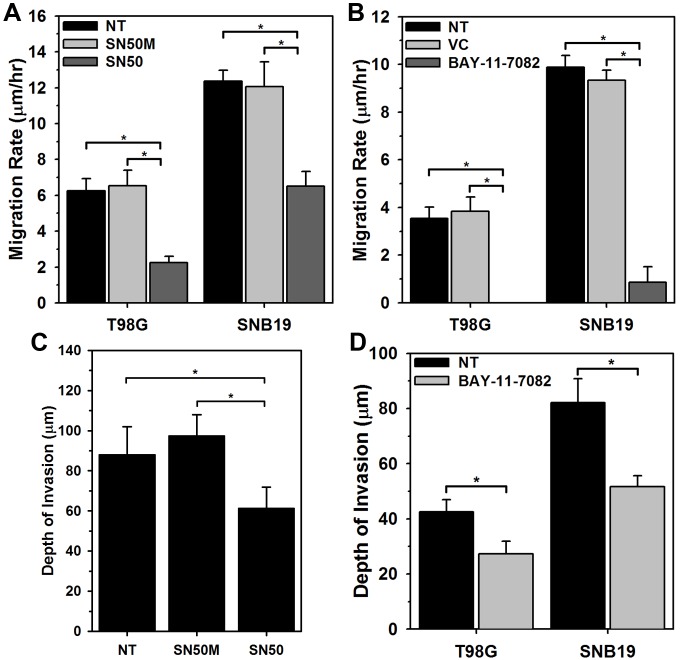
Histology of malignant glioma depicts dense proliferative areas rich in angiogenesis as well as dissemination of neoplastic cells into adjacent brain tissue. Although the mechanisms that trigger transition from proliferative to invasive phenotypes are complex, the dichotomy of cell proliferation and migration, the "Go or Grow" hypothesis, argues for specific and coordinated regulation of these phenotypes. We investigated transcriptional elements that accompany the phenotypes of migration and proliferation, and consider the therapeutic significance of the "Go or Grow" hypothesis. Interrogation of matched core and rim regions from human glioblastoma biopsy specimens in situ (n = 44) revealed higher proliferation (Ki67 labeling index) in cells residing at the core compared to the rim. Profiling activated transcription factors in a panel of migration-activated versus migration-restricted GBM cells portrayed strong NF-κB activity in the migratory cell population. In contrast, increased c-Myc activity was found in migration-restricted proliferative cells. Validation of transcriptional activity by NF-κB- or c-Myc-driven GFP or RFP, respectively, showed an increased NF-κB activity in the active migrating cells, whereas the proliferative, migration restricted cells displayed increased c-Myc activity. Immunohistochemistry on clinical specimens validated a robust phosphorylated c-Myc staining in tumor cells at the core, whereas increased phosphorylated NF-κB staining was detected in the invasive tumor cells at the rim. Functional genomics revealed that depletion of c-Myc expression by siRNA oligonucleotides reduced cell proliferation in vitro, but surprisingly, cell migration was enhanced significantly. Conversely, inhibition of NF-κB by pharmacological inhibitors, SN50 or BAY-11, decreased both cell migration in vitro and invasion ex vivo. Notably, inhibition of NF-κB was found to have no effect on the proliferation rate of glioma cells. These findings suggest that the reciprocal and coordinated suppression/activation of transcription factors, such as c-Myc and NF-κB may underlie the shift of glioma cells from a "growing-to-going" phenotype.


Conflict of interest statement

Competing Interests: The authors have declared that no competing interests exist.

Figures

Figure 1
Figure 1. Ki-67 is overexpressed in GBM cells at the tumor core.
From 19 independent GBM specimens, 1000 to 2000 stationary (core) and invasive (rim) cells were harvested by LCM for microarray analysis. Relative Ki-67 mRNA signal intensity was expressed as a ratio of rim to core.
Figure 2
Figure 2. Quantitative analysis of Ki-67 expression in 35 human glioma tumors.
(A) AQUA scores of Ki-67 protein levels were measured in matched sets of core:rim for each tumor; ratio of AQUA scores for each specimen are plotted, ranked from high to low. Samples with an AQUA score fold difference above “1” indicates significant up-regulation (indicated by horizontal line) (p<0.002). (B) Representative images of the Ki-67 (MIB-1) immunostaining of the GBM core (a, b) and invasive rim (c, d). Original magnification 10x (a,c) and 20x (b,d).
Figure 3
Figure 3. Glioma cells seeded in a way that manifests cell crowding and cell dispersion show that at the core cells were more proliferative than glioma cells located at the rim.
(A) SNB19 cells at the core of the cell circle stained for DAPI to account for all cells. (B) Same image field as panel A at the core of the cell circle but stained for Cyclin A (Cy3-red), (C) incorporated BrdU (FITC-green), and (D) showing CyclinA (Cy3-Red) - BrdU (FITC-green) Overlay. (E) SNB19 cells at the rim of the cell circle stained for DAPI to account for all cells. (F) Same image field as panel E but stained for Cyclin A (Cy3-red), (G) incorporated BrdU (FITC-green), and (H) showing CyclinA (Cy3-Red) - BrdU (FITC-green) Overlay. (I) and (J) Quantitative analysis of Cyclin A- and BrdU-labeled SNB19 and T98G glioma cell numbers (n = 3). The percent of Cyclin A-, and BrdU-labeled cells, and the total number of cells were measured. Statistical analysis was performed using a student T-test. * p<0.05.
Figure 4
Figure 4. Transcription Factor Profiling of Migrating Glioma Cells vs.
Migration-Restricted Glioma Cells. Tumor cells were seeded in either migration-activated “sparse” condition or in migration-restricted “dense” condition on SF767 glioma-derived ECM. Nuclear lysates were collected and hybridized with biotinylated-DNA probes specific to 19 transcription factors as per Marligen’s transcription kit and assayed using the Luminex 200. Two independent biological replicates were performed with each sample in triplicate. Ratios of the averaged mean fluorescent intensities for each transcription factor for sparse over dense were calculated for each biological set and average values of two biological replicates are plotted in the heat map above (For ratios of the average MFI for each biological replicate is presented in Figure S2). The heat map was constructed using a conditionally formatted color range. Green boxes represent the transcription factors activated when cells were in a migration-activated condition (sparse/dense ratios ≥1.5). Red boxes represent transcription factors activated when cells were in a migration-restricted condition (sparse/dense ratios ≤0.6). Yellow boxes indicate no change in transcription activity (sparse/dense ratios between 0.65 and 1.5).
Figure 5
Figure 5. Glioma tumor specimens show differential activation of c-Myc and NF-κB in core and invasive rim.
Immunohistochemistry of matched glioma core and rim sample from a glioma invasion specific tissue microarray (n = 45). Phosphorylated c-Myc nuclear protein expression is greater at the glioma tumor core than the rim regions of tumor. Representative 10X images of core (A) and rim (C) of a GBM sample. 20X images of core (B) and rim (D) of the same GBM sample. Phosphorylated NFκB nuclear protein expression is greater at the glioma tumor rim than the core regions of tumor. Representative 10X images of core (E) and rim (G) of a GBM sample. 20X images of core (F) and rim (H) of the same GBM sample. Black arrows represent positively stained nuclear regions of the glioma tumor cells.
Figure 6
Figure 6. Migrating glioma cells promote activation of the transcription factor NF-κB whereas migration-restricted glioma cells display high c-Myc activation.
T98G and SNB19 glioma cells were infected with lentivirus expressing the binding element for either the transcription factor NF-kB and a green fluorescent protein (GFP) reporter or the transcription factor c-Myc and a red fluorescent protein (tdTomato) reporter. Cells were plated in a migration stimulating environment and imaged after 48 hrs. (A) & (B) Quantitative analysis of GFP positive T98G and SNB19 glioma cells respectively, at the core and the rim in radial monolayer assay (n = 5). (C) & (D) Quantitative analysis of tdTomato positive T98G and SNB19 glioma cells respectively, at the core and the rim in radial monolayer assay (n = 5). (E) & (F) Fluorescent micrographs (20X) of mCMV control GFP vector infected T98G and SNB19 glioma cells respectively. (G) & (H) Fluorescent micrographs (20X) of control tdTomato vector infected T98G and SNB19 glioma cells respectively. (I) & (J) Fluorescent micrographs (20X) of NF-κB reporter vector infected T98G and SNB19 glioma cells respectively. (K) & (L) Fluorescent micrographs (20X) of tdTomato reporter vector infected T98G and SNB19 glioma cells respectively. Green cells are GFP positive and blue cells are not expressing the GFP protein but are stained with Hoescht stain. Red cells are tdTomato positive and blue cells are not expressing the tdTomato protein but are stained with Hoescht stain. Fluorescent micrographs of core regions are depicted by “C” and corresponding rim regions are depicted by “R”. Error bar represent the standard deviation of n = 5 observations. Asterisk (*) represents p value <0.05.
Figure 7
Figure 7. Knockdown of c-Myc using siRNA increases glioma cell migration and reduces glioma cell proliferation.
Western blot analysis (α-tubulin used as a loading control) to confirm reduction of c-Myc in the glioma cell lines (A) SNB19 and (D) T98G transfected with two c-Myc–specific siRNA. Untransfected cells and cells transfected with a control siRNA (luciferase) are shown for comparison. Treatment with two separate c-Myc siRNA increased migration of (B) SNB19 and (E) T98G cells in a radial migration assay when compared with untreated or luciferase-transfected cells (p<0.001, 2-tailed Student’s t-test). Treatment with two c-Myc siRNA suppressed proliferation of (C) SNB19 and (E) T98G as demonstrated by alamar blue assay when compared with untreated or luciferase transfected cells. Cell Death siRNA (Qiagen) was utilized in the proliferation assay as internal experimental control.
Figure 8
Figure 8. Inhibition of NF-κB function suppresses glioma cell migration in vitro and invasion ex vivo.
Treatment with 50 µM SN50 peptide inhibitor suppresses migration of (A) T98G and SNB19 glioma cells in a radial migration assay when compared with untreated (NT) or scrambled peptide treated (SN50M) cells (*; p<0.0001). (B) SNB19 glioma cells stably expressing GFP were implanted into the bilateral putamen on rat organotypic brain slices. Implanted cells were then treated with SN50 peptide inhibitor, scrambled peptide (SN50M) or left untreated (NT) and observed at 48 hrs. Depth of invasion was then calculated from Z-axis images collected by confocal laser scanning microscopy. The mean value of the depth of invasion was obtained from four independent experiments (*; p<0.0001). Treatment with 20 µM NF-κB functional inhibitor (BAY-11-7082) suppresses migration of (C) T98G and SNB19 glioma cells in a radial migration assay when compared with untreated (NT) or DMSO treated (VC) cells (*; p<0.0001). (D) Similar ex vivo brain slice invasion assay as described in B with NF-κB functional inhibitor (BAY-11-7082) demonstrated reduced invasion of T98G and SNB19 glioma cells. The mean value of the depth of invasion was obtained from four independent experiments (*; p<0.0001).

References

    1. CBTRUS (2010) CBTRUS Statistical Report: Primary Brain and Central Nervous System Tumors Diagnosed in the United States in 2004–2006 Central Brain Tumor Registry of the United States.
    1. Salhia B, Tran NL, Symons M, Winkles JA, T Rutka J, et al. (2006) Molecular pathways triggering glioma cell invasion. Expert Rev Mol Diagn 6: 613–626. - PubMed
    1. Norden AD, Drappatz J, Wen PY (2009) Antiangiogenic therapies for high-grade glioma. Nat Rev Neurol 5: 610–620. - PubMed
    1. Tate MC, Aghi MK (2009) Biology of angiogenesis and invasion in glioma. Neurotherapeutics 6: 447–457. - PMC - PubMed
    1. Claes A, Idema AJ, Wesseling P (2007) Diffuse glioma growth: a guerilla war. Acta Neuropathol 114: 443–458. - PMC - PubMed

Publication types

MeSH terms