

Atlantic salmon populations invaded by farmed escapees: quantifying genetic introgression with a Bayesian approach and SNPs
- PMID: 23968202
- PMCID: PMC3765417
- DOI: 10.1186/1471-2156-14-74
Atlantic salmon populations invaded by farmed escapees: quantifying genetic introgression with a Bayesian approach and SNPs
Abstract
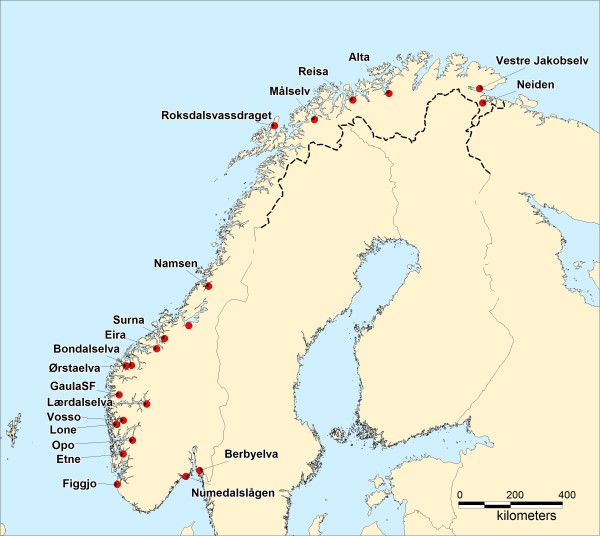
Background: Many native Atlantic salmon populations have been invaded by domesticated escapees for three decades or longer. However, thus far, the cumulative level of gene-flow that has occurred from farmed to wild salmon has not been reported for any native Atlantic salmon population. The aim of the present study was to investigate temporal genetic stability in native populations, and, quantify gene-flow from farmed salmon that caused genetic changes where they were observed. This was achieved by genotyping historical and contemporary samples from 20 populations covering all of Norway with recently identified single nucleotide polymorphism markers that are collectively diagnostic for farmed and wild salmon. These analyses were combined with analysis of farmed salmon and implementation of Approximate Bayesian computation based simulations.
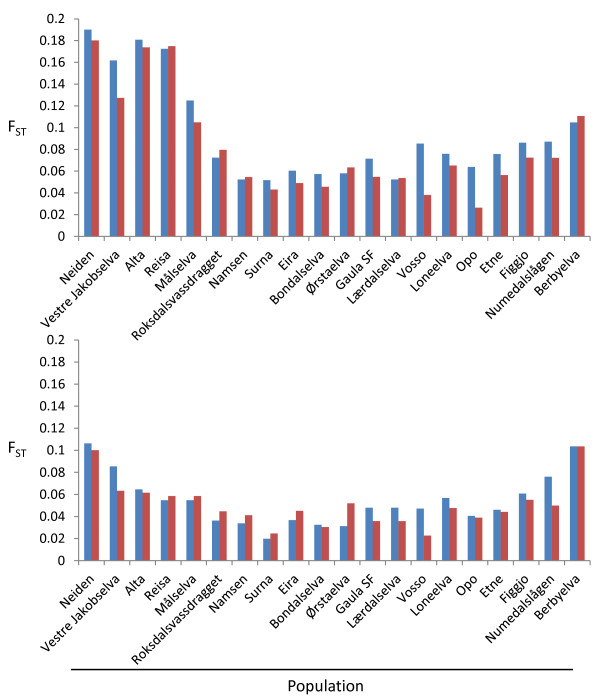
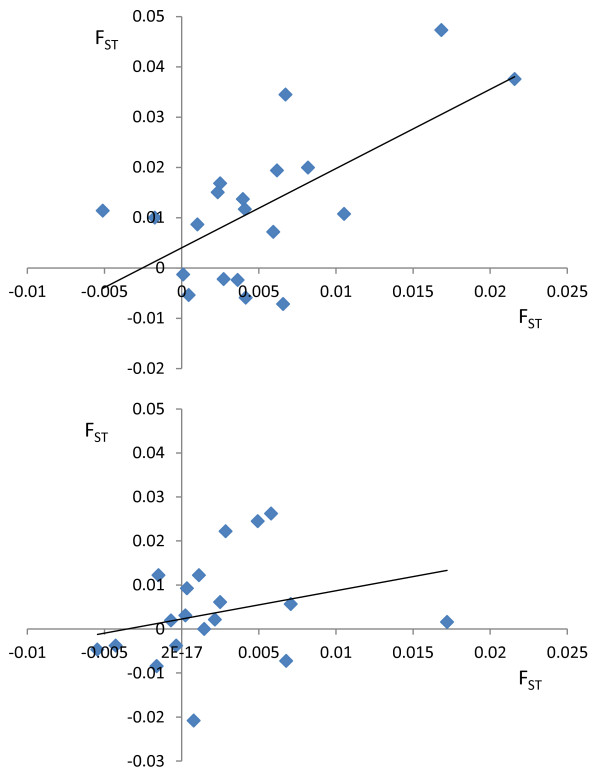
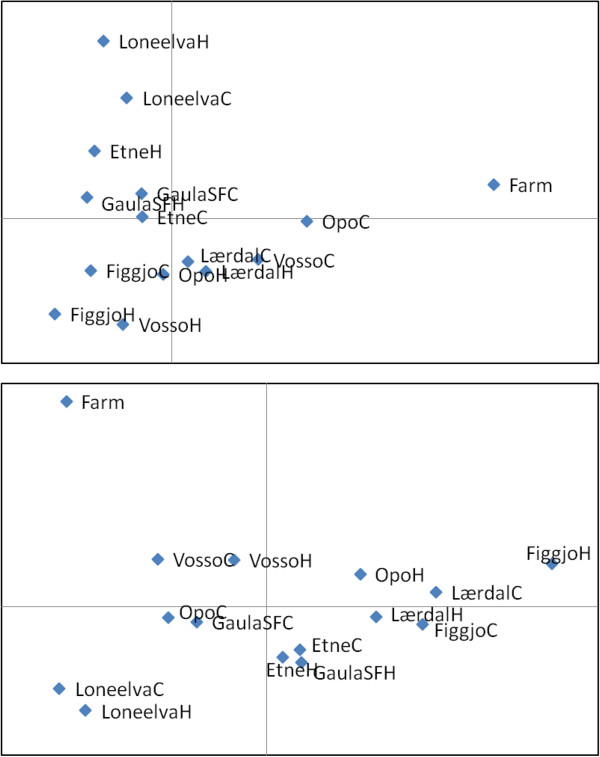
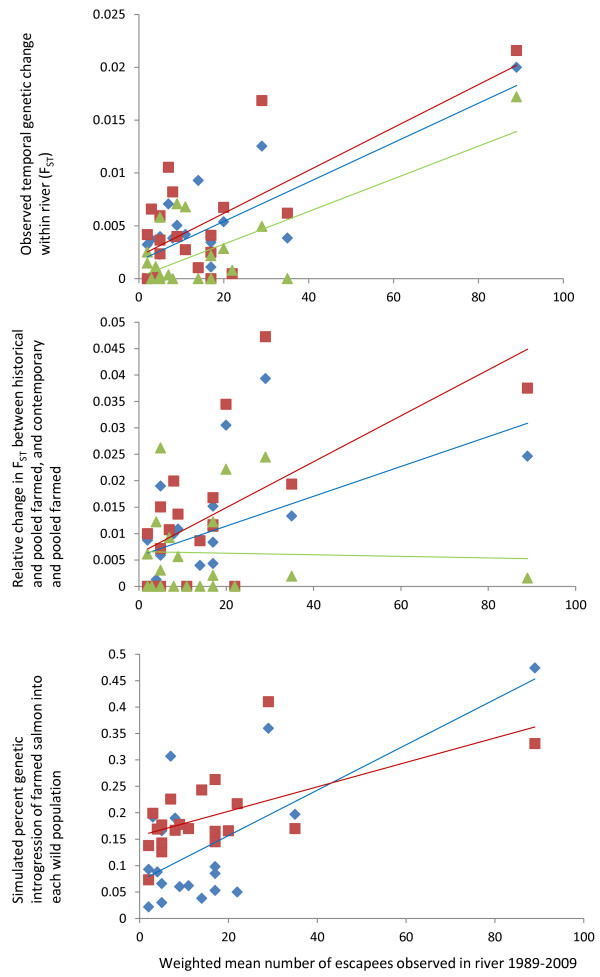
Results: Five of the populations displayed statistically significant temporal genetic changes. All five of these populations became more similar to a pool of farmed fish with time, strongly suggesting introgression of farmed fish as the primary cause. The remaining 15 populations displayed weak or non-significant temporal genetic changes. Estimated introgression of farmed fish ranged from 2-47% per population using approximate Bayesian computation. Thus, some populations exhibited high degrees of farmed salmon introgression while others were more or less unaffected. The observed frequency of escapees in each population was moderately correlated with estimated introgression per population R² = 0.47 P < 0.001. Genetic isolation by distance existed within the historical and contemporary data sets, however, the among-population level of divergence decreased with time.
Conclusions: This is the first study to quantify cumulative introgression of farmed salmon in any native Atlantic salmon population. The estimations demonstrate that the level of introgression has been population-specific, and that the level of introgression is not solely predicted by the frequency of escapees observed in the population. However, some populations have been strongly admixed with farmed salmon, and these data provide policy makers with unique information to address this situation.
Figures

References
-
- Anon. Oppdaterte rømmingstall. 2012. http://www.fiskeridir.no/statistikk/akvakultur/oppdaterte-roemmingstall In Norwegian.
-
- Milner NJ, Evans R. The incidence of escaped Irish farmed salmon in English and Welsh rivers. Fish Manag Ecol. 2003;10(6):403–406. doi: 10.1111/j.1365-2400.2003.00348.x. - DOI
-
- Walker AM, Beveridge MCM, Crozier WO, Maoileidigh N, Milner N. Monitoring the incidence of escaped farmed Atlantic salmon, Salmo salar L., in rivers and fisheries of the United Kingdom and Ireland: current progress and recommendations for future programmes. ICES J Mar Sci. 2006;63(7):1201–1210. doi: 10.1016/j.icesjms.2006.04.018. - DOI
-
- Fiske P, Lund RA, Hansen LP. Relationships between the frequency of farmed Atlantic salmon, Salmo salar L., in wild salmon populations and fish farming activity in Norway, 1989–2004. ICES J Mar Sci. 2006;63(7):1182–1189. doi: 10.1016/j.icesjms.2006.04.006. - DOI
-
- Fiske P, Lund RA, Østborg GM, Fløystad L. Rømt oppdrettslaks i sjø- og elvefisket i årene 1989–2000. NINA oppdresgsmelding. 2001;704:1–26. In Norwegian.
Publication types
MeSH terms
LinkOut - more resources
Full Text Sources
Other Literature Sources
