. 2013 Nov;184(2):251-60.
doi: 10.1016/j.jsb.2013.08.005. Epub 2013 Aug 20.

Influence of electron dose rate on electron counting images recorded with the K2 camera

Affiliations

Influence of electron dose rate on electron counting images recorded with the K2 camera

Xueming Li et al. J Struct Biol. 2013 Nov.

Abstract

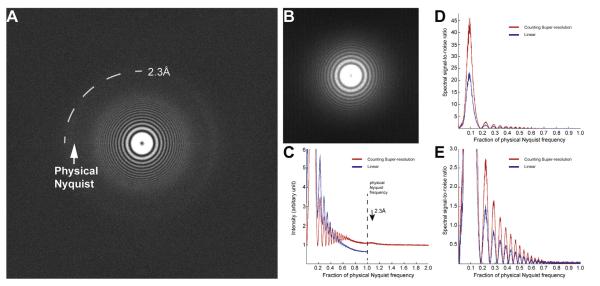
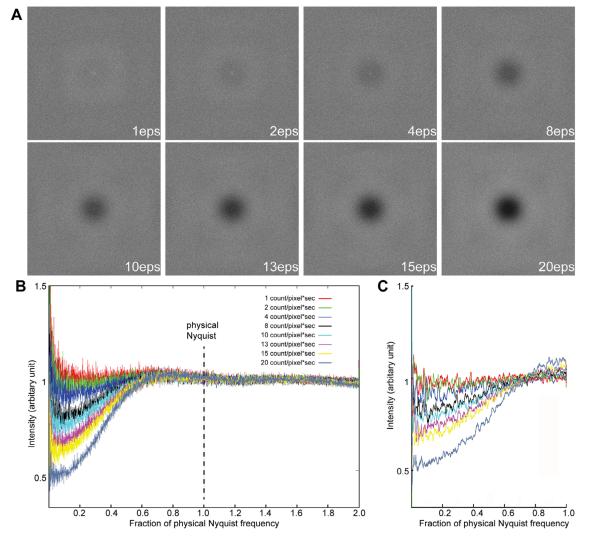
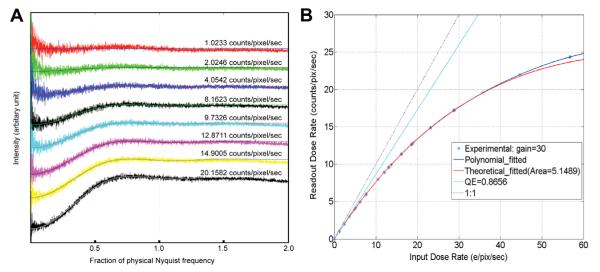
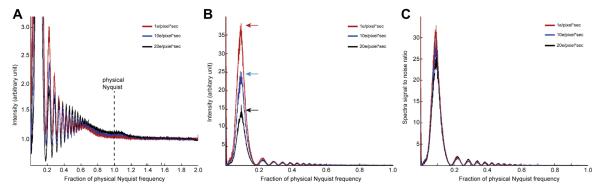
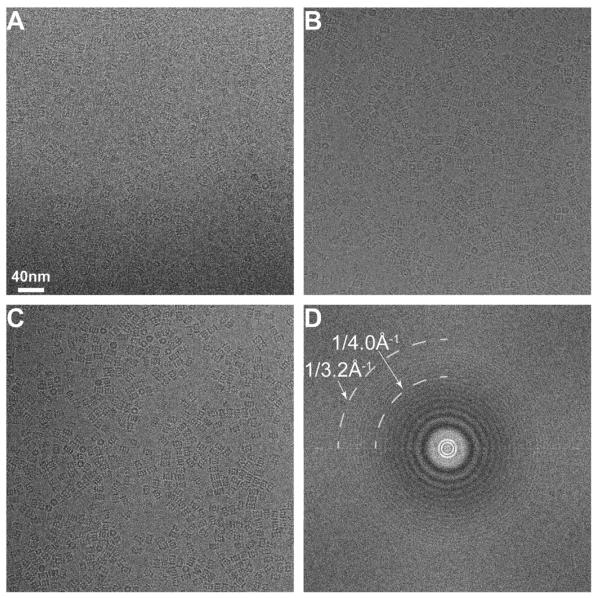
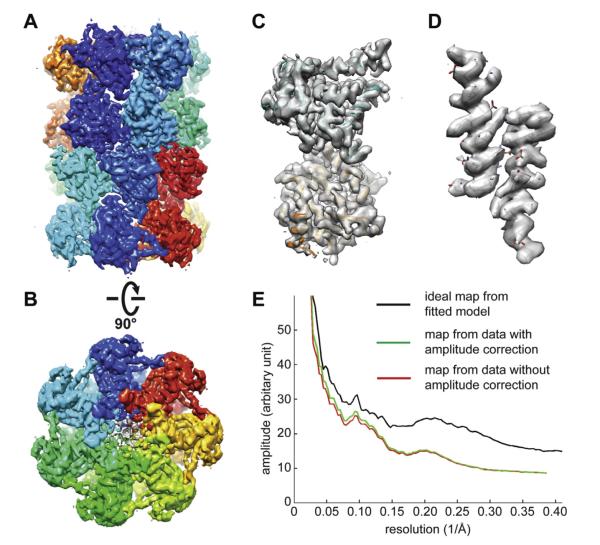
A recent technological breakthrough in electron cryomicroscopy (cryoEM) is the development of direct electron detection cameras for data acquisition. By bypassing the traditional phosphor scintillator and fiber optic coupling, these cameras have greatly enhanced sensitivity and detective quantum efficiency (DQE). Of the three currently available commercial cameras, the Gatan K2 Summit was designed specifically for counting individual electron events. Counting further enhances the DQE, allows for practical doubling of detector resolution and eliminates noise arising from the variable deposition of energy by each primary electron. While counting has many advantages, undercounting of electrons happens when more than one electron strikes the same area of the detector within the analog readout period (coincidence loss), which influences image quality. In this work, we characterized the K2 Summit in electron counting mode, and studied the relationship of dose rate and coincidence loss and its influence on the quality of counted images. We found that coincidence loss reduces low frequency amplitudes but has no significant influence on the signal-to-noise ratio of the recorded image. It also has little influence on high frequency signals. Images of frozen hydrated archaeal 20S proteasome (~700 kDa, D7 symmetry) recorded at the optimal dose rate retained both high-resolution signal and low-resolution contrast and enabled calculating a 3.6 Å three-dimensional reconstruction from only 10,000 particles.

Keywords: Direct detection camera; Electron cryomicroscopy; Single particle.


Figures

Fig.1
Fig.1
Comparison of images recorded with K2 counting and linear modes. Images of thin Pt/Ir film were recorded by the K2 Summit in both counting and linear modes. The imaging conditions were kept the same, i.e. magnification, defocus and total dose. The counting image was recorded in super-resolution mode, thus its image pixel size is only half of the linear image. (A) The Fourier transform of the counting image. (B) The Fourier transform of the linear image. (C) Rotational averages of power spectra from both linear (blue) and counting (red) images are plotted together for comparison. Both spectra are normalized by the total counts in the corresponding images. (D and E) Spectral signal-to-noise ratios (SSNRs) were calculated from linear (blue curve) and counting (red curve) images shown in Fig. 1C. 1.0 in horizontal axis is the physical Nyquist limit. (D) is shown as full scale in vertical axis and (E) is the enlarged view with vertical scale limited to 3.0.
Fig.2
Fig.2
Influence of dose rate on counting images (A) Fourier transforms of empty super-resolution counting images recorded with different dose rates. Exposure time was adjusted so that the total dose used in each image is the same. The edge of the transform corresponds to twice the physical Nyquist limit. (B) Rotational averages of power spectra from empty counting images, i.e. noise power spectra, were plotted in different colors. (C) Simulated noise power spectra at different dose rates.
Fig.3
Fig.3
Fitting of experimental NPS and DCE curves. (A) Experimental NPS curves were fit by least square fitting using the formula (1). Parameters determined from the fittings are listed in Table 1. The dose rate of each curve is marked. (B) While the DQE curve can be fit by a polynomial function (blue curve) as previously described (Li et al., 2013), it can also be fit by the formula (4) derived from a binomial distribution model (red curve).
Fig.4
Fig.4
Comparison of super-resolution counting images recorded with different dose rates. (A) Rotational averages of power spectra without background subtraction from super-resolution counting images of thin Pt/Ir film recorded with different dose rate. The exposure time used for each image was adjusted so that the total doses used for all images were the same, allowing the power spectra to be compared directly without additional scaling. (B) Rotational averages of power spectra after background subtraction. Arrows indicate that the amplitude of first Thon ring is reduced significantly by increasing the dose rate. (C) SSNR calculated from (A).
Fig.5
Fig.5
Images of frozen hydrated archaeal 20S proteasome recorded with the K2 camera in counting mode. The image pixel size is 1.2 Å, corresponding to a Nyquist of 2.4 Å. Image defocuses are approximately (A) −0.9 μm, (B) −1.1 μm, and (C) −1.5 μm. (D) A Fourier transform calculated from image (B). At a defocus of −1.1 μm, the visible Thon ring extends to 3.2 Å.
Fig.6
Fig.6
3D reconstruction of archaeal 20S proteasome with amplitude correction. 10,000 particles were taken from previously published dataset (Li et al., 2013) and corrected for coincidence loss induced low frequency amplitude loss. (A and B) Two different views of the 3D reconstruction after amplitude correction filtered to a resolution of 3.6 Å. (C) A single α- and β-subunits segmented from the 3D density map in A. (D) Two α-helices segmented from the α- and β-subunits showing clear side chain density. The quality of side chain density is similar to the published 3.3 Å map (Li et al., 2013). (E) Comparison of rotational averages of Fourier power spectra of the 3D reconstructions with (red) and without (green) amplitude correction.

References

    1. Avila-Sakar A, Li X, Zheng SQ, Cheng Y. Recording high-resoution images of two-dimensional crystals of membrane proteins. In: Schmid-Krey I, Cheng Y, editors. Electron Crystallography of Soluble and Membrane Proteins, Methods and Protocols. Humana Press; 2013. pp. 129–152. - PubMed
    1. Bammes BE, Rochat RH, Jakana J, Chen DH, Chiu W. Direct electron detection yields cryo-EM reconstructions at resolutions beyond 3/4 Nyquist frequency. Journal of Structural Biology. 2012;177:589–601. - PMC - PubMed
    1. Booth CR, Jakana J, Chiu W. Assessing the capabilities of a 4k × 4k CCD camera for electron cryo-microscopy at 300 kV. Journal of Structural ~Biology. 2006;156:556–563. - PubMed
    1. Campbell MG, Cheng A, Brilot AF, Moeller A, Lyumkis D, Veesler D, Pan J, Harrison SC, Potter CS, Carragher B, Grigorieff N. Movies of ice-embedded particles enhance resolution in electron cryo-microscopy. Structure. 2012;20:1823–1828. - PMC - PubMed
    1. Carragher B, Kisseberth N, Kriegman D, Milligan RA, Potter CS, Pulokas J, Reilein A. Leginon: an automated system for acquisition of images from vitreous ice specimens. Journal of Structural Biology. 2000;132:33–45. - PubMed

Publication types

MeSH terms