. 2013 Nov;33(11):2625-32.
doi: 10.1161/ATVBAHA.113.302249. Epub 2013 Aug 22.

Sodium-dependent phosphate cotransporters and phosphate-induced calcification of vascular smooth muscle cells: redundant roles for PiT-1 and PiT-2

Affiliations

Sodium-dependent phosphate cotransporters and phosphate-induced calcification of vascular smooth muscle cells: redundant roles for PiT-1 and PiT-2

Matthew H Crouthamel et al. Arterioscler Thromb Vasc Biol. 2013 Nov.

Abstract

Objective: Elevated serum phosphate has emerged as a major risk factor for vascular calcification. The sodium-dependent phosphate cotransporter, PiT-1, was previously shown to be required for phosphate-induced osteogenic differentiation and calcification of cultured human vascular smooth muscle cells (VSMCs), but its importance in vascular calcification in vivo and the potential role of its homologue, PiT-2, have not been determined. We investigated the in vivo requirement for PiT-1 in vascular calcification using a mouse model of chronic kidney disease and the potential compensatory role of PiT-2 using in vitro knockdown and overexpression strategies.

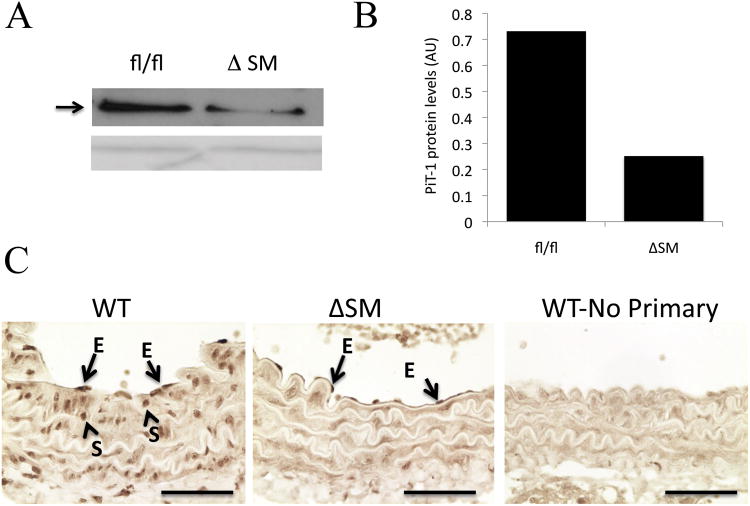
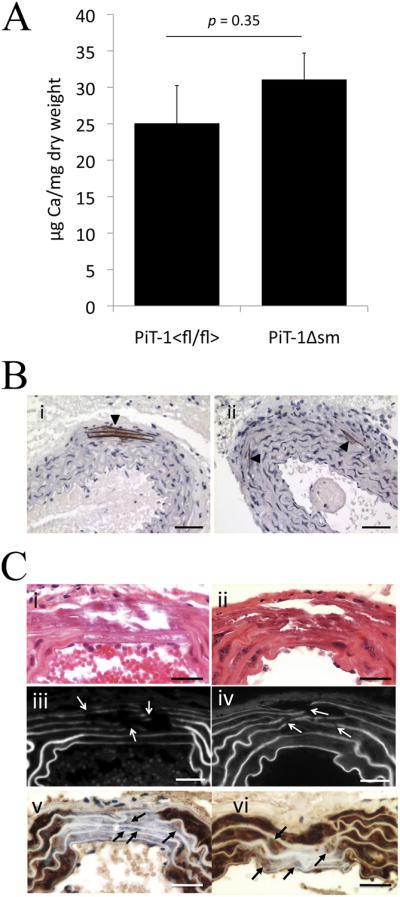
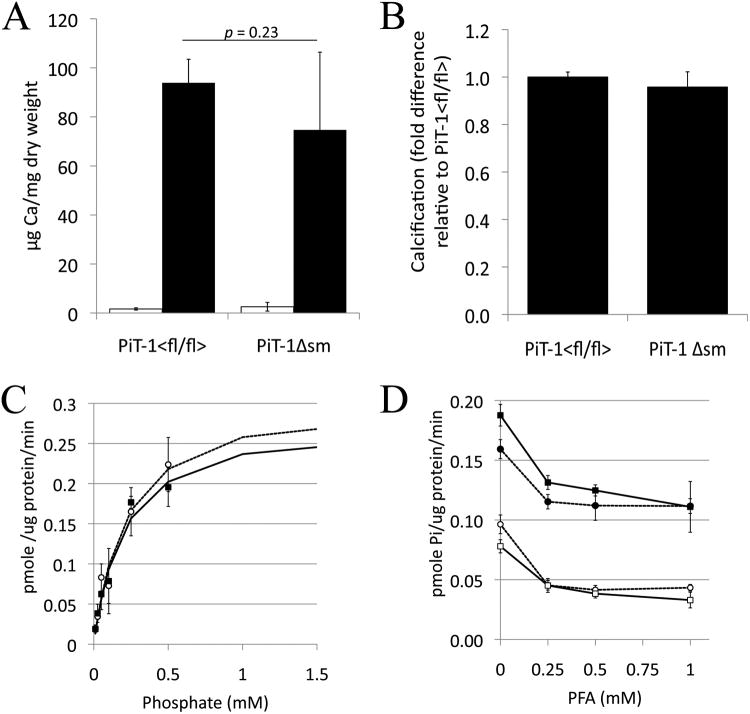
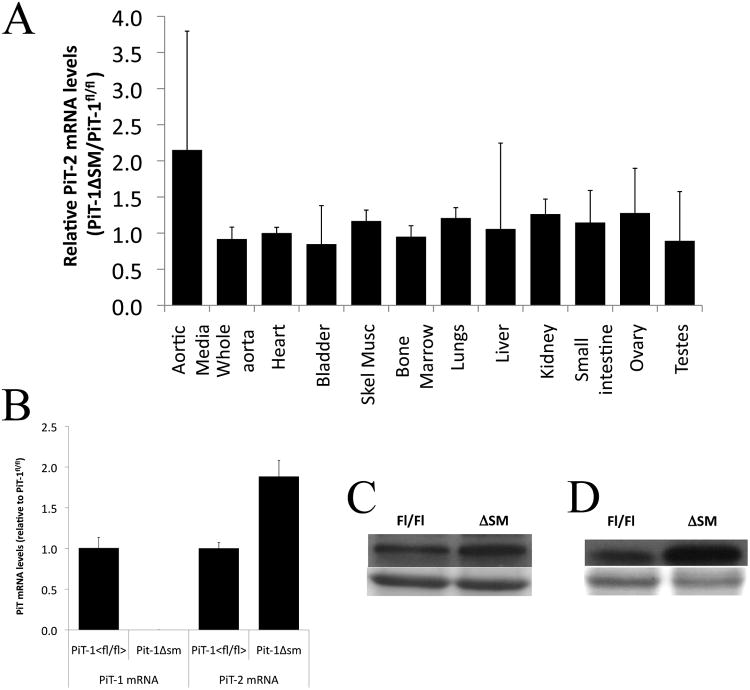
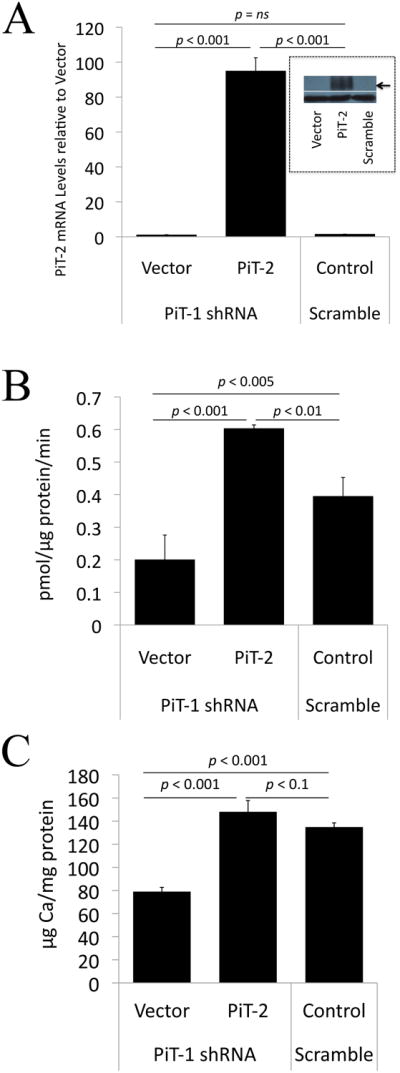
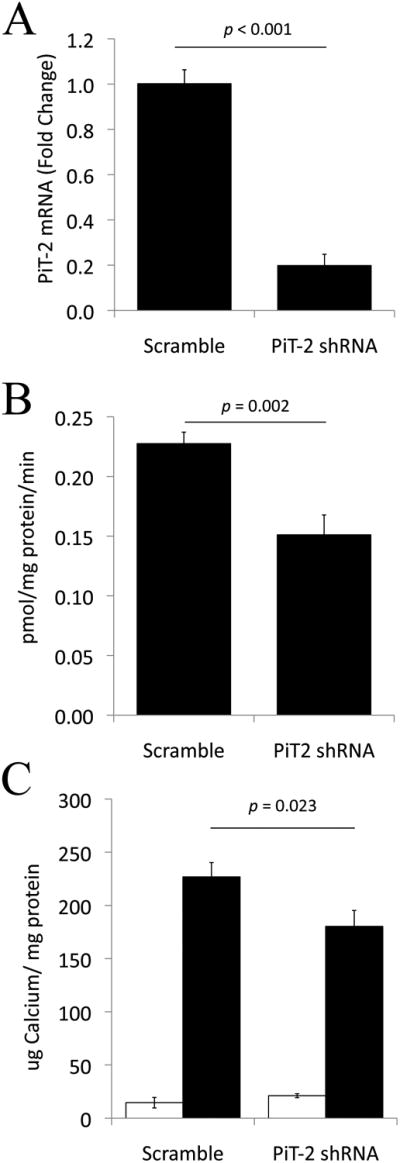
Approach and results: Mice with targeted deletion of PiT-1 in VSMCs were generated (PiT-1(Δsm)). PiT-1 mRNA levels were undetectable, whereas PiT-2 mRNA levels were increased 2-fold in the vascular aortic media of PiT-1(Δsm) compared with PiT-1(flox/flox) control. When arterial medial calcification was induced in PiT-1(Δsm) and PiT-1(flox/flox) by chronic kidney disease followed by dietary phosphate loading, the degree of aortic calcification was not different between genotypes, suggesting compensation by PiT-2. Consistent with this possibility, VSMCs isolated from PiT-1(Δsm) mice had no PiT-1 mRNA expression, increased PiT-2 mRNA levels, and no difference in sodium-dependent phosphate uptake or phosphate-induced matrix calcification compared with PiT-1(flox/flox) VSMCs. Knockdown of PiT-2 decreased phosphate uptake and phosphate-induced calcification of PiT-1(Δsm) VSMCs. Furthermore, overexpression of PiT-2 restored these parameters in human PiT-1-deficient VSMCs.

Conclusions: PiT-2 can mediate phosphate uptake and calcification of VSMCs in the absence of PiT-1. Mechanistically, PiT-1 and PiT-2 seem to serve redundant roles in phosphate-induced calcification of VSMCs.

Keywords: PiT-1; PiT-2; phosphate; vascular calcification; vascular smooth muscle cell.


Figures

Figure 1
Figure 1. PiT-1 protein depletion in PiT-1Δsm aortic medial smooth muscle cells
A. Representative western blot showing whole aorta extract from PiT-1flox/flox (fl/fl) and PiT-1Δsm (ΔSM) mice using an anti-PiT-1 antibody (upper panel, arrow). Amido black stained loading control (lower panel). (B). Densitometric analysis of PiT-1 protein levels in pooled aortic media from PiT-1flox/flox (fl/fl, n=8) and PiT-1Δsm (ΔSM, n=8) mice normalized to the loading control and given in arbitrary units (AU). (C). Immunohistochemistry using anti-PiT-1 antibody performed on wildtype (WT) and PiT-1Δsm (ΔSM) paraffin embedded aorta sections. No primary: negative control that was not treated with the anti-PiT-1 antibody. Arrows indicate positive staining in medial VSMC (S) and endothelial cells (E) in WT, but only endothelial cells (E) in PiT-1Δsm. Scale bars=50 μm.
Figure 2
Figure 2. Aortic calcification in uremic, high phosphate-fed mice
(A) Aortic calcium content was not different (p=.35) between the high phosphate fed CKD mice in the PiT-1Δsm group versus the PiT-1flox/flox group. Data are mean ± s.e. and n=16 per group. (B) Von Kossa staining (brown) with hematoxylin counterstain (blue) showing medial calcification in aortas from (i) PiT-1flox/flox mouse and, (ii) PiT-1Δsm mouse. Scale bars = 50 μm (C) Aortic sections from PiT-1flox/flox (i,iii,v) and PiT-1Δsm (ii,iv,vi) mice showing similar H&E staining (i,ii), eosin fluorescence (iii,iv) with arrowheads showing elastin strand breaks, and Sm22α staining with methyl green nuclear counterstain (v,vi), with arrows pointing to SMC nuclei within the calcified area that have lost or have much reduced Sm22α staining compared to adjacent non-calcified areas. Scale bars = 25 μm.
Figure 3
Figure 3. Aortic ring calcification and phosphate uptake in PiT-1Δsm (ΔSM) and PiT-1flox/flox (fl/fl) SMC
(A) Calcification of mouse aortic rings in response to normal (1 mM; open bars) or elevated (2.6 mM; black bars) phosphate, n=5 per group. Data are given as mean ± sd.(B) Fold difference in calcification of PiT-1Δsm VSMC relative to PiT-1flox/flox VSMC following treatment with 2.6mmol/L phosphate. Data are the average of four separate experiments using cell passages 6-8 and were treated for 9-12 days in duration. Expressed as mean + s.e.m. (C) Radiolabeled phosphate transport assays in VSMCs from PiT-1flox/flox (circles) and PiT-1Δsm (squares) mice. Data are expressed as mean ± sd. (D) Lack of inhibition of phosphate uptake by the type II NaPi inhibitor phosphonoformic acid (PFA). Circles are PiT-1flox/flox, squares are PiT-1Δsm. Closed symbols are in the presence of sodium, open symbols are in the absence of sodium. Data are expressed as mean ± sd.
Figure 4
Figure 4. PiT-2 expression in tissues and VSMC from PiT-1Δsm and PiT-1flox/flox mice
(A) qPCR for PiT-2 mRNA expression in various tissues. mRNA levels were derived from standard curves and normalized to 18s, and expressed as ratio of mean mRNA levels in PiT-1Δsm tissue relative to mean levels in PiT-1flox/flox tissue. Error bars represent standard deviation. PiT-2 expression was 2-fold higher in the aortic media of PiT-1Δsm mice. PiT-2 levels were unchanged in the other tissues surveyed. (B) qPCR of PiT-1 and PiT-2 mRNA in cultured VSMCs, showing basal PiT-2 expression in PiT-1flox/flox (fl/fl) VSMCs and increased PiT-2 expression in PiT-1Δsm (ΔSM). (C) Western blot for PiT-2 (upper panel) and loading control (lower panel) in whole aorta extracts. (D) Western blot for PiT-2 (upper panel) and loading control (lower panel) in VSMC extracts.
Figure 5
Figure 5. Overexpression of PiT-2 in PiT-1 knockdown human aortic VSMCs
(A) PiT-2 levels in PiT-1 knockdown (PiT-1 shRNA-treated) human VSMCs transduced with vector alone (Vector) or PiT-2 cDNA (PiT-2), or control VSMCs treated with scrambled shRNA (Scramble). Graph shows PiT-2 mRNA levels as determined by qPCR, expressed as PiT-2 mRNA levels relative to Vector. Inset shows PiT-2 protein levels (upper panel; arrow) and b-tubulin loading control (lower panel) as determined by Western blotting (B) Restoration of phosphate (Pi) uptake by PiT-2 overexpression in PiT-1-knockdown cells. Phosphate uptake was measured in 0.1mmol/L phosphate in a 30 min period. (C) Restoration of phosphate-induced calcification by PiT-2 overexpression in PiT-1-knockdown cells. Data are mean ± s.d., n=3 per group.
Figure 6
Figure 6. Knockdown of PiT-2 in PiT-1Δsm mouse VSMCs
(A) qPCR showing ∼80% knockdown of PiT-2 mRNA in PiT-1 knockdown VSMC (PiT-2 shRNA) compared to scrambled shRNA control VSMC (scrambled). (B) Decreased uptake of radiolabeled phosphate in PiT-2 shRNA expressing human VSMCs compared to scrambled. Cells were incubated in 0.16mmol/L phosphate for 20 minutes. (C) PiT-2 knockdown decreased calcification of PiT-1Δsm VSMCs under high phosphate conditions (PiT-1/PiT-2 double knockdown cells). Open bars = 1mM phosphate; black bars = 2.6mM phosphate. Data are mean ± s.d., n=3 per group.

References

    1. U.S. Renal data system (usrds) 2011 annual data report. Atlas of End-Stage Renal Disease in the United States. National Institutes of Health, National Institute of Diabetes and Digestive and Kidney Diseases; Bethesda, MD: http://www.usrds.org/adr.htm.
    1. Blacher J, Guerin AP, Pannier B, Marchais SJ, London GM. Arterial calcifications, arterial stiffness, and cardiovascular risk in end-stage renal disease. Hypertension. 2001;38:938–942. - PubMed
    1. Goodman WG, Goldin J, Kuizon BD, Yoon C, Gales B, Sider D, Wang Y, Chung J, Emerick A, Greaser L, Elashoff RM, Salusky IB. Coronary-artery calcification in young adults with end-stage renal disease who are undergoing dialysis. N Engl J Med. 2000;342:1478–1483. - PubMed
    1. Schlieper G, Aretz A, Verberckmoes S, et al. Ultrastructural analysis of vascular calcifications in uremia. J Am Soc Nephrol. 2010;21:689–696. - PMC - PubMed
    1. Shroff RC, McNair R, Figg N, Skepper JN, Schurgers L, Gupta A, Hiorns M, Donald AE, Deanfield J, Rees L, Shanahan CM. Dialysis accelerates medial vascular calcification in part by triggering smooth muscle cell apoptosis. Circulation. 2008;118:1748–1757. - PubMed

Publication types

MeSH terms