. 2013 Dec;24(12):1966-80.
doi: 10.1681/ASN.2013010018. Epub 2013 Aug 22.

Albumin is recycled from the primary urine by tubular transcytosis

Affiliations

Albumin is recycled from the primary urine by tubular transcytosis

Verena Tenten et al. J Am Soc Nephrol. 2013 Dec.

Abstract

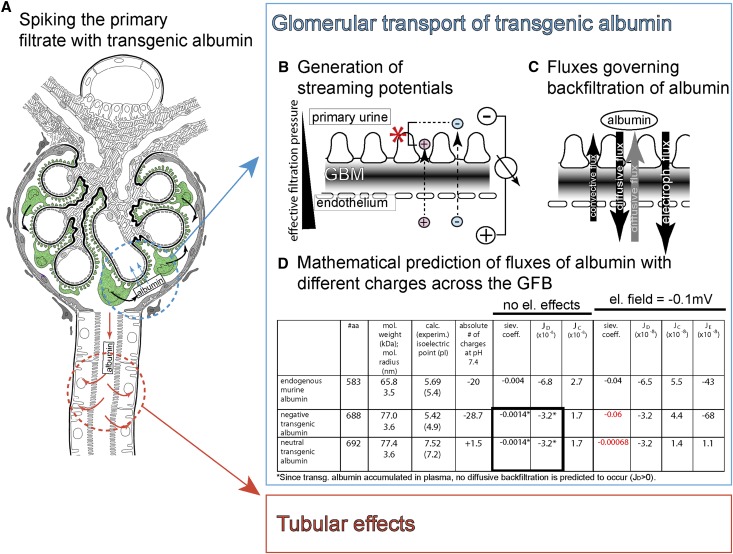
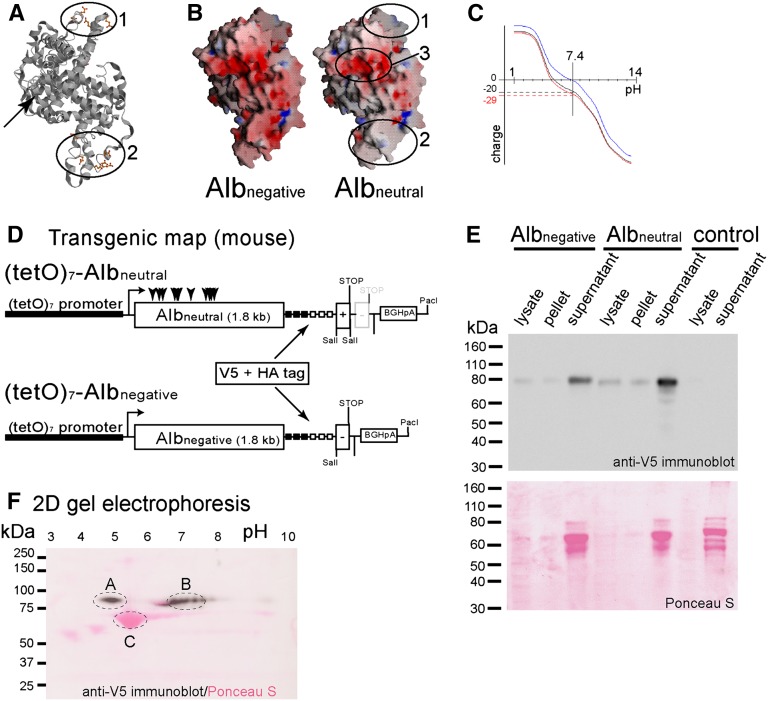
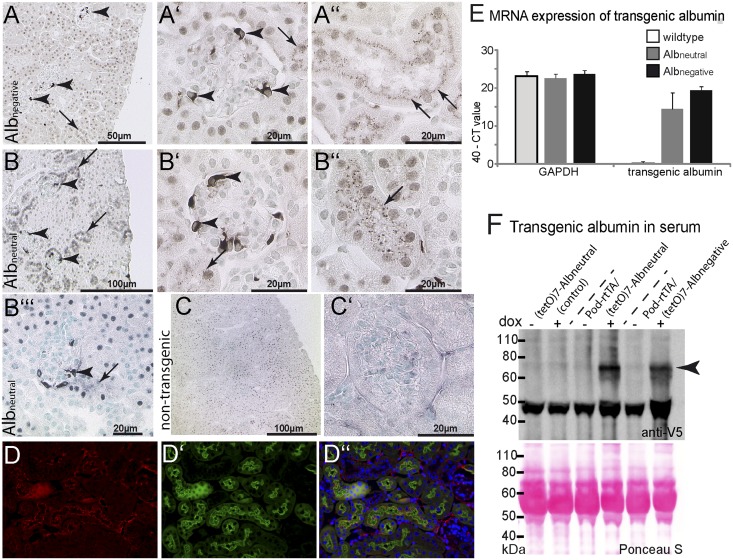
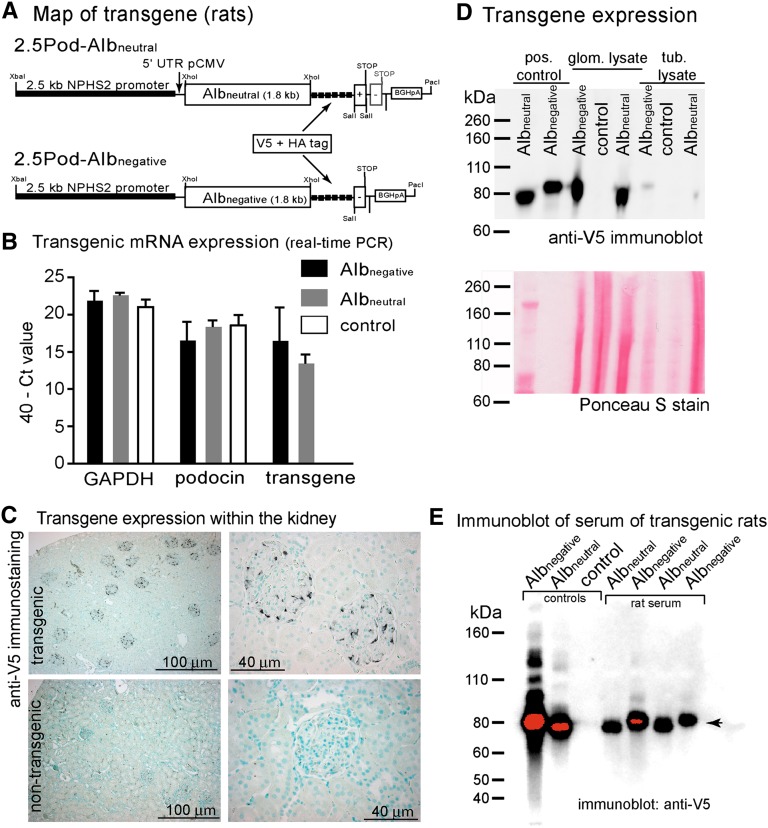
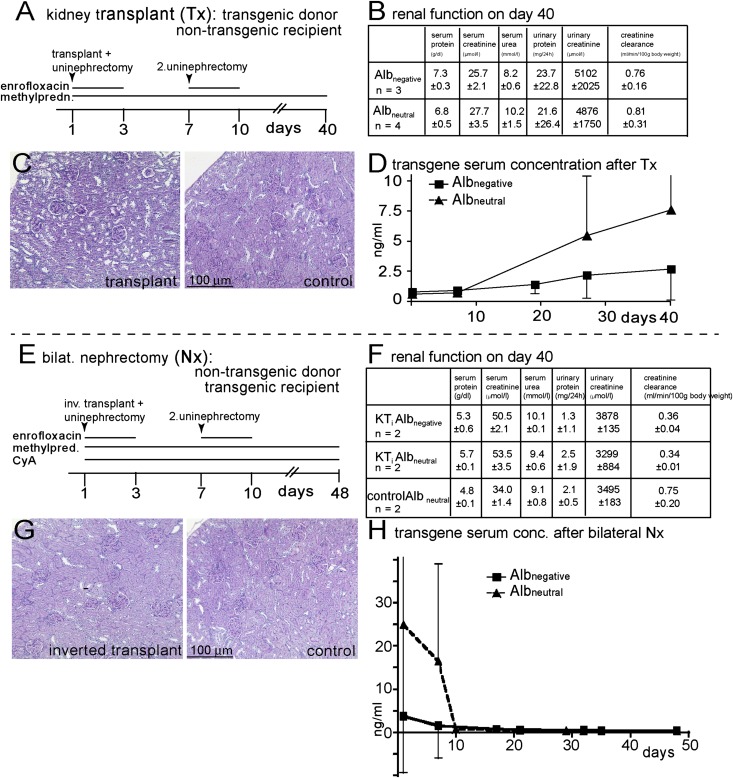
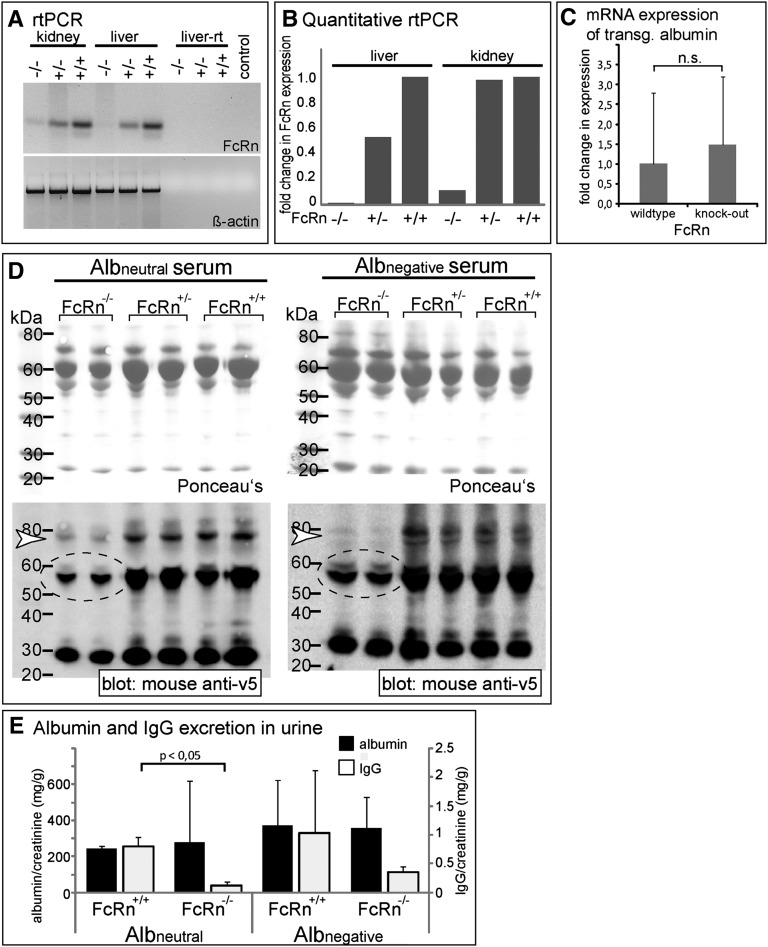
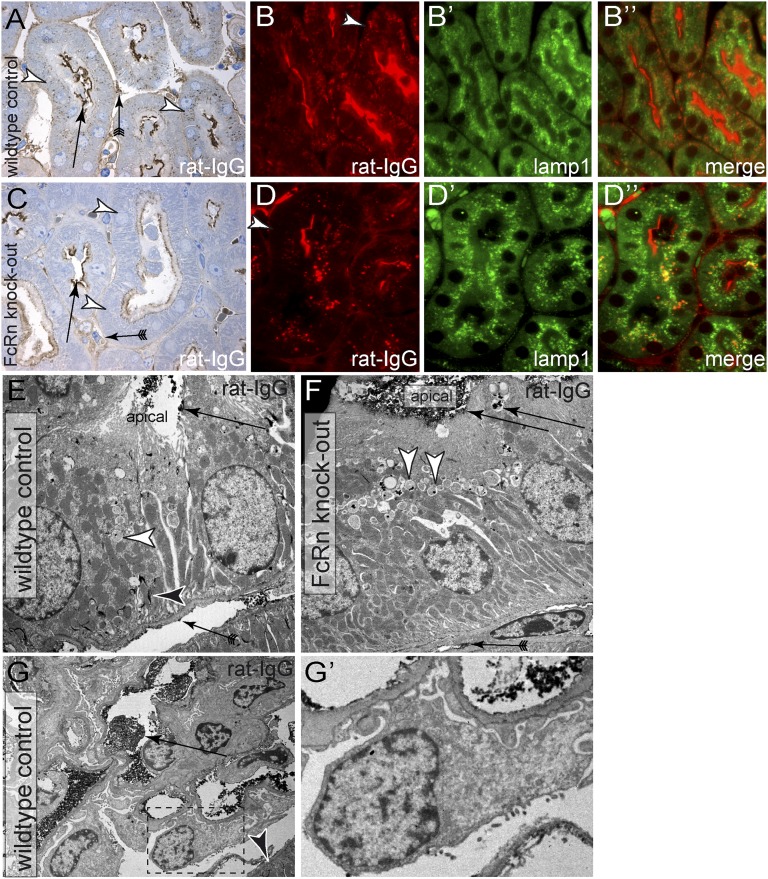
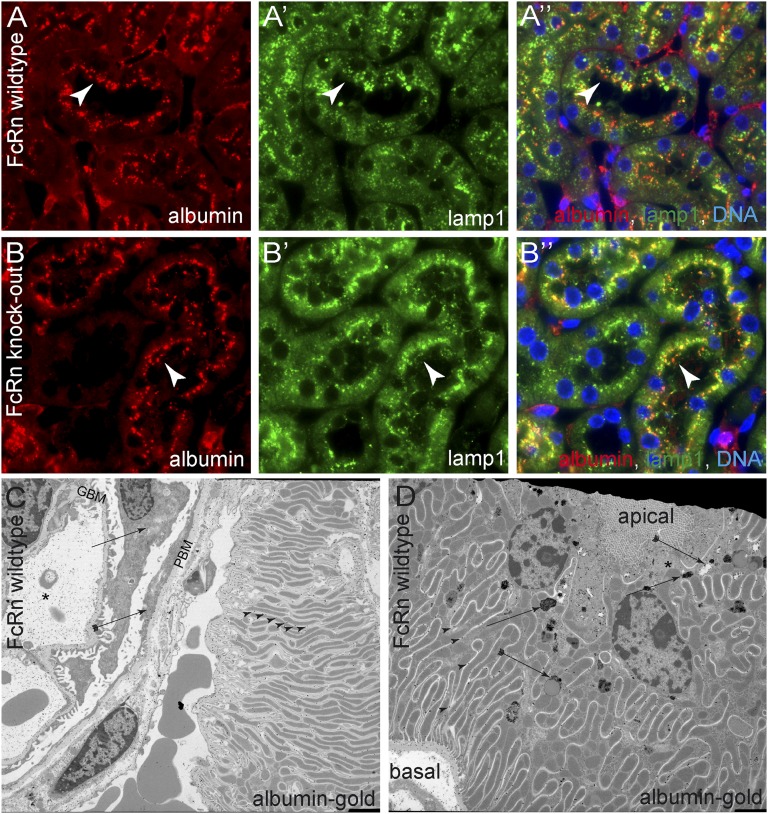
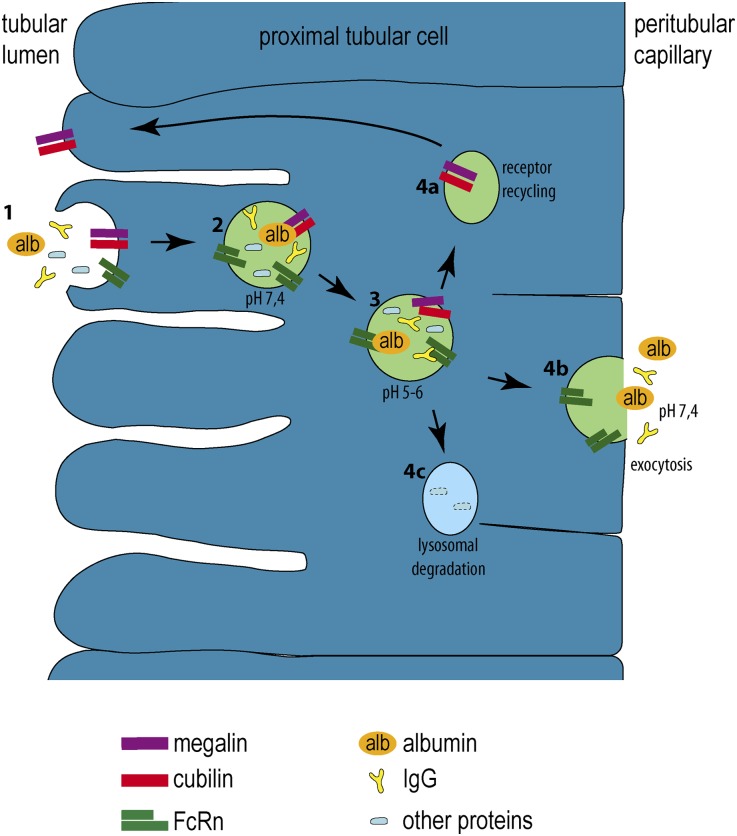
Under physiologic conditions, significant amounts of plasma protein pass the renal filter and are reabsorbed by proximal tubular cells, but it is not clear whether the endocytosed protein, particularly albumin, is degraded in lysosomes or returned to the circulatory system intact. To resolve this question, a transgenic mouse with podocyte-specific expression of doxycycline-inducible tagged murine albumin was developed. To assess potential glomerular backfiltration, two types of albumin with different charges were expressed. On administration of doxycycline, podocytes expressed either of the two types of transgenic albumin, which were secreted into the primary filtrate and reabsorbed by proximal tubular cells, resulting in serum accumulation. Renal transplantation experiments confirmed that extrarenal transcription of transgenic albumin was unlikely to account for these results. Genetic deletion of the neonatal Fc receptor (FcRn), which rescues albumin and IgG from lysosomal degradation, abolished transcytosis of both types of transgenic albumin and IgG in proximal tubular cells. In summary, we provide evidence of a transcytosis within the kidney tubular system that protects albumin and IgG from lysosomal degradation, allowing these proteins to be recycled intact.


Figures

Figure 1.
Figure 1.
Concept of spiking the primary filtrate with transgenic albumin and estimation of glomerular backfiltration. (A) The primary filtrate can be spiked with transgenic albumin by driving expression specifically within podocytes (green; black arrows, secretion of transgenic albumin into the primary filtrate). (B) Concept of streaming potentials. Within the glomerulus, an electrical field (streaming potential) is generated across the glomerular filtration barrier by filtration. Small plasma ions (Na+, Cl, HCO3 , or Ca++, etc.) interact with the charged filter during the filtration process and as a consequence, pass the filter with different speeds, generating a potential difference., (C) Three fluxes influence glomerular backfiltration of transgenic albumin: convection, diffusion (gray arrow; can also be oriented to the urine if transgenic albumin accumulated within the plasma), and electrophoresis (driven by the electrical field). (D) Mathematical estimations of the sieving coefficient of transgenic albumin from the primary filtrate into the capillary lumen with and without considering an electrical field across the glomerular filtration barrier (mathematical equations derived from ref. 24). dPI; GBM.
Figure 2.
Figure 2.
Characterization of tagged murine albumins with different charge. (A) Structure of wild-type mouse albumin. In two patches (1 and 2), negatively charged amino acids exposed to the surface of the molecule were mutated. The C terminus projects to the rear (arrow). (B) Electrostatic surface potential of negative (Albnegative) and neutralized albumin (Albneutral). The negative surface charge (red) was removed from patches 1 and 2. Mutation of a third negatively charged patch (3) caused precipitation of the molecule (not shown). (C) Predicted titration curve for wild-type albumin (black), Albnegative (red), and Albneutral (blue). At a physiologic pH of 7.4, Albnegative (red) is predicted to bear 29 negative charges. Albneutral is predicted to be close to neutral. (D) Transgenic map of the constructs used for pronuclear injection. (E) African green monkey kidney fibroblast (COS-7) cells were transiently transfected with both transgenic albumins. Controls were transfected with pcDNA3.1 only. After ultracentrifugation of the supernatants, corresponding amounts of the pellet and cellular lysates were subjected to SDS-PAGE and immunoblotting using V5 antiserum. Both negative and neutral transgenic albumin were detected predominantly within the supernatant as 80 kDa bands, indicating that both proteins were soluble and efficiently secreted. The prominent bands of 66 kDa on Ponceau S staining represent fetal calf albumin present in the culture media. (F) Two-dimensional gel electrophoresis (overlay of Ponceau S stain and immunoblot). (A) Albnegative and (B) Albneutral were mixed, subjected in equal amounts to two-dimensional gel electrophoresis (first dimension, isoelectric focusing [pH range 3–10]; second dimension, SDS-PAGE), and immunoblotted using an anti-V5 antiserum. (C) Unmodified BSA is visualized on the Ponceau S stain. Compared with BSA, (A) Albnegative has a higher molecular weight, and the isoelectric point is shifted to a lower pH as predicted. The isoelectric point of (B) Albneutral is shifted close to neutral.
Figure 3.
Figure 3.
Tracing transgenic albumin within the kidney. (A–C) Transgene expression was observed in a mosaic fashion in podocytes of both Pod-rtTA/Albnegative and/Albneutral mice (arrowheads in A–B″′). In both lines, transgenic albumin was also detected in apical granules within proximal tubular cells (arrows). (C and C′) No specific staining was observed in nontransgenic controls after induction dox. (A–C′) Immunohistochemical anti-V5 staining on paraffin sections. (D) When costaining for LTA FITC, transgenic albumin was detected in a granular pattern along the apical aspect within proximal tubular cells. (E) Expression of transgenic albumin mRNA was determined relative to endogenous glyceraldehyde-3-phosphate dehydrogenase (GAPDH) in whole-kidney lysates by Taqman analysis using a transgen-specific probe. Data of six mice per group (wild type, Albneutral, and Albnegative) are shown as 40− Ct value, whereas a Ct value of 40 indicates that no PCR product was amplified. The difference in mRNA expression between Albneutral and Albnegative was not significant. (F) Detection of both transgenic albumins in the serum of transgenic POD-rtTA/Albneutral or Albnegative mice. Immunoblot analysis of sera of transgenic animals compared with their nontransgenic littermates before and on administration of dox. On administration of dox, V5-tagged albumin could be detected exclusively in the serum of double transgenic Albneutral or Albnegative mice.
Figure 4.
Figure 4.
Characterization of transgenic rats. (A) Map of the transgenic constructs. The 2.5-kb NPHS2 promoter was used to drive expression of either neutralized or negative murine albumin (identical to the transgene used in mice). The 5′ untranslated region (UTR) of the cytomegaly virus promoter and the polyadenylation signal of bovine growth hormone was used (BGHpA) to enhance expression. (B) mRNA expression in sieved glomeruli relative to the endogenous genes GAPDH and podocin as qualitatively determined by RT-PCR. Data are given as 40− Ct value. Ct value indicates the number of cycles until the fluorescence signal reached the threshold. A Ct value of 40 cycles indicates that the fluorescence signal did not reach the threshold until cycle 40, and therefore, no PCR product was amplified. (C) The transgene expression within the kidney was verified by anti-V5 immunohistological staining (methyl green counterstain). In representative images of Albneutral transgenic animals, a specific staining was observed exclusively within the glomeruli (identical images were obtained for Albnegative animals). No reactivity was observed in nontransgenic controls. (D) SDS-PAGE and anti-V5 immunoblotting of glomerular and tubular lysates. Recombinant albumin within the supernatant of transiently transfected African green monkey kidney fibroblast (COS-7) cells served as positive control. Within glomerular lysates, a distinct band of the predicted size was observed in transgenic animals for either construct. No band was observed in nontransgenic controls. In tubular lysates, a weak signal of intact transgenic albumin could be observed. Nonspecific labeling of heavy and light chain of murine Ig is observed in the serum at 55 and 28 kDa. Loading was verified by a Ponceau S stain. (E) Immunoblot of serum from transgenic Albneutral and Albnegative rats (two samples each). Controls from supernatants of transfected HEK293 cells were loaded on the left. Intact transgenic albumin is detected in similar amounts in transgenic rats (arrowhead).
Figure 5.
Figure 5.
Reciprocal kidney transplantation experiments in transgenic rats. (A) Experimental design where the kidneys of seven transgenic rats (from different found lines) were transplanted into nontransgenic recipients. (B) Renal function test before euthanization showed no abnormalities. (C) Renal histology of the transplanted kidneys was normal in all seven rats. (D) Concentrations of transgenic albumin in the serum as determined by ELISA showed a progressive increase over time. (E) In the reverse experiment, nontransgenic allogenic kidneys were transplanted into transgenic recipients of different founder lines, which were subsequently nephrectomized. (F and G) Renal function tests and histology again showed no abnormalities. (H) After the second nephrectomy, transgenic albumin concentrations fell rapidly below detection levels, indicating that the transgenic albumin was not derived from an extrarenal source.
Figure 6.
Figure 6.
FcRn is essential for transcytosis. (A) mRNA expression is significantly decreased in FcRn-deficient mice (Fcgrttm1dcr) as estimated by RT-PCR from total RNA. β-Actin controls show cDNA loading and quality. (B) Quantification was performed by real-time RT­­-PCR. The fold change in gene expression relative to a mean of wild-type liver/kidney was calculated using the ΔΔCt method. (C) No influence of FcRn on the expression of transgenic albumin mRNA. mRNA expression of transgenic albumin was performed by real-time RT-PCR in FcRn knockout mice. The fold change in gene expression relative to the mean of wild-type kidney was calculated using the ΔΔCt method (n=6 per group). No significant difference was detected between FcRn knockout and wild-type animals. (D) Immunoblot analysis of sera of Pod-rtTA/Albneutral/FcRn−/− and Pod-rtTA/Albnegative/FcRn−/− mice. Lanes were loaded with 5 µl serum and immunoblotted. In the serum of FcRn-deficient mice, significantly less transgenic albumin was detected (white arrowheads). Likewise, Ig heavy and light chains were decreased in the serum of FcRn-deficient mice (dotted circles), confirming functional inactivation of FcRn in our mouse model., (E) Urinary excretion of endogenous albumin and IgG in FcRn knockout versus wild-type mice was estimated by ELISA (normalized to creatinine concentrations). No significant differences were observed, although a decreased urinary excretion of IgG was noted in FcRn knockout mice, which is most likely as a consequence of the decreased IgG levels in the serum (n=2 per group).
Figure 7.
Figure 7.
Altered distribution of Ig in tubular cells of FcRn-deficient mice. To test whether tubular handling of Igs is FcRn-dependent, rat anti-APA was injected intravenously into (A–B″) wild-type control littermates or (C–D″) FcRn-deficient mice. After 16 hours, animals were euthanized, and their kidneys were immunostained using rabbit anti-rat IgG-horseradish peroxidase. (A and C) On semithin kidney sections (Toluidin blue counterstain), the rat IgG (anti-APA) was detected within tubulointerstitial capillaries and along the brushborder of proximal tubule cells (arrows) from where it was endocytosed. (A–B″) In wild-type controls, (A, arrowheads) anti-APA distributed in vesicles throughout the entire proximal tubular cells. (B, arrowhead) Basolateral staining was also apparent in immunofluorescent staining. (C) In FcRn-deficient mice, anti-APA remained confined to the apical aspect of proximal tubular cells. (D–D″) This finding was observed in all proximal tubular cells (arrowhead) and confirmed by immunofluorescent staining. (D) Basolateral staining of IgG did not colocalize with lamp1 (marker for late endosomes and lysosomes). (E and F) These findings were confirmed by anti-rat Ig immunoelectron microscopy. Rat Ig was detected within the tubular lumen and bound to the apical brushborder (black precipitates; arrow). (E) In wild-type mice, rat Ig was detected as black precipitates within vesicles throughout the cell (white arrowhead). Along the basolateral aspect of proximal tubular cells, rat IgG accumulated extracellularly within the plasmalemmal infoldings (black arrowhead), consistent with our immunofluorescent staining. (F) In FcRn-deficient mice, rat Ig was detected exclusively within vesicles along the apical aspect of the cells (arrowheads). No rat Ig antigen accumulated along the extracellular basolateral aspect. (E and F) Within the tubulointerstitial capillaries, rat Ig was detected (arrows with tails). Because no rat Ig was detected within the basolateral plasma membrane invaginations (basolatheral labyrinth) of proximal tubular cells in FcRn-deficient mice, it must have reached this location by transcytosis and subsequent exocytosis across the cells. (G and G′) Within the glomeruli of the same mice, podocyte effacement as a consequence of anti-APA was observed. Rat IgG was visualized by immunoelectron microscopy within the glomerular capillary lumen (arrow) and again in the basolateral labyrinth of proximal tubular cells (arrowhead). No significant uptake of rat IgG/anti-APA could be detected in podocytes in either (G and G′) FcRn wild-type or knockout animals (not shown).
Figure 8.
Figure 8.
Subcellular distribution of filtered albumin in proximal tubular cells. (A) In FcRn wild-type mice, endogenous albumin was costained with lamp1 (a marker for late endosomes and lysosomes) in proximal tubular cells. Albumin was localized in a punctate pattern (presumptive resorption vacuoles) along the apical aspect of proximal tubular cells (arrowheads). Partial colocalization with lamp1 was noted. (B) In FcRn knockout mice, the distribution of endogenous albumin within resorption vesicles and lamp1-positive vesicles was similar to wild-type mice (arrowheads). (C) To trace filtered albumin on ultrastructural levels, mice were injected intravenously with gold-labeled BSA (albumin gold) and analyzed 15 minutes later. Glomerular capillaries (asterisk) and the GBM contained significant amounts of albumin gold, whereas no significant uptake was observed in podocytes (arrow). Small quantities of albumin gold were present in parietal epithelial cells (arrow with tail). High amounts of albumin gold were found within the extracellular plasmalemmal infoldings of the basolateral labyrinth of proximal tubular cells (arrowheads). (D) Apico/basal cross-section across a proximal tubular cell of a mouse injected with albumin gold. As observed by immunofluorescent staining, resorption vesicles on the apical aspect of the cell contain gold particles in different concentrations (arrows). The distribution of gold particles seemed polarized in some vesicles (consistent with a potential sorting process; arrows with tails). Throughout the entire basolateral labyrinth, gold particles were present extracellularly. In contrast to the tracing experiments with rat IgG (see below), albumin gold no longer accumulated within the basolateral labyrinth, explaining why no basolateral staining was obvious by immunofluorescence (A and B). Note that the basolateral plasmalemmal invaginations (labyrinth) reached up to the apical aspect of the cell where the resorption vesicles were localized (asterisk). GBM, glomerular basement membrane; PBM, parietal basement membrane.
Figure 9.
Figure 9.
Schematic for transcytosis in proximal tubular cells. (1) From the tubular lumen, albumin (alb, orange), IgG (yellow), and other proteins (blue) are bound to the brushborder of proximal tubular cells through the cubilin/megalin complex. (2 and 3) Acidification in early endosomes results in a release of the bound proteins from the cubilin/megalin complex. At a pH of 5–6, albumin and IgG bind to FcRn, whereas other proteins do not. (4a) The cubilin/megalin complex is recycled back to the apical brushborder. (4b) FcRn-bound proteins are sorted to the basolateral aspect of the cell from where they are released. (4c) The remaining proteins are destined for lysosomal degradation.

Comment in

References

    1. Peters T, Jr: Serum albumin: Recent progress in the understanding of its structure and biosynthesis. Clin Chem 23: 5–12, 1977. - PubMed
    1. Haraldsson B, Nyström J, Deen WM: Properties of the glomerular barrier and mechanisms of proteinuria. Physiol Rev 88: 451–487, 2008. - PubMed
    1. Tojo A, Endou H: Intrarenal handling of proteins in rats using fractional micropuncture technique. Am J Physiol 263: F601–F606, 1992. - PubMed
    1. Norden AG, Lapsley M, Lee PJ, Pusey CD, Scheinman SJ, Tam FW, Thakker RV, Unwin RJ, Wrong O: Glomerular protein sieving and implications for renal failure in Fanconi syndrome. Kidney Int 60: 1885–1892, 2001. - PubMed
    1. Christensen EI, Birn H, Rippe B, Maunsbach AB: Controversies in nephrology: Renal albumin handling, facts, and artifacts! Kidney Int 72: 1192–1194, 2007. - PubMed

Publication types

MeSH terms