. 2013;15(4):R68.
doi: 10.1186/bcr3462.

Estrogen receptor negative/progesterone receptor positive breast cancer is not a reproducible subtype

Estrogen receptor negative/progesterone receptor positive breast cancer is not a reproducible subtype

Marco M Hefti et al. Breast Cancer Res. 2013.

Abstract

Introduction: Estrogen receptor (ER) and progesterone receptor (PR) testing are performed in the evaluation of breast cancer. While the clinical utility of ER as a predictive biomarker to identify patients likely to benefit from hormonal therapy is well-established, the added value of PR is less well-defined. The primary goals of our study were to assess the distribution, inter-assay reproducibility, and prognostic significance of breast cancer subtypes defined by patterns of ER and PR expression.

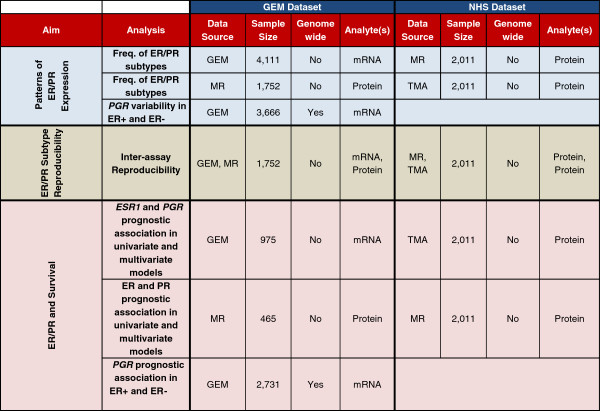
Methods: We integrated gene expression microarray (GEM) and clinico-pathologic data from 20 published studies to determine the frequency (n = 4,111) and inter-assay reproducibility (n = 1,752) of ER/PR subtypes (ER+/PR+, ER+/PR-, ER-/PR-, ER-/PR+). To extend our findings, we utilized a cohort of patients from the Nurses' Health Study (NHS) with ER/PR data recorded in the medical record and assessed on tissue microarrays (n = 2,011). In both datasets, we assessed the association of ER and PR expression with survival.

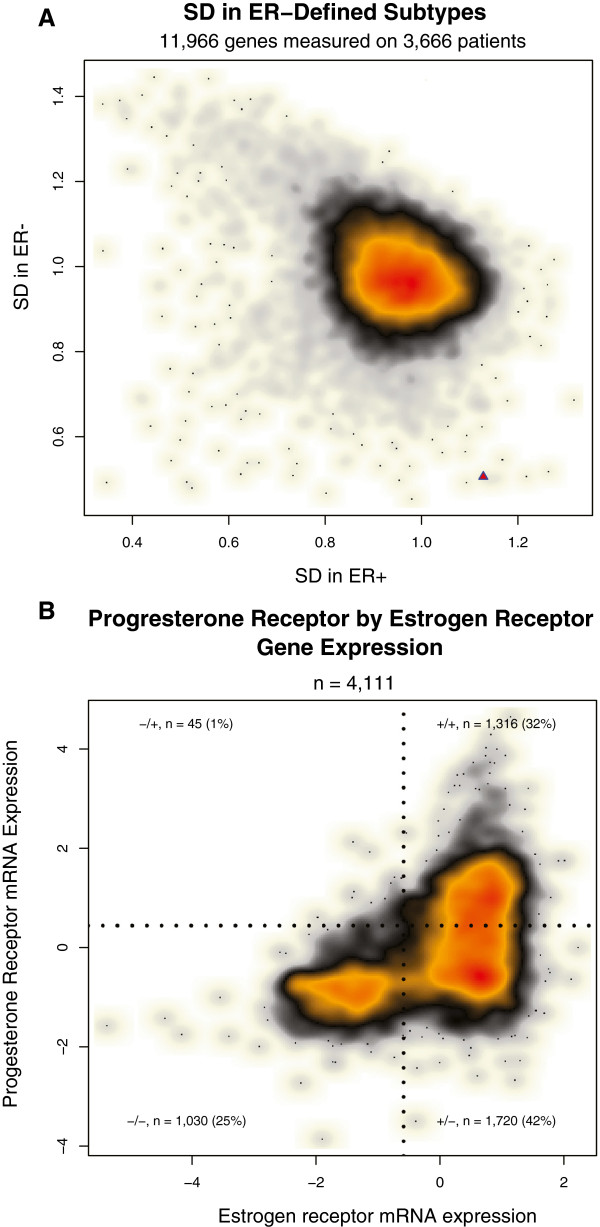
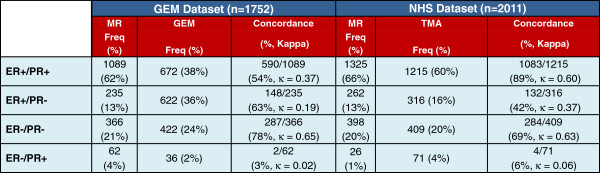
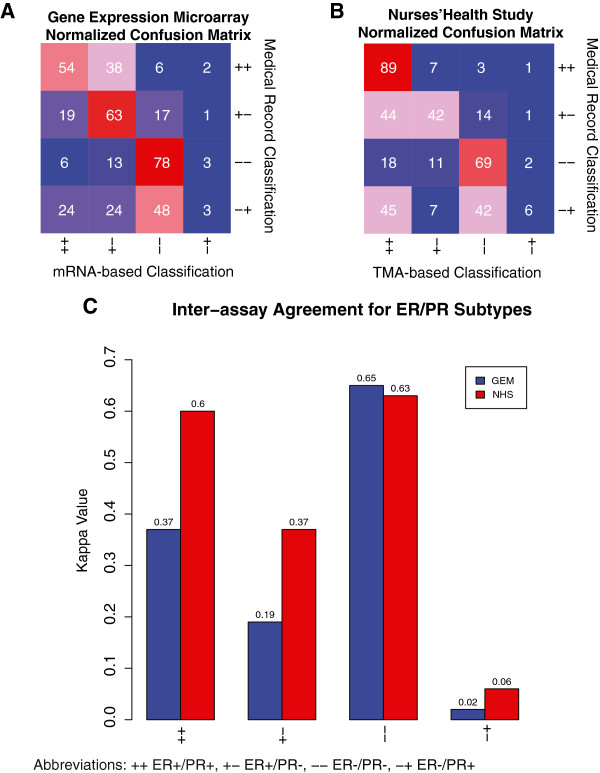
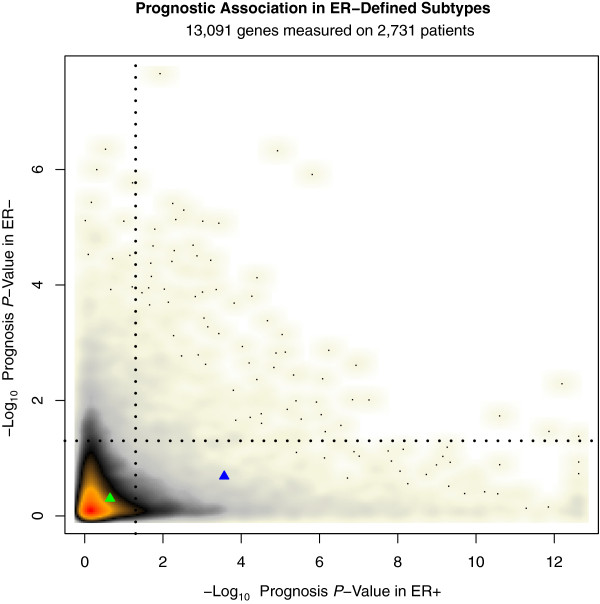
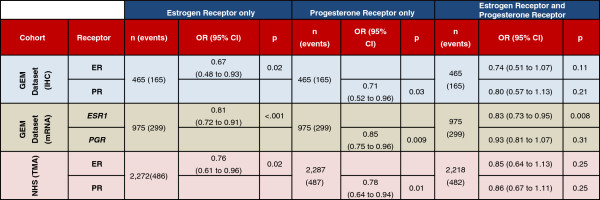
Results: In a genome-wide analysis, progesterone receptor was among the least variable genes in ER- breast cancer. The ER-/PR+ subtype was rare (approximately 1 to 4%) and showed no significant reproducibility (Kappa = 0.02 and 0.06, in the GEM and NHS datasets, respectively). The vast majority of patients classified as ER-/PR+ in the medical record (97% and 94%, in the GEM and NHS datasets) were re-classified by a second method. In the GEM dataset (n = 2,731), progesterone receptor mRNA expression was associated with prognosis in ER+ breast cancer (adjusted P <0.001), but not in ER- breast cancer (adjusted P = 0.21). PR protein expression did not contribute significant prognostic information to multivariate models considering ER and other standard clinico-pathologic features in the GEM or NHS datasets.

Conclusion: ER-/PR+ breast cancer is not a reproducible subtype. PR expression is not associated with prognosis in ER- breast cancer, and PR does not contribute significant independent prognostic information to multivariate models considering ER and other standard clinico-pathologic factors. Given that PR provides no clinically actionable information in ER+ breast cancer, these findings question the utility of routine PR testing in breast cancer.


Figures

Figure 1
Figure 1
Overview of study design and analyses performed. MR, medical record; GEM, gene expression microarray; TMA, tissue microarray.
Figure 2
Figure 2
Analyses of estrogen receptor and progesterone receptor mRNA expression in breast cancer. A: Genome-wide analysis of expression variability in ER+ and ER- breast cancer. This smoothed scatterplot shows the distribution of 11,966 genes plotted based on their variability in mRNA levels in ER+ breast cancer (X axis) and ER- breast cancer (Y axis). The color represents the density of genes and ranges from white > beige > gray > black > orange > red, with red the most dense and white the most sparse. We computed the standard deviation (SD) of each gene within ER+ cases (n = 2,505) and ER- cases (n = 1,161). PGR is represented by a red triangle in the bottom-right portion of the plot, demonstrating that PGR shows highly variable expression in ER+ breast cancer (Ranked 157th out of 11,966 genes, 1.3th percentile). Conversely, PGR is one of the least variable genes in ER- breast cancer (Ranked 11,957th out of 11,966 genes, 99.9th percentile). B: Estrogen receptor and progesterone receptor mRNA expression in GEM dataset. This smoothed scatterplot shows the distribution of 4,111 breast tumors. Each tumor is plotted based on its ESR1 expression level (X-Axis) and PGR expression level (Y-Axis). The color represents the data density and ranges from white > beige > gray > black > orange > red, with red the most dense and white the most sparse. The jagged black lines represent the cut-points for converting the continuous mRNA values into a positive/negative binary score. The cut-points used were −1.3 and 0.4 for ESR1 and PGR, respectively. Based on these classification boundaries, 1,316 (32%) of cases were classified as ER+/PR+ (+/+), 1720 (42%) as ER+/PR- (+/−), 1,030 (25%) as ER-/PR- (−/−), and 45 (1%) as ER-/PR+ (−/+).
Figure 3
Figure 3
ER and PR subtype frequency and inter-assay concordance. MR, medical record; GEM, gene expression microarray; TMA, tissue microarray.
Figure 4
Figure 4
Inter-assay agreement confusion matrices for ER/PR subtypes. A and B present 4 × 4 confusion matrices. A: Gene Expression Microarray (GEM) Dataset. The row and columns indicate the ER/PR classifications made in the medical record from the GEM dataset (rows) and by mRNA (columns). The value in each cell in the matrix indicates the proportion of the row’s subtype that was classified in the column’s subtype. The color represents the proportion agreement from blue (low) to red (high). B: Nurses’ Health Study (NHS) Dataset. This confusion matrix is similar to that described in A, but the rows represent the ER/PR classifications from the medical record in the NHS dataset and the columns represent the classifications made from the NHS TMA analysis. C: Kappa Values for the gene expression microarray (GEM) and Nurses’ Health Study (NHS) datasets.
Figure 5
Figure 5
Genome-wide survival analysis stratified by ER status. This smoothed scatterplot shows the distribution of the prognostic association of 13,091 genes in ER+ (X-axis) and ER- (Y-axis) breast cancer. The P-values plotted have been corrected for multiple hypothesis testing using the method of Benjamini and Hochberg [25]. The color represents the density of genes and ranges from white > beige > gray > black > orange > red, with red the most dense and white the most sparse. The dotted black lines represent a significance threshold of adjusted P = 0.05. The blue triangle represents PGR and the green triangle represents ESR1. PGR expression is associated with prognosis in ER+ breast cancer; however, 727 genes are more prognostic than PR with the most prognostic genes showing a prognostic association to the significance level of P <1 × 10¹² as compared with the prognostic significance level of 3 × 10⁻⁴ achieved by PR.
Figure 6
Figure 6
Cox regression to overall survival. The multivariate regression analyses to overall survival for the gene expression microarray (GEM) dataset are adjusted for nodal status, size, age and grade. Nurse’s Health Study (NHS) data are adjusted for age, year of diagnosis, treatment, stage and grade. Tumor size is measured in centimeters; nodal status is recorded as positive versus negative. IHC, immunohistochemistry; OR, odds ratio; TMA, tissue microarray.

References

    1. Hammond ME, Hayes DF, Dowsett M, Allred DC, Hagerty KL, Badve S, Fitzgibbons PL, Francis G, Goldstein NS, Hayes M, Hicks DG, Lester S, Love R, Mangu PB, McShane L, Miller K, Osborne CK, Paik S, Perlmutter J, Rhodes A, Sasano H, Schwartz JN, Sweep FC, Taube S, Torlakovic EE, Valenstein P, Viale G, Visscher D, Wheeler T, Williams RB. et al.American Society of Clinical Oncology/College of American Pathologists guideline recommendations for immunohistochemical testing of estrogen and progesterone receptors in breast cancer. J Clin Oncol. 2010;15:2784–2795. doi: 10.1200/JCO.2009.25.6529. - DOI - PMC - PubMed
    1. Olivotto IA, Truong PT, Speers CH, Bernstein V, Allan SJ, Kelly SJ, Lesperance ML. Time to stop progesterone receptor testing in breast cancer management. J Clin Oncol. 2004;15:1769–1770. doi: 10.1200/JCO.2004.99.251. - DOI - PubMed
    1. Colozza M, Larsimont D, Piccart MJ. Progesterone receptor testing: not the right time to be buried. J Clin Oncol. 2005;15:3867–3868. doi: 10.1200/JCO.2005.05.167. author reply 3869–3870. - DOI - PubMed
    1. Fuqua SA, Cui Y, Lee AV, Osborne CK, Horwitz KB. Insights into the role of progesterone receptors in breast cancer. J Clin Oncol. 2005;15:931–932. doi: 10.1200/JCO.2005.05.152. author reply 932–933. - DOI - PubMed
    1. Horwitz KB, Koseki Y, McGuire WL. Estrogen control of progesterone receptor in human breast cancer: role of estradiol and antiestrogen. Endocrinology. 1978;15:1742–1751. doi: 10.1210/endo-103-5-1742. - DOI - PubMed

Publication types