. 2013 Aug 20;105(4):872-9.
doi: 10.1016/j.bpj.2013.06.045.

Yield strength of human erythrocyte membranes to impulsive stretching

Affiliations

Yield strength of human erythrocyte membranes to impulsive stretching

Fenfang Li et al. Biophys J. .

Abstract

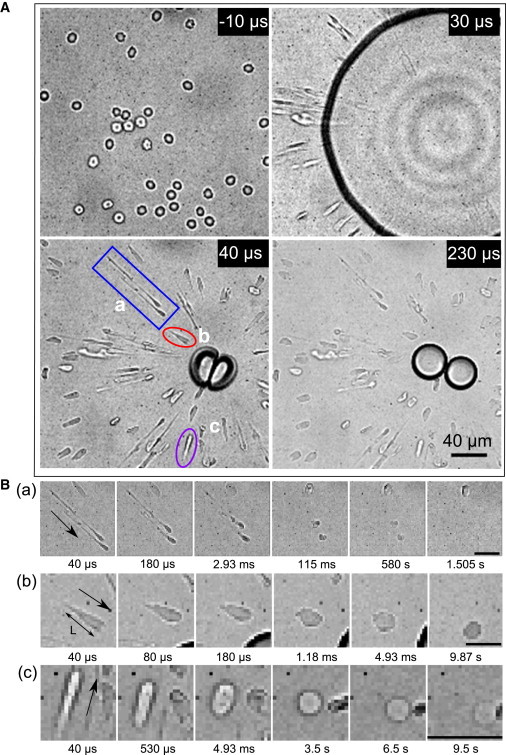
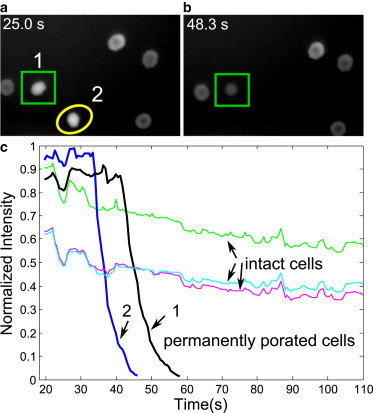
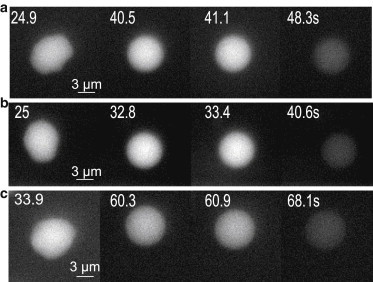
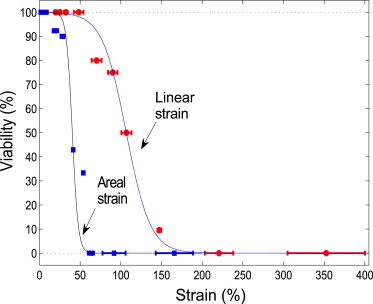
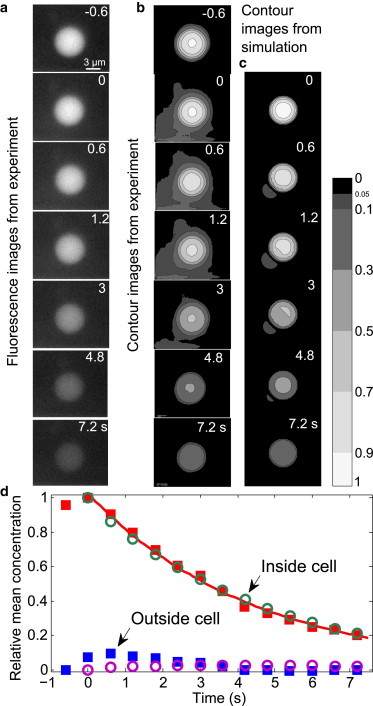
Deformability while remaining viable is an important mechanical property of cells. Red blood cells (RBCs) deform considerably while flowing through small capillaries. The RBC membrane can withstand a finite strain, beyond which it ruptures. The classical yield areal strain of 2-4% for RBCs is generally accepted for a quasi-static strain. It has been noted previously that this threshold strain may be much larger with shorter exposure duration. Here we employ an impulse-like forcing to quantify this yield strain of RBC membranes. In the experiments, RBCs are stretched within tens of microseconds by a strong shear flow generated from a laser-induced cavitation bubble. The deformation of the cells in the strongly confined geometry is captured with a high-speed camera and viability is successively monitored with fluorescence microscopy. We find that the probability of cell survival is strongly dependent on the maximum strain. Above a critical areal strain of ∼40%, permanent membrane damage is observed for 50% of the cells. Interestingly, many of the cells do not rupture immediately and exhibit ghosting, but slowly obtain a round shape before they burst. This observation is explained with structural membrane damage leading to subnanometer-sized pores. The cells finally lyse from the colloidal osmotic pressure imbalance.


Figures

Figure 1
Figure 1
(A) RBCs imaged before (−10 μs), during (30 μs), and after the cavitation event (40 μs and 230 μs). Here time t = 0 is set as the time when the cavitation bubble is created. (B) (ac) Enlarged areas demonstrating the shape recovery of the individual cells marked in panel A with ac, respectively. The timings below indicate the elapsed time after the bubble is created. (a) The long tethered cells, which disappear gradually. In panel B (b), L is the major length used for calculating linear strain. Area of the cell contour is used to define the areal strain. (c) A cell that relaxes and then disappears at the end of high-speed recording. (In each case, arrows indicate the direction toward the bubble center.) All of the scale bars denote 20 μm.
Figure 2
Figure 2
Monitoring the integrity of cell membrane with fluorescence imaging. (a and b) The fluorescence images taken for the same cells at 25 and 48.3 s after the bubble-induced stretching, respectively. The cells marked in panel a are disappearing (denoting permanently porated cells). (c) Variation of fluorescence intensity with time for permanently porated cells and intact cells from the same experiment shown in panel a. (The arrows labeled with 1 and 2 point toward the permanently porated cells marked by a rectangle and a circle in panel a, respectively.) (Right) Three cells showing a mild reduction of intensity due to fluorescence bleaching (intact cells). Here all the timings indicate the time elapsed after collapse of the bubble.
Figure 3
Figure 3
Change of the shape and fluorescence intensity for the individual fast leaking cells. (a and b) The cells marked by 1 and 2 in Fig. 2a, respectively. (c) Permanently porated cell from another experiment. Here all the timings indicate the time elapsed after collapse of the bubble.
Figure 4
Figure 4
Viable cells (in percentage) as a function of the linear (circle) and/or areal (square) strain. The data has been collected from 93 cells through 12 measurements. (Circles and squares) Experimental data, demonstrating the viability versus the mean value of each strain range; error bars denote standard deviation. (Solid lines) Fits to a tanh function.
Figure 5
Figure 5
Illustration of the detailed process for the leakage of fluorescence dye from the permanently porated cells shown in Fig. 2. The exemplary cell shown here is the one labeled by 2 in Fig. 2a. (a) Fluorescence images from experiment for the time from t = −0.6 to t = 7.2 s. The moment t = 0 is defined as the time just after the leakage starts. (b) Contour images of the experimental column in panel a with a color bar indicating the contour levels for intensity/concentration (brighter color indicates higher fluorescence intensity/concentration). The contour levels are set as 0, 0.05, 0.1, 0.3, 0.5, 0.7, 0.9, and 1. (c) Contour images from the three-dimensional diffusion simulation with an effective pore diameter of 1.6 μm. The same color coding is used as in panel b. (d) The relative mean fluorescence intensity/concentration as a function of time inside and outside the cell from the experiment (solid squares) and the simulation (open circles). (Solid line) Fit of the experimental data inside the cell to an exponential decay c = 1.028 × exp(−0.2278 × t), where c is the relative mean concentration and t is the time (s). The pore size for simulation is of 1.6 μm diameter.

Comment in

References

    1. Jay A.W.L. Viscoelastic properties of the human red blood cell membrane. I. Deformation, volume loss, and rupture of red cells in micropipettes. Biophys. J. 1973;13:1166–1182. - PMC - PubMed
    1. Jay A.W.L., Rowlands S., Skibo L. The resistance to blood flow in the capillaries. Can. J. Physiol. Pharmacol. 1972;50:1007–1013. - PubMed
    1. La Celle P.L. Alteration of deformability of the erythrocyte membrane in stored blood. Transfusion. 1969;9:238–245. - PubMed
    1. Schachar N.S., Jay A.W., Tyler F.H. Decreased red cell deformability in burn patients. Can. J. Surg. 1974;17:239–243. - PubMed
    1. Nash G.B., O’Brien E., Dormandy J.A. Abnormalities in the mechanical properties of red blood cells caused by Plasmodium falciparum. Blood. 1989;74:855–861. - PubMed

Publication types