. 2013 Aug 20;105(4):1067-78.
doi: 10.1016/j.bpj.2013.06.049.

Detection of cochlear amplification and its activation

Affiliations

Detection of cochlear amplification and its activation

Wei Dong et al. Biophys J. .

Abstract

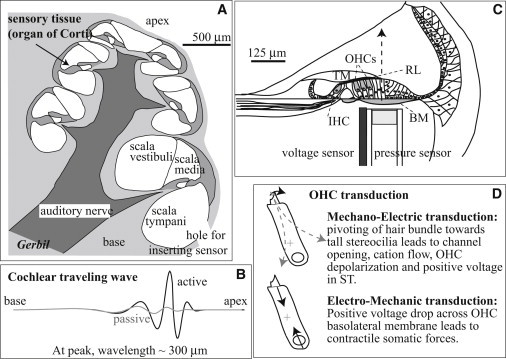
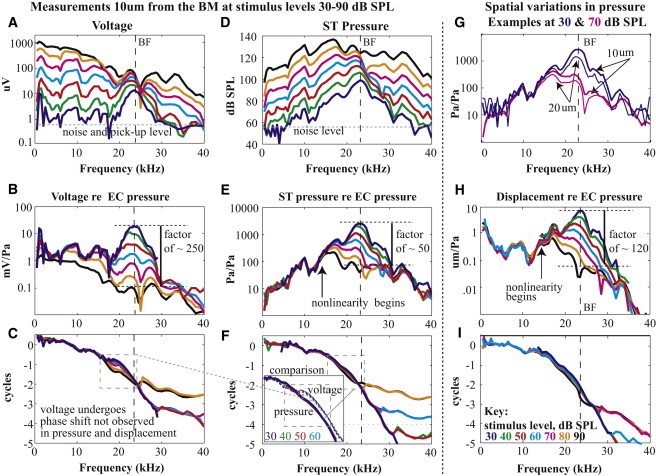
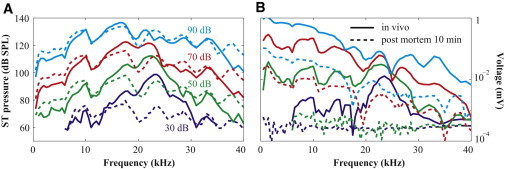
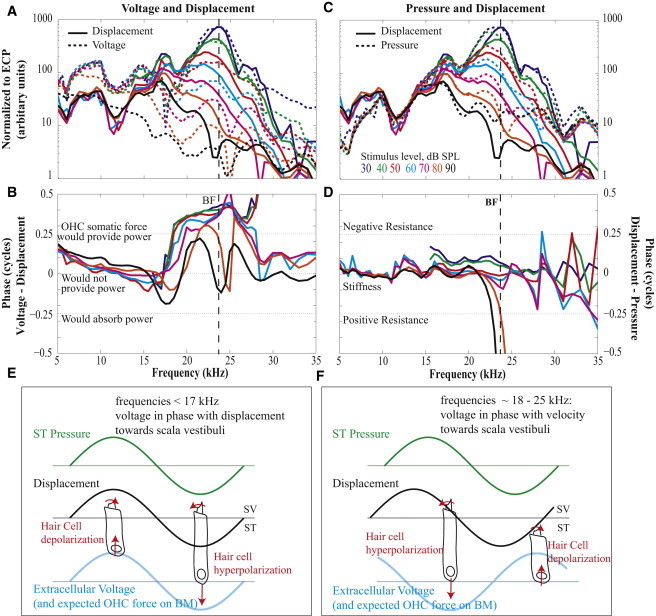
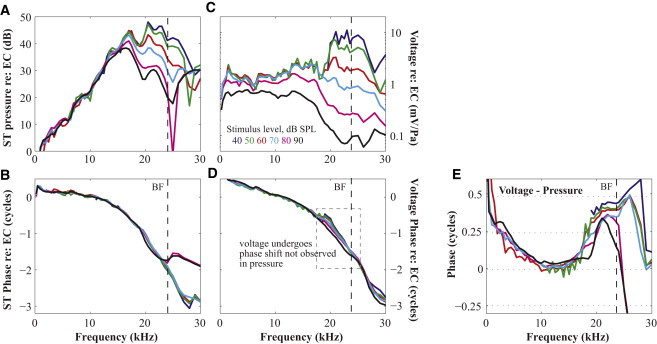
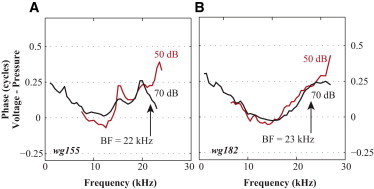
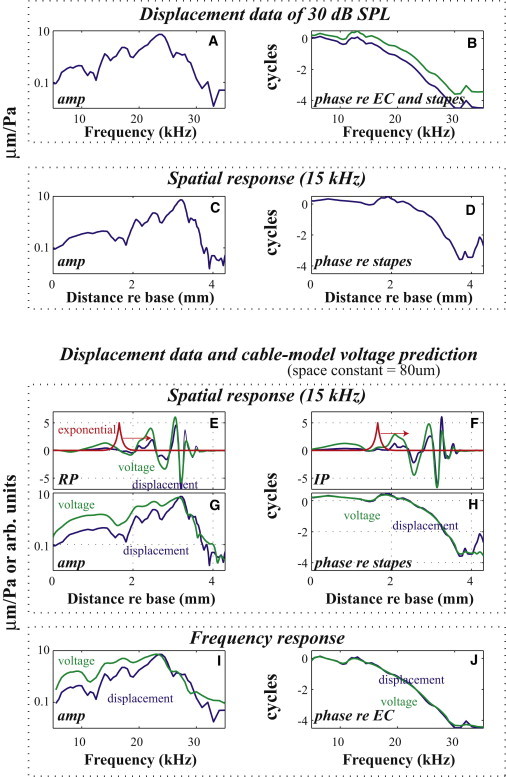
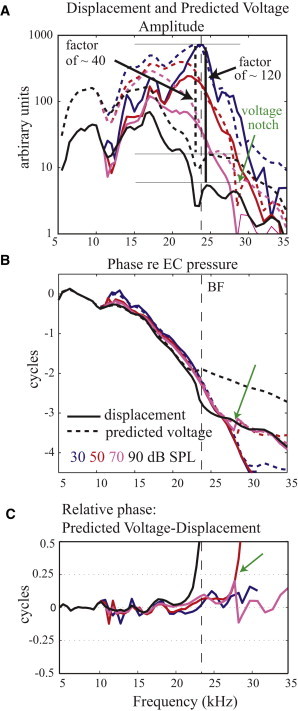
The operation of the mammalian cochlea relies on a mechanical traveling wave that is actively boosted by electromechanical forces in sensory outer hair cells (OHCs). This active cochlear amplifier produces the impressive sensitivity and frequency resolution of mammalian hearing. The cochlear amplifier has inspired scientists since its discovery in the 1970s, and is still not well understood. To explore cochlear electromechanics at the sensory cell/tissue interface, sound-evoked intracochlear pressure and extracellular voltage were measured using a recently developed dual-sensor with a microelectrode attached to a micro-pressure sensor. The resulting coincident in vivo observations of OHC electrical activity, pressure at the basilar membrane and basilar membrane displacement gave direct evidence for power amplification in the cochlea. Moreover, the results showed a phase shift of voltage relative to mechanical responses at frequencies slightly below the peak, near the onset of amplification. Based on the voltage-force relationship of isolated OHCs, the shift would give rise to effective OHC pumping forces within the traveling wave peak. Thus, the shift activates the cochlear amplifier, serving to localize and thus sharpen the frequency region of amplification. These results are the most concrete evidence for cochlear power amplification to date and support OHC somatic forces as its source.


Figures

Figure 1
Figure 1
Experimental approach and cochlear electromechanics. The coiled structure of the mammalian cochlea (shown in cross section in A) is uncoiled in (B) to illustrate the sound-evoked cochlear traveling wave. The sensory hair cells are excited by the relative motion of the RL and TM, which pivots their stereocilia, leading to hair cell current and voltage via mechanoelectric transduction (C and D). BM motion is actively amplified by OHC-based forces via electromechanic transduction (B and D). To explore this synthesis of cell-level electromechanics and tissue-level mechanics, we introduced a dual pressure and voltage sensor into the cochlea’s scala tympani through a small hole in the bone, positioned it close to the BM, and recorded responses to sound stimulation in vivo, in gerbil (A and C). BM and TM = basilar and tectorial membrane, IHC and OHC = inner and outer hair cell, RL = reticular lamina, OC = organ of Corti, ST and SV = scala tympani and vestibuli. Positive displacement is defined as the direction from ST toward SV, along the z axis indicated by the arrow in (C). Voltage was measured relative to a reference electrode inserted into the tissue at the neck.
Figure 2
Figure 2
Characteristics of mechanical and electrical responses measured close to the BM, preparation wg165. The amplitude of voltage (A) and pressure (D) with pure tone stimuli varying from 30 to 90 dB SPL. (G) Pressure response amplitudes 10 and 20 μm from the BM. These and their corresponding phases were used to derive BM displacement. (B, E, and H) Voltage, pressure, and BM displacement amplitude normalized to EC pressure. (C, F, and I) Voltage, pressure, and displacement phase relative to EC pressure. Positive displacement corresponds to BM displacement toward SV (Fig. 1C). The inset in panel F contrasts the pressure and voltage phase in the gray dashed box region of C and F; for clarity high stimulus level results were excluded in the inset.
Figure 3
Figure 3
Physiological vulnerability of pressure and voltage measurements. (A) Amplitude of pressure. (B) Amplitude of voltage. Solid and dashed lines represent conditions in vivo (healthy) and postmortem, respectively. Sound stimulation was 30 to 90 dB in 20 dB steps (wg165).
Figure 4
Figure 4
Comparison of pressure, displacement, and voltage. Pressure and displacement amplitude comparison (A) and relative phase (B). Displacement and voltage amplitude comparison (C) and relative phase (D). Schematic illustration of the phase relationship among pressure, displacement, and voltage at frequencies below the response peak (E) and within the peak (F).
Figure 5
Figure 5
Characteristics of mechanical and electrical responses measured close to the BM in another preparation (wg154). The amplitude of pressure (A) and voltage (C) normalized to the EC pressure showed compressive nonlinearity with pure tone stimuli varying from 40 to 90 dB SPL. Phases of pressure (B) and voltage (D) show typical traveling wave phase accumulation. In D the phase-shift region is within the gray dashed box. Phase difference between voltage and pressure is shown in (E).
Figure 6
Figure 6
Further confirmation of voltage-pressure phase shift. Relative phase between voltage and pressure measured close to the BM in two additional active cochleae also show the phase shift slightly below the BF.
Figure 7
Figure 7
Cable model development. (A and B) Frequency response BM displacement observations. (C and D) Same data recast in the spatial domain. (E and F) Blue curves are the real and imaginary parts (RP and IP) of the spatial response pattern. Red curve shows an exponential function that represents the weighted average of current from OHCs along the cochlea. Green curve is the resulting voltage spatial pattern when the red curve is convolved with the blue. (G and H) Voltage predictions and BM displacement data in the spatial domain. (I and J) Same data recast in the frequency domain. Color on-line only.
Figure 8
Figure 8
Cable model prediction of extracellular voltage. (A) Amplitude; (B) phase; (C) relative phase between voltage and displacement. Solid and dashed lines represent displacement and voltage, respectively. Voltage scale is arbitrary and was the same at all SPLs.

Comment in

References

    1. Rhode W.S. Basilar membrane mechanics in the 6-9 kHz region of sensitive chinchilla cochleae. J. Acoust. Soc. Am. 2007;121:2792–2804. - PubMed
    1. Dallos P., Cheatham M.A. Production of cochlear potentials by inner and outer hair cells. J. Acoust. Soc. Am. 1976;60:510–512. - PubMed
    1. Olson E.S. Observing middle and inner ear mechanics with novel intracochlear pressure sensors. J. Acoust. Soc. Am. 1998;103:3445–3463. - PubMed
    1. Olson E.S. Intracochlear pressure measurements related to cochlear tuning. J. Acoust. Soc. Am. 2001;110:349–367. - PubMed
    1. Ren T. Longitudinal pattern of basilar membrane vibration in the sensitive cochlea. Proc. Natl. Acad. Sci. USA. 2002;99:17101–17106. - PMC - PubMed

Publication types

LinkOut - more resources