. 2013 Aug 22;51(4):409-22.
doi: 10.1016/j.molcel.2013.08.010.

MC1R is a potent regulator of PTEN after UV exposure in melanocytes

Affiliations

MC1R is a potent regulator of PTEN after UV exposure in melanocytes

Juxiang Cao et al. Mol Cell. .

Abstract

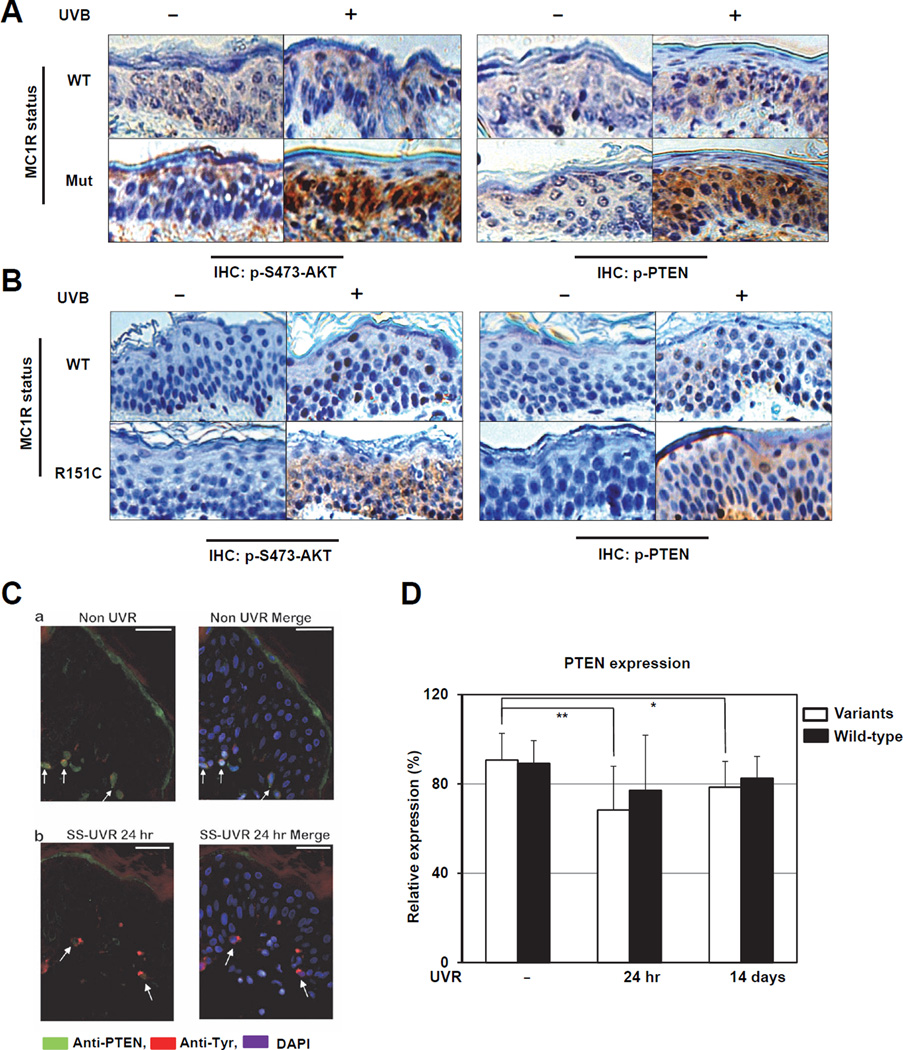
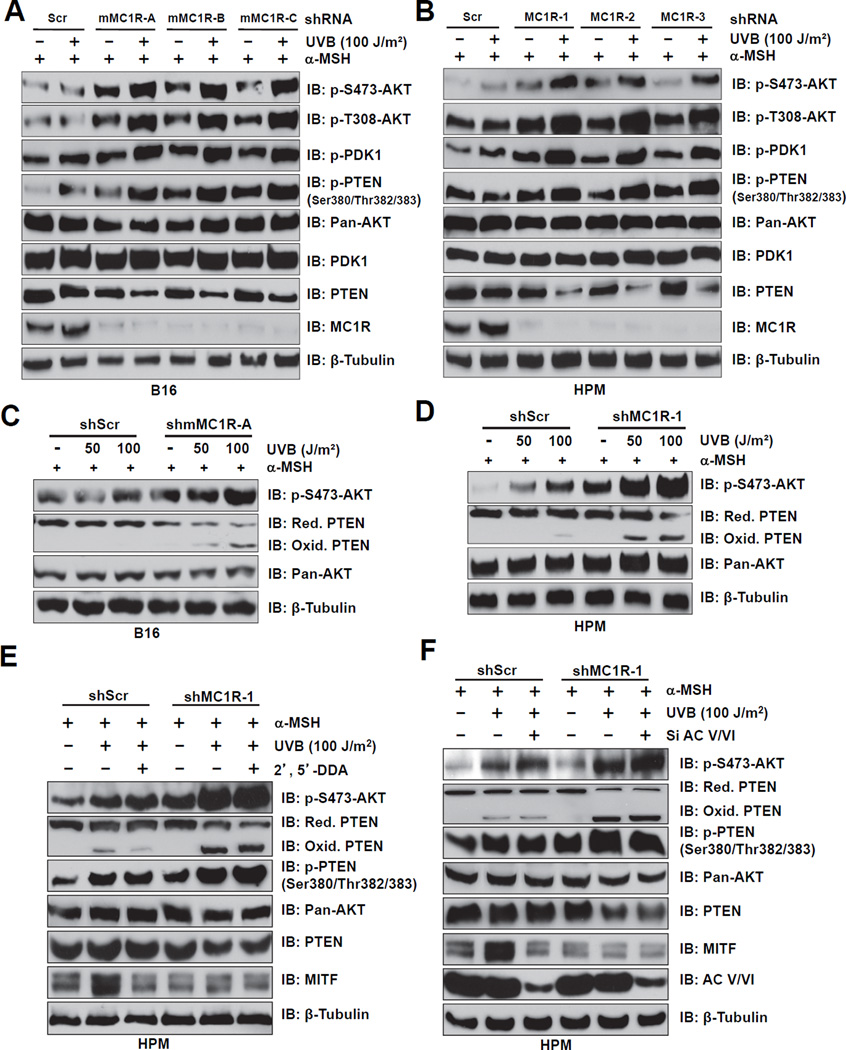
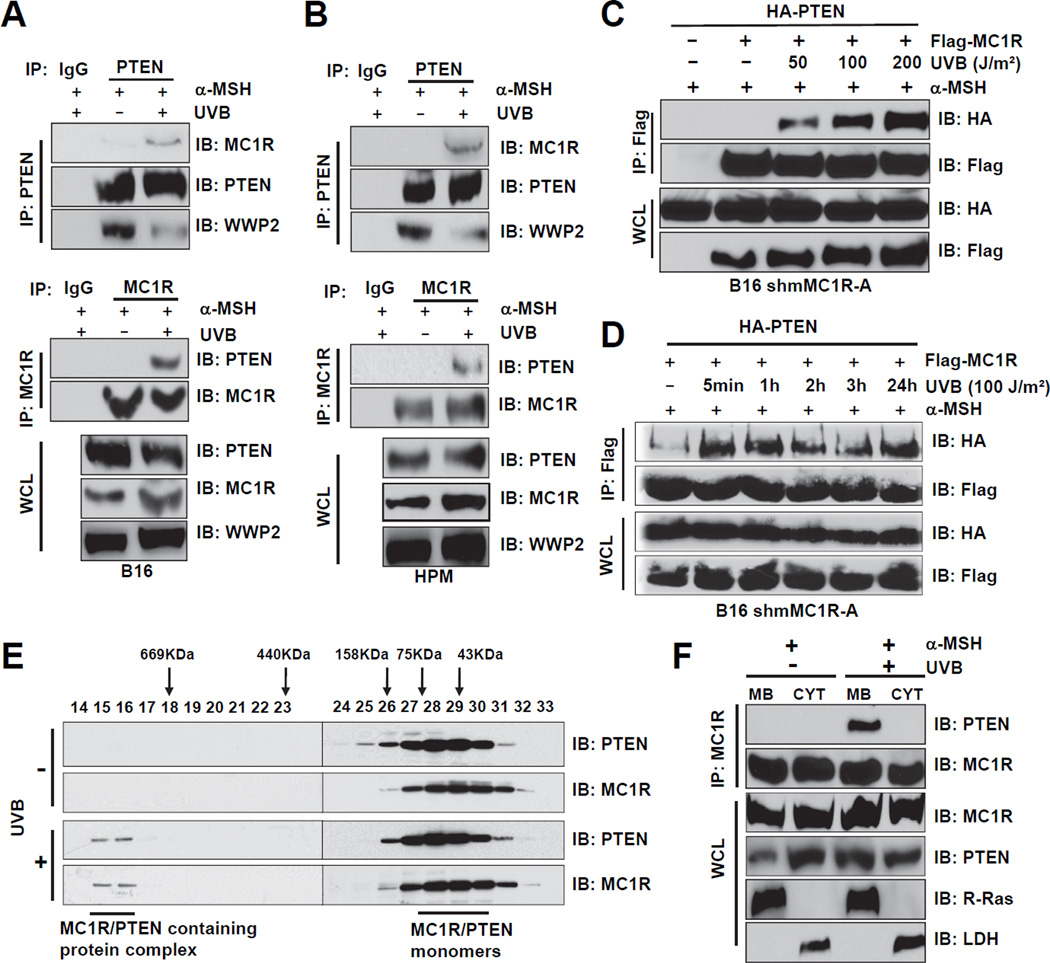
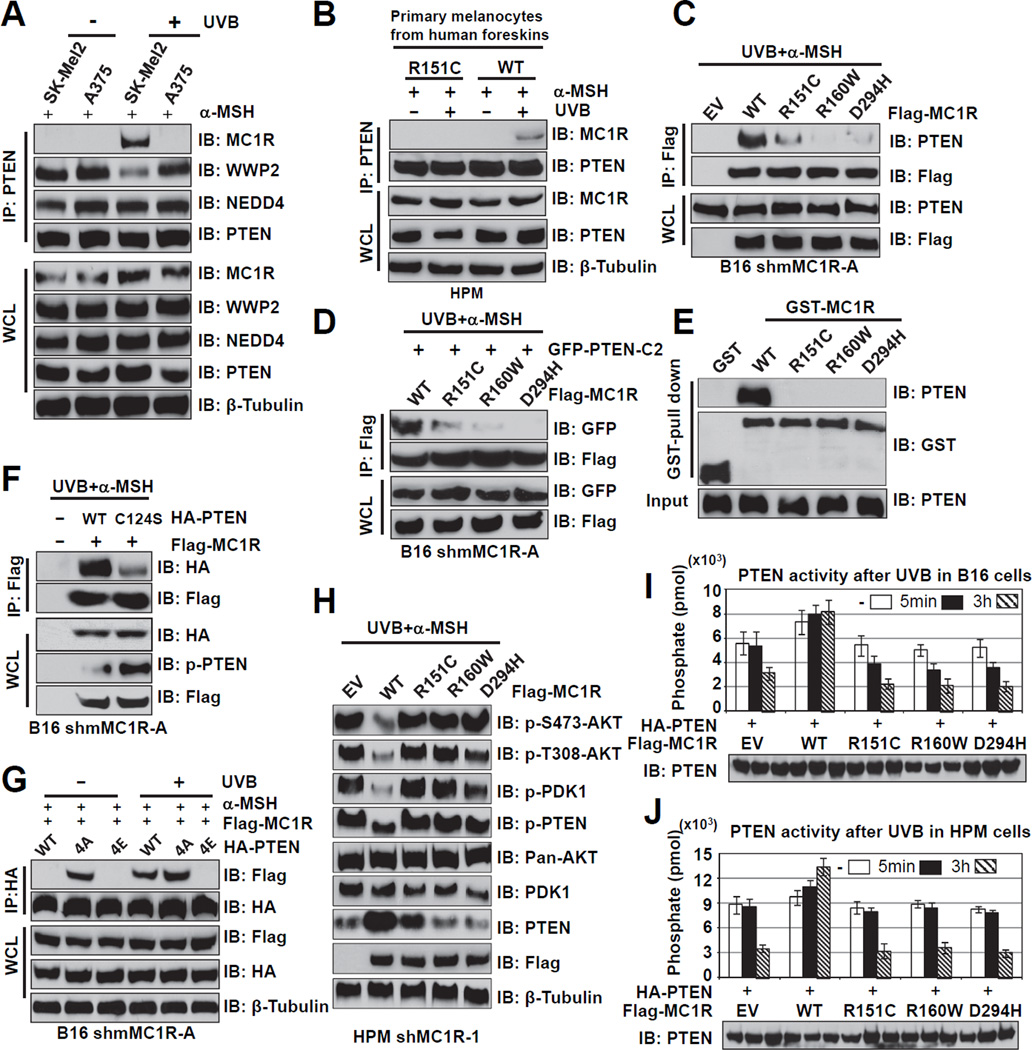
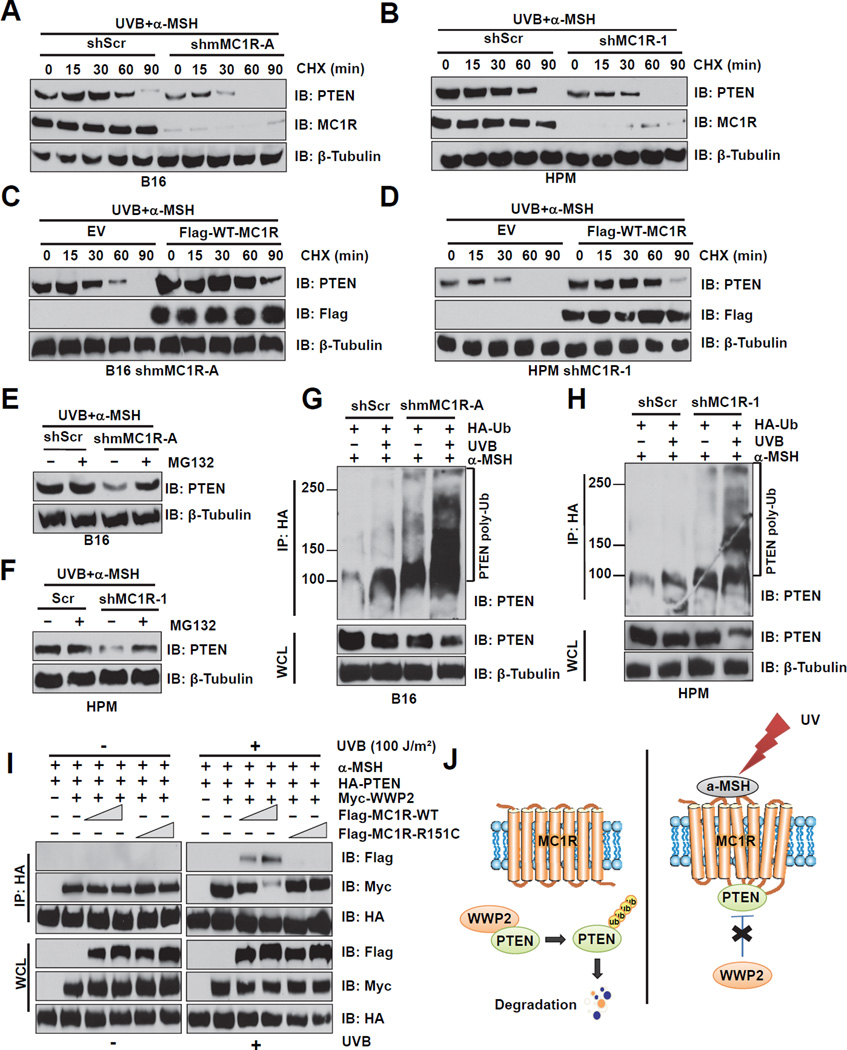
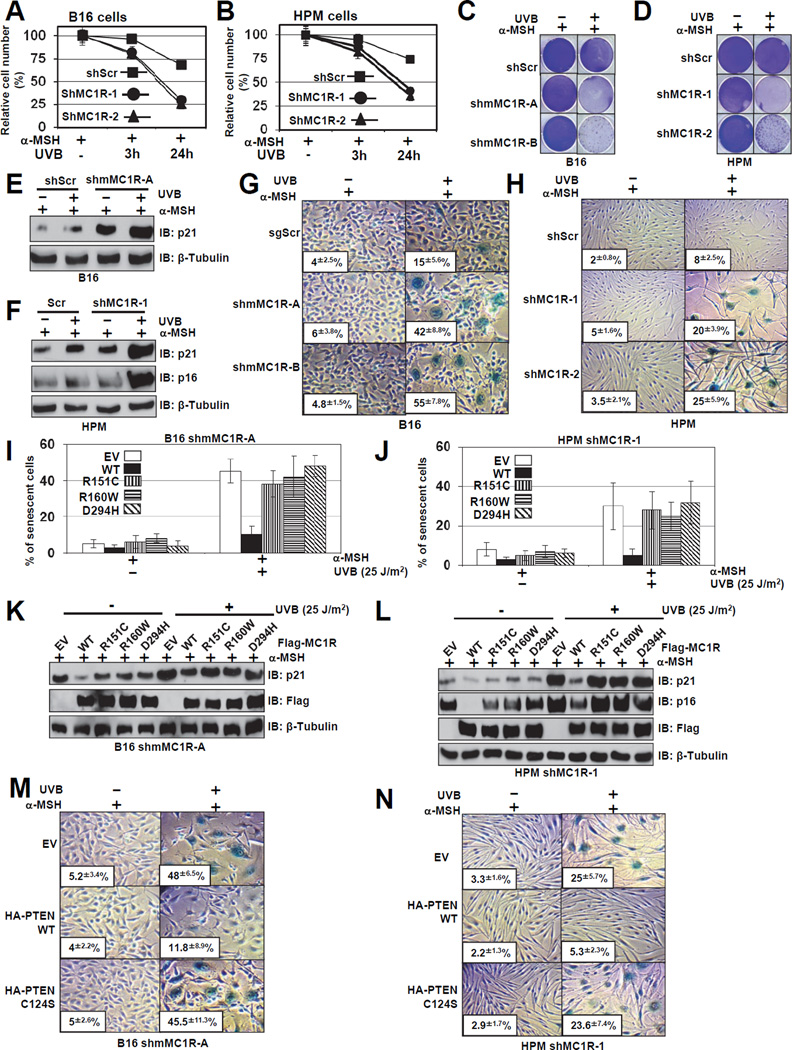
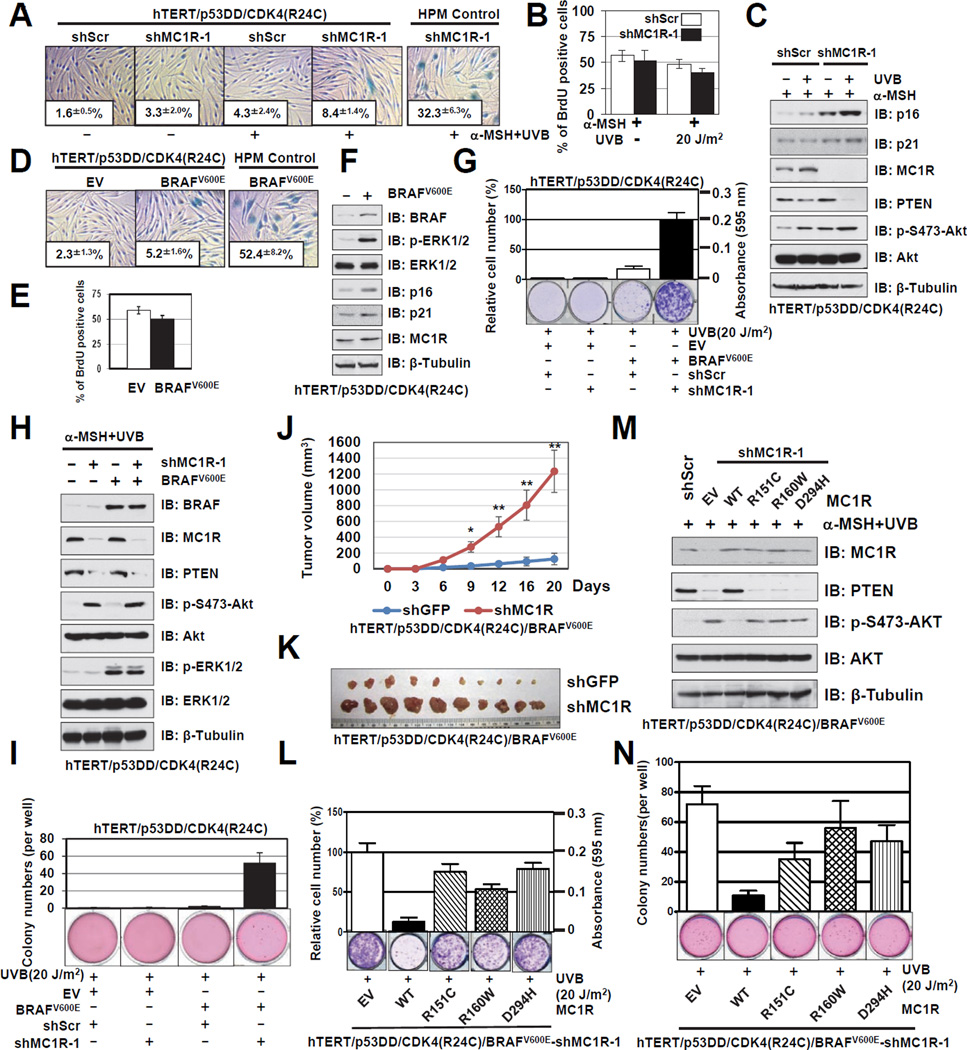
The individuals carrying melanocortin-1 receptor (MC1R) variants, especially those associated with red hair color, fair skin, and poor tanning ability (RHC trait), are more prone to melanoma; however, the underlying mechanism is poorly defined. Here, we report that UVB exposure triggers phosphatase and tensin homolog (PTEN) interaction with wild-type (WT), but not RHC-associated MC1R variants, which protects PTEN from WWP2-mediated degradation, leading to AKT inactivation. Strikingly, the biological consequences of the failure of MC1R variants to suppress PI3K/AKT signaling are highly context dependent. In primary melanocytes, hyperactivation of PI3K/AKT signaling leads to premature senescence; in the presence of BRAF(V600E), MC1R deficiency-induced elevated PI3K/AKT signaling drives oncogenic transformation. These studies establish the MC1R-PTEN axis as a central regulator for melanocytes' response to UVB exposure and reveal the molecular basis underlying the association between MC1R variants and melanomagenesis.


Figures

Figure 1
Figure 1. PTEN Expression is Reduced in Human Skin Carrying MC1R Variants Following UV Exposure
A–B. Immunohistochemistry (IHC) staining of phospho-PTEN (Ser380/Thr382/383) and phospho-AKT (Ser473) in Albino mouse skin (wild-type [WT] MC1R or loss-of-function MC1R frameshift mutation [Mut]) (A) or human foreskin (collected from Caucasian with wild-type MC1R [WT] or MC1R [R151C]) (B) with or without UVB irradiation. C. Immunofluorescent staining (IF) identifying PTEN expression (green), melanocytes (tyrosinase, red) and nuclei (DAPI, blue). Arrows indicate PTEN expressing melanocytes. (a) Non-UVR; (b) SS-UVR. D. The expression of PTEN was determined by IF in melanocytes of human volunteers harboring MC1R variants (n=10) or wild-type MC1R (n=10) at 24 hr and 14 days after UV irradiation. (* p = 0.03 and ** p = 0.008 by paired t test. Data are represented as mean ± SEM, n=10). (See also Figure S1 and Supplemental Table 1–3)
Figure 2
Figure 2. MC1R Depletion Augments UVB-induced AKT Phosphorylation by Inactivating PTEN
A–B. B16 cells (A) and human primary melanocytes (HPMs) (B) stably expressing control shRNA (shScr) or multiple independent shMC1Rs (mouse or human MC1R-specific, respectively) were pre-incubated with 1 µM α-MSH for 30 min, exposed to 100 J/m2 UVB as indicated, and then harvested at 3 hr after UVB exposure for immunoblot (IB) analysis. C–D. Whole cell lysates (WCL) derived from the B16 cells (C) and HPMs (D) generated in A and B with UVB treatment at the doses of 0, 50 and 100 J/m2 were used to detect PTEN oxidation by performing non-reducing SDS-PAGE followed by IB analysis. E–F. MC1R silencing induced PTEN oxidation and PTEN phosphorylation following UVB exposure are independent of the cAMP pathway. HPMs were infected with shMC1R (with shScr as a negative control) to deplete endogenous MC1R. The resulting cells were treated with 1 µM α-MSH for 30 min followed by 100 J/m2 UVB exposure before harvesting for IB analysis. The cAMP pathway was inhibited by using either 2’, 5’-dideoxyadenosine (2’,5’-DDA, 2.5 mM) (E) or siRNA against endogenous adenylyl cyclase (F) as indicated. (See also Figure S2)
Figure 3
Figure 3. UVB Irradiation Promotes the Physical Interaction Between MC1R and PTEN in Melanocytes
A–B. B16 cells (A) or HPMs (B) were pre-incubated with 1 µM α-MSH for 30 min, irradiated with 100 J/m2 UVB, and harvested 3 hr post UVB exposure. WCL were then subjected to immunoprecipitation (IP) and IB analysis. C. MC1R interacts with PTEN in a UVB dose-dependent manner. MC1R-depleted B16 cells were infected with retrovirus encoding Flag-MC1R WT. The resulting cells were transfected with HAPTEN, then pretreated with the proteasomal inhibitor MG132 (25 µM) for 3 hr and with 1 µM α-MSH for 30 min followed by irradiation at the indicated doses. Cells were then harvested for IP and IB analysis at 3 hr after UVB exposure. D. MC1R and PTEN interactions were detected after UVB exposure for up to 24 hr. B16 cells were generated and treated with MG132 and α-MSH as described in C before harvesting for IP and IB analysis at the indicated time points post UVB exposure. E. B16 cells were treated with 1 µM α-MSH for 30 min followed by irradiation with 100 J/m2 UVB. WCL were subjected to the Superdex 200 size exclusion column to separate proteins at different sizes. The lysates collected at various fractions were separated by SDS-PAGE before IB analysis. F. B16 cells were pretreated with MG132 (25 µM) for 3 hours and with 1 µM α-MSH for 30 min followed by irradiation with 100 J/m2 UVB. Cells were then harvested and subjected to subcellular fractionation at 3 hr after UV exposure. The fractionated lysates were subjected to IP and IB analysis. MB indicates membrane-associated fractions, CYT indicates cytosolic fractions. (See also Figure S3)
Figure 4
Figure 4. MC1R Variants are Defective in Association with PTEN Following UVB Irradiation
A. IP and IB analysis of the WCL derived from SK-Mel2 (WT-MC1R) or A375 (R151C–MC1R) cells with or without UVB exposure (100 J/m2). Cells were pretreated with the MG132 (25 µM) for 3 hours and with 1 µM α-MSH for 30 min before UV exposure and harvested at 3 hr after UVB exposure. B. IP and IB analysis of HPMs derived from discarded foreskin with WT-MC1R, or the R151C MC1R variant. The melanocytes were treated with 1 µM α-MSH for 30 min before UVB exposure (100 J/m2). C. IP and IB analysis of WCL derived from shMC1R-B16 cells transfected with the indicated Flag-MC1R plasmids. Cells were pretreated with the MG132 (25 µM) for 3 hours and with 1 µM α-MSH for 30 min before UVB exposure (100 J/m2). D. IP and IB analysis of WCL derived from MC1R-depleted B16 cells co-transfected with the indicated Flag-MC1R plasmids and GFP-PTEN-C2. Cells were pretreated with MG132 (25 µM) for 3 hours and with 1 µM α-MSH for 30 min before UVB exposure (100 J/m2). E. Direct physical interactions between MC1R and PTEN were detected by GST pull-down assays. Recombinant His-PTEN (100 nM) was incubated with GST alone or the indicated GST-MC1R fusion proteins overnight. The bound PTEN protein was detected by IB analysis. Input represents 10% of the total amount of protein subjected to the GST pull-down assays. F. IP and IB analysis of WCL derived from MC1R-depleted B16 cells transfected with Flag-MC1R and the indicated HA-PTEN plasmids. Cells were pretreated with MG132 (25 µM) for 3 hours and with 1 µM α-MSH for 30 min before UVB exposure (100 J/m2). G. IP and IB analysis of WCL derived from MC1R-depleted B16 cells transfected with Flag-MC1R and the indicated HA-PTEN plasmids. Where indicated, cells were pretreated with MG132 (25 µM) for 3 hours and with 1 µM α-MSH for 30 min before UVB exposure (100 J/m2). H. IP and IB analysis of WCL derived from MC1R-depleted HPMs infected with the indicated Flag-MC1R encoding retro-viral constructs. Cells were treated with 1 µM α-MSH for 30 min before UVB exposure (100 J/m2). I–J. MC1R-depleted B16 (I) or HPMs (J) were reintroduced with retrovirus encoding Flag-tagged WT-MC1R or the indicated MC1R variants. These generated cell lines were transfected with HA-PTEN. 48 hr post-transfection, cells were treated with 1µM α-MSH for 30 min, irradiated with 100 J/m2 UVB, and then harvested 5 min or at 3 hr after UV irradiation. PTEN was then immuno-purified from the harvested lysates, and PTEN activity was measured by using a malachite green assay kit. The lower panel shows the amount of PTEN loaded for the ELISA analysis (Data are represented as mean ± SEM, n=3, the p values are listed in Supplemental Table 4). (See also Figure S4 and Supplemental Table 4)
Figure 5
Figure 5. MC1R Protects PTEN from Ubiquitination and Subsequent Proteosome-mediated Destruction Following UVB Exposure
A–B. B16 cells (A) or HPMs (B) were infected with the shMC1R lentiviral construct (with shScr as a negative control) to deplete endogenous MC1R. The resulting cells were pretreated with 1 µM α-MSH for 30 min before UVB irradiation (100 J/m2), and then cultured in media containing 50 µg/ml cycloheximide (CHX). The cells were then harvested at the indicated time points for IB analysis. C–D. MC1R-depleted B16 cells (C) or HPMs (D) were infected with Flag-WT-MC1R encoding retrovirus. The resulting B16 cells (C) or human primary melanocytes (D) were pretreated with 1 µM α-MSH for 30 min followed by treatment with 50 µg/ml CHX before and during UVB irradiation (100 J/m2). The cells were then harvested at the indicated time points for IB analysis. E–F. B16 cells (E) or HPMs (F) were infected with the shMC1R lentiviral construct (with shScr as a negative control) to deplete endogenous MC1R. The resulting cells were pretreated with 1 µM α-MSH for 30 min before UVB exposure (100 J/m2), followed by treatment with 25 µM MG132 during UVB irradiation, and then cultured in DMEM with MG132 for 4 hr. WCL were then collected for IB analysis. G–H. B16 cells (A) or HPMs (B) were infected with the shMC1R lentiviral construct (with shScr as a negative control) to deplete endogenous MC1R. The resulting cells were transfected with HA-ubiquitin, 40 hr post-transfection, cells were pretreated with 25 µM MG132 for 6 hr and 1 µM α-MSH for 30 min prior to UVB irradiation (100 J/m2). The cells were harvested 3 hr after UVR and then immunoprecipitated with HA-conjugated agarose beads. Ubiquitin bound PTEN was analyzed by SDS-PAGE and IB analysis using anti-PTEN antibody. I. IP and IB analysis of WCL derived from MC1R-depleted B16 cells transfected with HAPTEN, Myc-WWP2 and increasing amount of Flag-MC1R WT or R151C mutant. 48 hours post-transfection, cells were pretreated with MG132 (25 µM) for 3 hours and with 1 µM α-MSH for 30 min before UVB exposure (100 J/m2) and harvested 3 hr post UVB exposure. J. Schematic diagram of the mechanism through which MC1R protects PTEN from WWP2-mediated degradation upon UVB exposure in the presence of α-MSH. (See also Figure S5)
Figure 6
Figure 6. MC1R Deficiency Triggers Premature Senescence Following UVB Exposure in Primary Human Melanocytes
A–B. Control of MC1R depleted B16 cells (A) or HPMs (B) were treated with 1 µM α-MSH for 30min, and irradiated with 25 J/m2 UVB followed by MTT assays to evaluate the relative cell numbers at different time points. Data shown represent mean ± SEM, n=3. C–F. The cells generated in A-B were pre-treated with 1 µM α-MSH for 30 min and then irradiated with or without UVB (25 J/m2). Cells were then seeded at equal densities after UVR and fixed and stained with crystal violet after 10 days (C–D). The pictures shown are representative of three experiments. IB analyses were also performed 10 days after UVR with the indicated antibodies (E–F). G–H. The cells generated in A–B were subjected to SA-β-gal staining assay 6 days after UVR. The quantification of the percentage of SA-β-gal positive cells was indicated within the pictures. The pictures show one representative experiment out of three independent experiments. Data are represented as mean ± SEM, n=3. I–J. MC1R-depleted B16 cells (I) or HPMs (J) were infected with retro-viruses encoding wild-type MC1R or MC1R variants (R151C, R160W or D294H). The resulting cells were exposed to 25 J/m2 UVB, and stained for SA-β-gal activity at day 6 after UVR. The quantification of the percentage of SA-β-gal positive cells was indicated within the pictures. The pictures show one representative experiment out of three independent experiments. Data are represented as mean ± SEM, n=3. K-L. The cells generated in I–J were subjected to IB analysis. M–N. MC1R-depleted B16 cells (M) or HPMs (N) were infected with lenti-viruses encoding wild-type PTEN or phosphatase dead, C124S PTEN as indicated. The resulting cells were exposed to 25 J/m2 UVB, and stained for SA-β-gal activity at day 6 after UVR. The quantification of the percentage of SA-β-gal positive cells was indicated within the pictures. The pictures show one representative experiment out of three independent experiments. Data are represented as mean ± SEM, n=3. (See also Figure S6)
Figure 7
Figure 7. BRAFV600E Cooperates with MC1R Deficiency to Drive Melanomagenesis
A. Control or MC1R depleted hTERT/p53DD/CDK4(R24C) human melanocytes were treated with 1 µM α-MSH for 30 min and irradiated with or without UVB (20 J/m2). Cells were then subjected to SA-β-gal staining 10 days after UVR. The quantification of the percentage of SA-β-gal positive cells is indicated within the pictures. The pictures show one representative experiment out of three independent experiments. Data are represented as mean ± SEM, n=3. B. The cells generated in A were subjected to BrdU incorporation assays. The quantification of the percentage of BrdU positive cells was plotted as mean ± SEM from three independent experiments. C. The cells generated in A were harvested for IB analysis. D. Control or BRAFV600E expressing hTERT/p53DD/CDK4(R24C) human melanocytes were subjected to SA-β-gal staining assays 10 days after infection, and quantification of the percentage of SA-β-gal positive cells was indicated within the pictures. The pictures show one representative experiment out of three independent experiments. Data are represented as mean ± SEM, n=3. E. The cells generated in D were subjected to BrdU incorporation assays, and quantification of the percentage of BrdU positive cells was plotted as mean ± SEM from three independent experiments. F. The cells generated in D were harvested for IB analysis. G–H. The BRAFV600E (or EV) expressing cells generated in D were further infected with the shMC1R lentiviral construct (with shScr as a negative control) to deplete endogenous MC1R. The resulting cells were subjected to clonogenic survival assays 15 days after UVR. Crystal violet was used to stain the formed colonies and the colony numbers were counted from three independent experiments. The relative colony numbers were calculated as mean ± SEM, n=3 (G). The resulting cells were also subjected to IB analysis (H). I. The cells generated in G were seeded (10,000 cells per well) in 0.5% low-melting-point agarose in DMEM with 10% FBS, layered onto 0.8% agarose in DMEM/10% FBS. The plates were cultured for 30 days whereupon the colonies >50 µm were counted under a light microscope. The colony numbers were plotted as mean ± SEM from three independent experiments. J. Growth curves for the xenograft experiments with the indicated tumor cells that were inoculated subcutaneously. In each flank of ten nude mice, 3×10⁶ cells were injected. The visible tumors were measured at the indicated days. Error bars represent ±SEM, n=10 and * p < 0.05, ** p < 0.01 (Student’s t test). K. Dissected tumors from the xenograft experiments (J). L–M. MC1R-depleted hTERT/p53DD/CDK4(R24C)/BRAFV600E melanocytes expressing EV, WT, R151C, R160W or D294H-MC1R were pre-incubated with 1 µM α-MSH for 30min before being irradiated with 20 J/m2 UVB, and were then subjected to clonogenic survival assays 15 days after UVR. Crystal violet was used to stain the formed colonies and the colony numbers were counted from three independent experiments. The relative colony numbers were calculated as mean ± SEM (L), n=3. The resulting cells were also subjected to IB analysis (M). N. The cells generated in L were seeded (10,000 cells per well) in 0.5% low-melting-point agarose in DMEM with 10% FBS, layered onto 0.8% agarose in DMEM+10% FBS. The plates were cultured for 30 days whereupon the colonies >50 µm were counted under a light microscope. The colony numbers were plotted as mean ± SEM from three independent experiments. (See also Figure S7 and Supplemental Table 5)

References

    1. Banito A, Rashid ST, Acosta JC, Li S, Pereira CF, Geti I, Pinho S, Silva JC, Azuara V, Walsh M, et al. Senescence impairs successful reprogramming to pluripotent stem cells. Genes Dev. 2009;23:2134–2139. - PMC - PubMed
    1. Ben-Porath I, Weinberg RA. The signals and pathways activating cellular senescence. Int J Biochem Cell Biol. 2005;37:961–976. - PubMed
    1. Braig M, Lee S, Loddenkemper C, Rudolph C, Peters AH, Schlegelberger B, Stein H, Dorken B, Jenuwein T, Schmitt CA. Oncogene-induced senescence as an initial barrier in lymphoma development. Nature. 2005;436:660–665. - PubMed
    1. Cao J, Schulte J, Knight A, Leslie NR, Zagozdzon A, Bronson R, Manevich Y, Beeson C, Neumann CA. Prdx1 inhibits tumorigenesis via regulating PTEN/AKT activity. EMBO J. 2009;28:1505–1517. - PMC - PubMed
    1. Chen Z, Trotman LC, Shaffer D, Lin HK, Dotan ZA, Niki M, Koutcher JA, Scher HI, Ludwig T, Gerald W, et al. Crucial role of p53-dependent cellular senescence in suppression of Pten-deficient tumorigenesis. Nature. 2005;436:725–730. - PMC - PubMed

Publication types

MeSH terms

LinkOut - more resources