. 2013 Sep;15(9):1035-44.
doi: 10.1038/ncb2828. Epub 2013 Aug 25.

Stromal-epithelial crosstalk regulates kidney progenitor cell differentiation

Affiliations

Stromal-epithelial crosstalk regulates kidney progenitor cell differentiation

Amrita Das et al. Nat Cell Biol. 2013 Sep.

Erratum in

  • Nat Cell Biol. 2013 Oct;15(10):1260

Abstract

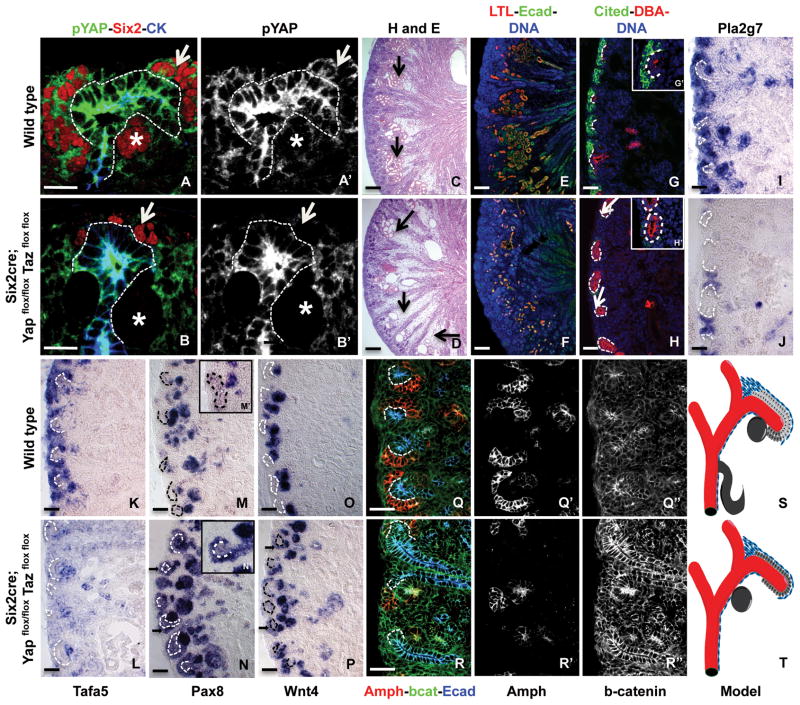
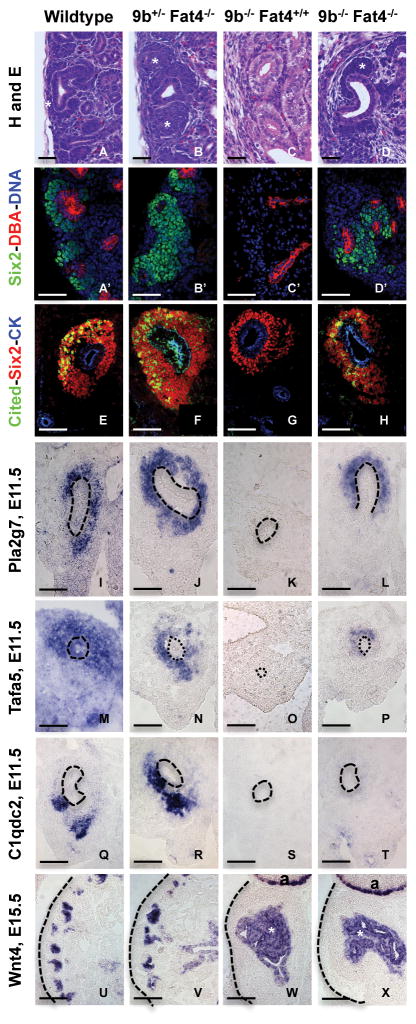
Present models suggest that the fate of the kidney epithelial progenitors is solely regulated by signals from the adjacent ureteric bud. The bud provides signals that regulate the survival, renewal and differentiation of these cells. Recent data suggest that Wnt9b, a ureteric-bud-derived factor, is sufficient for both progenitor cell renewal and differentiation. How the same molecule induces two seemingly contradictory processes is unknown. Here, we show that signals from the stromal fibroblasts cooperate with Wnt9b to promote differentiation of the progenitors. The atypical cadherin Fat4 encodes at least part of this stromal signal. Our data support a model whereby proper kidney size and function is regulated by balancing opposing signals from the ureteric bud and stroma to promote renewal and differentiation of the nephron progenitors.


Conflict of interest statement

The authors declare that they have no competing financial interests.

Figures

Figure 1
Figure 1. The cortical stroma regulates Wnt9b target activation and differentiation of the nephron progenitors
A: Schematic representation of the embryonic kidney indicating the Wnt9b expressing ureteric bud epithelium in red, the renewing nephron progenitors that express Wnt9b Class II targets in light gray, the differentiating nephron progenitors or pre-tubular aggregates (PTAs) that express Wnt9b Class I targets in dark gray and the Foxd1 positive stromal fibroblasts in blue. Hematoxylin and Eosin stained P1 wild type (B) and Foxd1cre; Rosa26DTA mutant (C) kidney sections. Arrows indicate nephron progenitor cells. Expression of Class II/progenitor gene Cited1 (D,E), Amphiphysin (F,G) and Class I/PTA gene Lef1 (H, I) in wild type (D, F,H) and mutant (E, G and I) kidneys at E15.5. All sections have been co-stained with antibodies to the Wnt9b independent progenitor marker Six2 (in red) and the ureteric bud epithelium marker cytokeratin (CK) in blue. Quantification of the Six2 expression domain showed that it was significantly expanded from 2.1 cell layers in the wild type to 5.3 layers in mutants (n=4, p<0.000001). Statistics source data can be found in Table 1. The ureteric bud in B–I is outlined with a white dotted line. D–I are captured at 63x magnification. Scale bar = 100 microns in B, C and 50 microns in all other panels.
Figure 2
Figure 2. Expression of Class II targets is independent of a Wnt ligand but dependent on beta-catenin in stromaless and Fat4 mutants
A–I: Whomemount images of wild type (A–C), Foxd1cre; Rosa26DTA (D–F) and Fat4 null (G–I) kidneys cultured from E11.5 for 48 hours in the presence of DMSO (A, D, G), 5 uM IWP2 (inhibitor of Wnt production) (B, E, H) or the beta-catenin destabilizer IWR1 (C, F, I). All tissues were hybridized with an antisense probe to Pla2g7. Scale bar = 1mm. J–K:Quantitative analysis of gene expression by qrtPCR. cDNA levels of Class II/progenitor targets Tafa5 and Pla2g7 and Class I/PTA target C1qdc2 were assessed after treating wildtype or Fat4 mutant kidneys with IWP2 (J) or IWR1 (K) or DMSO. DMSO treated wildtype levels are considered baseline. Shown is the mean value of Qrt-PCR data from 3 different experiments. Error bar indicates SEM. ‘*’ indicate p<0.05 and ‘#’ indicate p<0.01.
Figure 3
Figure 3. Nephron progenitors of stromal mutants show increased nuclear YAP and reduced pYAP
P1 wild type (A–D), Foxd1cre; Rosa26DTA (E–H) and Fat4 null (I–L) kidneys were subjected to immunostaining using either an antibody to YAP or a phoshpo-YAP specific antibody (green in merged images), the progenitor marker Six2 (in red) and ureteric bud epithelium marker cytokeratin (CK in blue). Single channel images for pYap (B,F and G) and Yap (D, H and L) are shown beneath each merged image. ‘*’ indicates the progenitor domain in mutants with significantly reduced pYAP expression. All images captured at 63X magnification. Scale bars = 20 microns.
Figure 4
Figure 4. Nuclear YAP drives Wnt9b Class II/progenitor and represses Class I/PTA target gene expression in isolated progenitor cell cultures
A) Western blot on whole cell lysates from isolated mesenchymal cells transfected with scrambled, YAP or Taz specific siRNA for 72hrs. Blots were probed with the following antibodies: Yap, Taz, Class II target genes (Cited, Tafa5, Pla2g7, Amphiphysin), Class I target gene (Pax8), Wnt9b independent progenitor markers (Six2 and Sall1) and a marker of differentiation E-cadherin. (B) QrtPCR on cDNA from cells transfected with a scrambled siRNA or siRNAs to Taz and Yap using primers to Yap, Taz, Class II Class I targets and Wnt9b independent progenitor genes. (C) Western blot of cells 72hrs after transfection with vector, full length or Fat4-ECD plasmids. (D) MM cells (stained with CellTracker, red) were co-cultured with cells co-expressing empty vector, full-length Fat4 or Fat4-ECD and GFP (green) then stained with anti-Yap antibody (teal) and Dapi (blue). Arrows in B indicate the nucleus. Note the lack of Yap in the nucleus of mesenchymal cells adjacent to Fat4 expressing cells. Scale bar in D =20microns. In all in vitro experiments, cultured cells are isolated from 20 embryos from 3 pregnant females. The QrtPCR data shown is one representative example from 3 individual experiments.
Figure 5
Figure 5. Ablation of TAZ/YAP from the progenitors alters expression of Class I and Class II target genes in the nephron progenitors
Kidney sections from E18.5 wild type (A, C, E, G, I, K, M, O, Q) or Six2cre; Yapflox/flox/Tazflox/flox mutant (B, D, F, H, J, L, N, P, R) were stained with antibodies to pYap (green), progenitor marker Six2 (red) and UB epithelium gene, cytokeratin (CK in blue) (A–B, Single channel images for pYap are shown in A′ and B′), Hematoxylin and Eosin (C–D), LTL (red), epithelial marker E-cadherin (green) and Dapi (blue) (E–F), Wnt9b/Class II target Cited1 (in green), UB epithelium marker Dolichos biflorus agglutinin (DBA, in red) and Dapi (blue) (G–H, G′-H′ shows a higher magnification with the UB outlined in white), antisense Wnt9b/ClassII target Pla2g7 (I–J), antisense Wnt9b/ClassII target Tafa5 (K–L), antisense Wnt9b/ClassI target Pax8 (M–N, M′–N′ shows the higher magnification with the UB outlined in white), antisense Wnt9b/ClassI target Wnt4 (O–P) antibodies to ClassII target Amphiphysin (in red), beta-catenin (in green) and E-cadherin (blue) (Q–R, the corresponding single channels for Amphiphysin and beta-catenin are shown in Q′–R′ are Q″–R″, respectively). Model showing the expression of progenitors in wild type and Yap/Taz double mutants (S–T). The self-renewing progenitor cells (light gray) are significantly reduced or lost in the mutants and are replaced by the differentiating progenitors (dark gray). Dotted lines indicate the UB in all panels. Arrow in A′–B′ indicate reduced Six2 positive cells and * indicate the PTAs; arrow in C–D indicates epithelial structures lost in the mutants; arrow in H indicates loss of Cited1 expression from UB tips and arrow in N and P indicates ectopic expression of target genes. Scale bar for A,B =.1mm, C-P = 10 microns, Q-R = 50 microns.
Figure 6
Figure 6. Fat4 mutants exhibit an expansion of the progenitor domain and reduced differentiation
Wild type (A, C, E, G, I, K, M, O) and Fat4 null (B, D, F, H, J, L, N, P E18.5) kidneys stained with Hematoxylin and Eosin staining (A–B), antisense probes to Six2 (C,D), Eya1(E–F) and Wnt9b/ClassII target genes Cited1 (G–H) Tafa5 (I–J), or antibodies to Amphiphysin (green), UB epithelium marker cytokeratin (CK in red) and Dapi (K–L), Pax2 (red), Ecadherin (green) and beta-catenin (blue) (M–N), Six2 (red), Wnt9b/ClassI target gene Lef1 (green) and cytokeratin (blue) (O–P). Quantification of Six2 positive cells revealed that the progenitor domain was on average 4 cell layers thick in mutants as compared to 2.1 cell layers in wild type kidneys (n=4, p<0.000001). Wild type kidneys had an average of 51.5 Lef1 positive structures per section while Fat4 mutants had only 28 (n=4, p=0.007). Statistics source data can be found in Table 1. All images are taken at 20x magnification. Scale bars-100 microns.
Figure 7
Figure 7. Fat4 mutants express Class II/progenitor genes in the absence of Wnt9b
Wild type (A, E, I, M, Q, U, A′), Fat4 mutant (B, F, J, N, R, V, B′), Wnt9b mutant (C, G, K, O, S, W, C′) and Wnt9b/Fat4 double mutant (D, H, L, P, T, X, D′) kidneys at P1 (A–D and A′–D′), E11.5 (E–T) or E15.5 (U–X). Sections were stained with Hematoxylin and Eosin (A–D), anti-Six2 (green), DBA (red) and Dapi (blue) (A′–D′), anti-Six2 (red), Wnt9b/ClassII target gene Cited1 (green) and cytokeratin (blue, CK in E–H), antisense probes toPla2g7 (I–L),Tafa5 (M–P) and Wnt9b/Class I target gene C1qdc2 (Q–T) and Wnt4 (U–X). Dotted line indicates the UB. * in AD indicate expanded progenitor cell domains. * in W–X indicate medullary stromal expression of Wnt4. ‘a’ in W–X indicate adrenal gland. In A–D images are captured at 40x magnification and scale bar is: 20 microns. All other images are at 20x magnification and scale bars are 100 microns.
Figure 8
Figure 8. Model for the interaction between the stroma and the ureteric bud on the progenitor cells
The boxed area of the nascent kidney is magnified on the right. Wnt9b, produced by the ureteric bud (red) signals canonically to both the renewing progenitors (gray cells) and to the differentiating progenitors (green cells). Fat4, produced by the stroma, promotes differentiation by enhancing the nuclear export of Yap/Taz within the progenitors (green cells), which allows expression of Class I beta-catenin targets. In the renewing progenitors levels, of pYAP are low. Un-phosphorylated Yap is localized predominantly in the nucleus and activates expression of Class II beta-catenin targets and promotes progenitor renewal. We hypothesize that cells induced to differentiate by Fat4 are only transiently located next to the stroma the migrate to the stalk side of the UB where they initiate MET.

References

    1. Grobstein C. Inductive interaction in the development of the mouse metanephros. J Exp Zool. 1955;130:319–340.
    1. Grobstein C. Inductive epithlio-mesenchymal interaction in cultured organ rudiments of the mouse metanephros. Science. 1953;118:52–55. - PubMed
    1. Carroll TJ, Park JS, Hayashi S, Majumdar A, McMahon AP. Wnt9b plays a central role in the regulation of mesenchymal to epithelial transitions underlying organogenesis of the mammalian urogenital system. Dev Cell. 2005;9:283–292. - PubMed
    1. Karner CM, et al. Canonical Wnt9b signaling balances progenitor cell expansion and differentiation during kidney development. Development. 2011;138:1247–1257. - PMC - PubMed
    1. Hatini V, Huh SO, Herzlinger D, Soares VC, Lai E. Essential role of stromal mesenchyme in kidney morphogenesis revealed by targeted disruption of Winged Helix transcription factor BF-2. Genes Dev. 1996;10:1467–1478. - PubMed

Publication types

MeSH terms