. 2013 Sep 15;12(18):3001-12.
doi: 10.4161/cc.26029. Epub 2013 Aug 14.

Gravitational force modulates G2/M phase exit in mechanically unloaded myoblasts

Affiliations

Gravitational force modulates G2/M phase exit in mechanically unloaded myoblasts

Tatiana Benavides Damm et al. Cell Cycle. .

Abstract

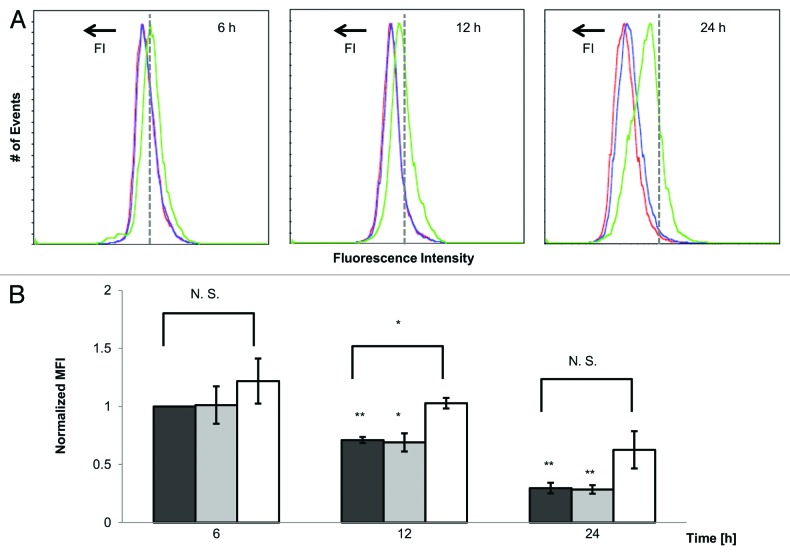
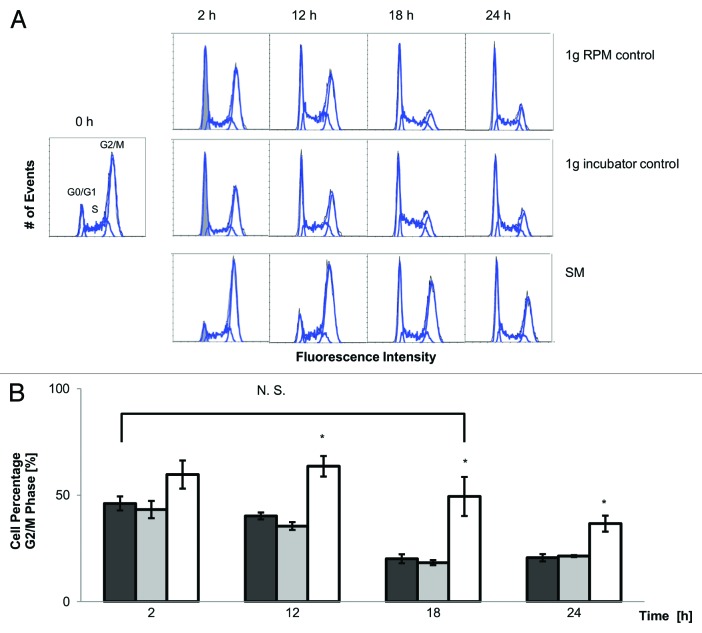
Prolonged spaceflight gives rise to muscle loss and reduced strength, a condition commonly referred to as space atrophy. During exposure to microgravity, skeletal muscle myoblasts are mechanically unloaded and respond with attenuated cell proliferation, slowed cell cycle progression, and modified protein expression. To elucidate the underlying mechanisms by which muscle mass declines in response to prolonged microgravity exposure, we grew C2C12 mouse muscle cells under conditions of simulated microgravity (SM) and analyzed their proliferative capacity, cell cycle progression, and cyclin B and D expression. We demonstrated that the retarded cell growth observed in SM was correlated with an approximate 16 h delay in G2/M phase progression, where cells accumulated specifically between the G2 checkpoint and the onset of anaphase, concomitantly with a positive expression for cyclin B. The effect was specific for gravitational mechanical unloading as cells grown under conditions of hypergravity (HG, 4 g) for similar durations of time exhibited normal proliferation and normal cell cycle progression. Our results show that SM and HG exert phenomenological distinct responses over cell cycle progression. The deficits of SM can be restored by terrestrial gravitational force, whereas the effects of HG are indistinguishable from the 1 g control. This suggests that the mechanotransduction apparatus of cells responds differently to mechanical unloading and loading.

Keywords: cell cycle; cyclins; hypergravity; mechanical unloading; mechanotransduction; microgravity; muscle atrophy.


Figures

None
Figure 1. Simulated microgravity inhibits cell proliferation. Cell growth was assessed by collecting CFSE-stained cells 6, 12, and 24 h after culture at 1 g or simulated microgravity (SM). Representative histograms of the fluorescence intensities are shown (color online): random positioning machine (RPM) control in blue, incubator control in red and SM in green (A). The dashed gray line is placed on the same position on each histogram to help visualize the shifts, symbolized by an arrow pointing to decreased fluorescence intensity (FI) values. The graph with the data from all 3 experiment repetitions illustrates that as cells divide, they lose fluorescence intensity (B). The SM (white columns) samples were brighter than the 1 g samples: RPM control (dark gray columns) and incubator control (light gray columns). The median fluorescence intensities (MFI) were normalized to the RPM control in the first time point (6 h). Means ± standard deviations were obtained from 3 independent series of experiments. NS, not significant; *: P < 0.05; **: P < 0.005 against the 6 h RPM control unless described as against each RPM control.
None
Figure 2. Simulated microgravity causes cells to accumulate at G2/M phase. Cells were collected after 6, 12, and 24 h for the random positioning machine (RPM) control (dark gray columns), incubator control (light gray columns), and simulated microgravity (SM, white columns). The cell cycle analysis shows that the percentage of cells in G0/G1 + S phase (A) decreased while the percentage of cells in the G2/M phase increased (B) in SM after 6 and 12 h, returning to control levels after 24 h. Means ± standard deviations were obtained from 3 independent series of experiments. *: P < 0.05; **: P < 0.005 against each RPM control.
None
Figure 3. Simulated microgravity delays G2/M phase exit by 16 h. Representative histograms with the fitted cell cycle model (A) are shown for the 0 h start point (middle left) and after 2, 12, 18, and 24 h for the random positioning machine (RPM) control (top), incubator control (middle), and simulated microgravity (SM; bottom). The G1/G0 peak is shaded gray to accentuate the difference (between SM and controls) in the rate of cell entry into this phase after 2 h. A summary of the data collected from 3 experiments (B) shows the percentage of cells in G2/M phase over time. Cells were synchronized with hydroxyurea for 3 h, released from the block, and then placed on the RPM 6 h afterwards, when cells were accumulated in the G2/M phase. Cells were collected after 2, 12, 18, and 24 h for the RPM control (dark gray columns), incubator control (light gray columns), and SM (white columns). Of importance is the similarity of the RPM control at 2 h and SM at 18 h. Means ± standard deviations were obtained from 3 independent series of experiments. NS, not significant; *: P < 0.05; **: P < 0.005 against each RPM control unless described otherwise.
None
Figure 4. Simulated microgravity does not affect G0/G1 and S phase progressions. Representative histograms from 3 independent series of experiments are shown for the 0 h start point (middle left) and after 2, 4, and 6 h for the random positioning machine (RPM) control (top), incubator control (middle), and simulated microgravity (SM, bottom). Cells were synchronized with hydroxyurea for 3 h, released from the block, and then placed immediately on the RPM when cells were accumulated in the G0/G1 phase. Cells were collected after 2, 4, and 6 h of cultivation under SM or at 1 g. A summary of the data collected from the 3 experiments is not shown, as the model used to calculate the cell percentages in each phase of the cell cycle could not be fitted to the histograms.
None
Figure 5. Simulated microgravity enhances cyclin B but not cyclin D expression. Cyclin B (A) and cyclin D (B) expressions were measured after 6, 12, and 24 h for the random positioning machine (RPM) control (dark gray columns), incubator control (light gray columns), and simulated microgravity (white columns). Means ± standard deviations were obtained from 3 independent series of experiments, *: P < 0.05; **: P < 0.005 against each RPM control.
None
Figure 6. Hypergravity does not affect cell proliferation. Cells were collected after 6, 12, and 24 h for the hyperfuge control (dark gray columns), incubator control (light gray columns), and hypergravity (patterned columns). Cell growth was assessed by collecting CFSE stained cells. The median fluorescence intensities (MFI) were normalized to the hyperfuge control in the first time point (6 h). Means ± standard deviations were obtained from 3 independent series of experiments. NS, not significant; *: P < 0.05; **: P < 0.005 against the 6 h hyperfuge control unless described as against each hyperfuge control.
None
Figure 7. Cell cycle profiles are not disturbed by hypergravity exposure. The cell cycle analysis shows that the percentages of cells in G0/G1 + S phase (A) and in G2/M phase (B) stay constant throughout all the time points in all the samples. Cells were collected after 6, 12, and 24 h for the hyperfuge control (dark gray columns), incubator control (light gray columns), and hypergravity (patterned columns). Means ± standard deviations were obtained from 3 independent series of experiments, *: P < 0.05; **: P < 0.005 against each hyperfuge control.
None
Figure 8. Hypergravity does not affect cell cycle progression. For G0/G1 and S phase progressions, cells were synchronized with hydroxyurea for 3 h, released from the block, and then placed immediately on the hyperfuge when cells were accumulated in the G0/G1 phase. Cells were collected after 2, 4, and 6 h of growth at 1 or 4 g. Representative histograms (A) from 3 independent series of experiments are shown for the 0 h start point (middle left) and after 2, 4, and 6 h for the hyperfuge control (top), incubator control (middle), and hypergravity (HG, bottom). For G2/M phase progression, cells were synchronized with hydroxyurea for 3 h, released from the block, and then placed on the hyperfuge 6 h afterwards, when cells were accumulated in the G2/M phase. Cells were collected after 2, 12, 18, and 24 h for the hyperfuge control (dark gray columns), incubator control (light gray columns), and HG (patterned columns). The percentage of cells in G2/M phase over time is shown (B). Means ± standard deviations were obtained from 3 independent series of experiments, *: P < 0.05; **: P < 0.005 against each hyperfuge control.
None
Figure 9. Cyclin B and D expressions remain unchanged during hypergravity exposure. Cyclin B (A) and cyclin D (B) expressions were measured after 6, 12, and 24 h for the hyperfuge control (dark gray columns), incubator control (light gray columns), and hypergravity (patterned columns). Means ± standard deviations were obtained from 3 independent series of experiments, *: P < 0.05; **: P < 0.005 against each hyperfuge control.

Comment in

  • TRPC1: getting physical in space.
    Ambudkar IS. Ambudkar IS. Cell Cycle. 2013 Nov 1;12(21):3355-6. doi: 10.4161/cc.26637. Epub 2013 Sep 27. Cell Cycle. 2013. PMID: 24091530 Free PMC article. No abstract available.

References

    1. Narici MV, de Boer MD. Disuse of the musculo-skeletal system in space and on earth. Eur J Appl Physiol. 2011;111:403–20. doi: 10.1007/s00421-010-1556-x. - DOI - PubMed
    1. Fitts RH, Riley DR, Widrick JJ. Functional and structural adaptations of skeletal muscle to microgravity. J Exp Biol. 2001;204:3201–8. - PubMed
    1. Vandenburgh H, Chromiak J, Shansky J, Del Tatto M, Lemaire J. Space travel directly induces skeletal muscle atrophy. FASEB J. 1999;13:1031–8. - PubMed
    1. Benavides Damm T, Richard S, Tanner S, Wyss F, Egli M, Franco-Obregón A. Calcium-dependent deceleration of the cell cycle in muscle cells by simulated microgravity. FASEB J. 2013;27:2045–54. doi: 10.1096/fj.12-218693. - DOI - PubMed
    1. Darzynkiewicz Z, Gong J, Juan G, Ardelt B, Traganos F. Cytometry of cyclin proteins. Cytometry. 1996;25:1–13. doi: 10.1002/(SICI)1097-0320(19960901)25:1<1::AID-CYTO1>3.0.CO;2-N. - DOI - PubMed

LinkOut - more resources