

Ambient hypoxia enhances the loss of muscle mass after extensive injury
- PMID: 23974966
- PMCID: PMC4878136
- DOI: 10.1007/s00424-013-1336-7
Ambient hypoxia enhances the loss of muscle mass after extensive injury
Abstract
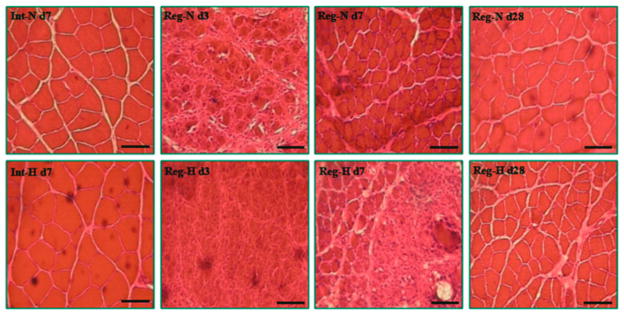
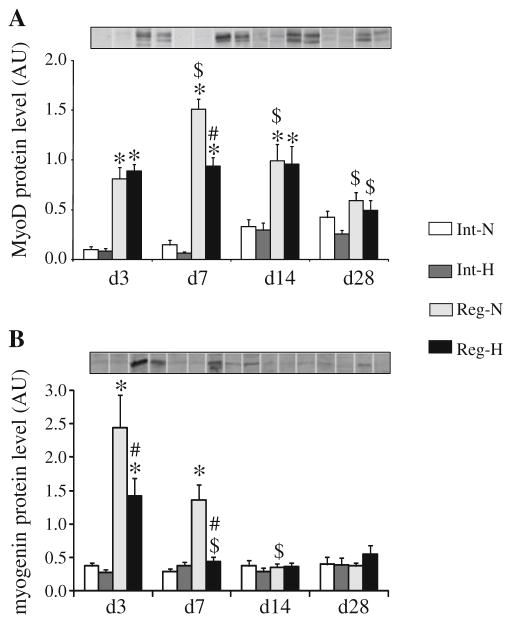
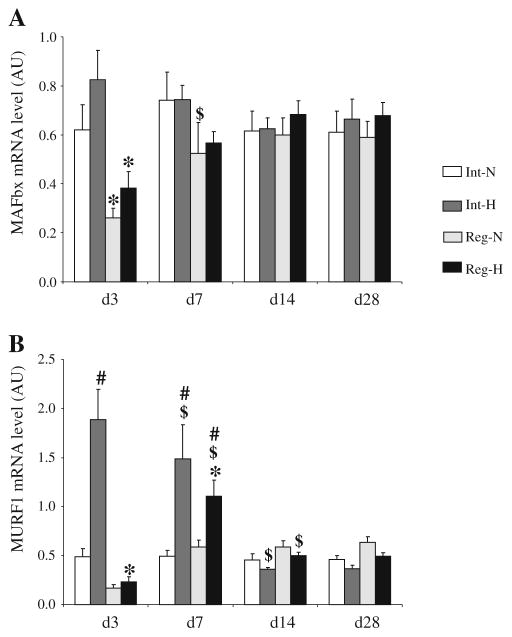
Hypoxia induces a loss of skeletal muscle mass and alters myogenesis in vitro, but whether it affects muscle regeneration in vivo following injury remains to be elucidated. We hypothesized that hypoxia would impair the recovery of muscle mass during regeneration. To test this hypothesis, the soleus muscle of female rats was injured by notexin and allowed to recover for 3, 7, 14, and 28 days under normoxia or hypobaric hypoxia (5,500 m) conditions. Hypoxia impaired the formation and growth of new myofibers and enhanced the loss of muscle mass during the first 7 days of regeneration, but did not affect the final recovery of muscle mass at 28 days. The impaired regeneration under hypoxic conditions was associated with a blunted activation of mechanical target of rapamycin (mTOR) signaling as assessed by p70(S6K) and 4E-BP1 phosphorylation that was independent of Akt activation. The decrease in mTOR activity with hypoxia was consistent with the increase in AMP-activated protein kinase activity, but not related to the change in regulated in development and DNA response 1 protein content. Hypoxia increased the mRNA levels of the atrogene muscle ring finger-1 after 7 days of regeneration, though muscle atrophy F box transcript levels remained unchanged. The increase in MyoD and myogenin mRNA expression with regeneration was attenuated at 7 days with hypoxia. In conclusion, our results support the notion that the enhanced loss of muscle mass observed after 1 week of regeneration under hypoxic conditions could mainly result from the impaired formation and growth of new fibers resulting from a reduction in protein synthesis and satellite cell activity.
Figures


Similar articles
-
Recovery of skeletal muscle mass after extensive injury: positive effects of increased contractile activity.Am J Physiol Cell Physiol. 2008 Feb;294(2):C467-76. doi: 10.1152/ajpcell.00355.2007. Epub 2007 Dec 12. Am J Physiol Cell Physiol. 2008. PMID: 18077604
-
Hypoxia transiently affects skeletal muscle hypertrophy in a functional overload model.Am J Physiol Regul Integr Comp Physiol. 2012 Mar 1;302(5):R643-54. doi: 10.1152/ajpregu.00262.2011. Epub 2011 Dec 21. Am J Physiol Regul Integr Comp Physiol. 2012. PMID: 22189670
-
AMP-activated protein kinase enhances the expression of muscle-specific ubiquitin ligases despite its activation of IGF-1/Akt signaling in C2C12 myotubes.J Cell Biochem. 2009 Oct 1;108(2):458-68. doi: 10.1002/jcb.22272. J Cell Biochem. 2009. PMID: 19639604
-
Activation of protein synthesis, regeneration, and MAPK signaling pathways following repeated bouts of eccentric cycling.Am J Physiol Endocrinol Metab. 2019 Dec 1;317(6):E1131-E1139. doi: 10.1152/ajpendo.00216.2019. Epub 2019 Oct 8. Am J Physiol Endocrinol Metab. 2019. PMID: 31593504
-
Testosterone signals through mTOR and androgen receptor to induce muscle hypertrophy.Med Sci Sports Exerc. 2013 Sep;45(9):1712-20. doi: 10.1249/MSS.0b013e31828cf5f3. Med Sci Sports Exerc. 2013. PMID: 23470307
Cited by
-
Crossroads between peripheral atherosclerosis, western-type diet and skeletal muscle pathophysiology: emphasis on apolipoprotein E deficiency and peripheral arterial disease.J Biomed Sci. 2017 Jul 8;24(1):42. doi: 10.1186/s12929-017-0346-8. J Biomed Sci. 2017. PMID: 28688452 Free PMC article. Review.
-
Effects of Transient Hypoxia versus Prolonged Hypoxia on Satellite Cell Proliferation and Differentiation In Vivo.Stem Cells Int. 2015;2015:961307. doi: 10.1155/2015/961307. Epub 2015 Feb 18. Stem Cells Int. 2015. PMID: 25788948 Free PMC article.
-
Effect of hypoxia exposure on the recovery of skeletal muscle phenotype during regeneration.Mol Cell Biochem. 2014 May;390(1-2):31-40. doi: 10.1007/s11010-013-1952-8. Epub 2014 Jan 3. Mol Cell Biochem. 2014. PMID: 24385110
-
Effects of hyperbaric oxygen at 1.25 atmospheres absolute with normal air on macrophage number and infiltration during rat skeletal muscle regeneration.PLoS One. 2014 Dec 22;9(12):e115685. doi: 10.1371/journal.pone.0115685. eCollection 2014. PLoS One. 2014. PMID: 25531909 Free PMC article.
-
Fifteen days of 3,200 m simulated hypoxia marginally regulates markers for protein synthesis and degradation in human skeletal muscle.Hypoxia (Auckl). 2016 Mar 3;4:1-14. doi: 10.2147/HP.S101133. eCollection 2016. Hypoxia (Auckl). 2016. PMID: 27800505 Free PMC article.
References
-
- Bigard X, Sanchez H, Birot O, Serrurier B. Myosin heavy chain composition of skeletal muscles in young rats growing under hypobaric hypoxia conditions. J Appl Physiol. 2000;88(2):479–486. - PubMed
-
- Bodine SC, Latres E, Baumhueter S, Lai VK, Nunez L, Clarke BA, Poueymirou WT, Panaro FJ, Na E, Dharmarajan K, Pan ZQ, Valenzuela DM, DeChiara TM, Stitt TN, Yancopoulos GD, Glass DJ. Identification of ubiquitin ligases required for skeletal muscle atrophy. Science. 2001;294(5547):1704–1708. - PubMed
-
- Cai D, Frantz JD, Tawa NE, Jr, Melendez PA, Oh BC, Lidov HG, Hasselgren PO, Frontera WR, Lee J, Glass DJ, Shoelson SE. IKKbeta/NF-kappaB activation causes severe muscle wasting in mice. Cell. 2004;119(2):285–298. - PubMed
-
- Chaillou T, Koulmann N, Simler N, Meunier A, Serrurier B, Chapot R, Peinnequin A, Beaudry M, Bigard X. Hypoxia transiently affects skeletal muscle hypertrophy in a functional overload model. Am J Physiol Regul Integr Comp Physiol. 2012;302(5):R643–654. - PubMed
-
- Chaillou T, Malgoyre A, Banzet S, Chapot R, Koulmann N, Pugniere P, Beaudry M, Bigard X, Peinnequin A. Pitfalls in target mRNA quantification for real-time quantitative RT-PCR in overload-induced skeletal muscle hypertrophy. Physiol Genom. 2011;43(4):228–235. - PubMed
Publication types
MeSH terms
Substances
Grants and funding
LinkOut - more resources
Full Text Sources
Other Literature Sources
Miscellaneous
