Review
. 2013 Aug;87(8):1315-530.
doi: 10.1007/s00204-013-1078-5. Epub 2013 Aug 23.

Recent advances in 2D and 3D in vitro systems using primary hepatocytes, alternative hepatocyte sources and non-parenchymal liver cells and their use in investigating mechanisms of hepatotoxicity, cell signaling and ADME

Patricio Godoy  1 Nicola J HewittUte AlbrechtMelvin E AndersenNariman AnsariSudin BhattacharyaJohannes Georg BodeJennifer BolleynChristoph BornerJan BöttgerAlbert BraeuningRobert A BudinskyBritta BurkhardtNeil R CameronGiovanni CamussiChong-Su ChoYun-Jaie ChoiJ Craig RowlandsUta DahmenGeorg DammOlaf DirschMaría Teresa DonatoJian DongSteven DooleyDirk DrasdoRowena EakinsKarine Sá FerreiraValentina FonsatoJoanna FraczekRolf GebhardtAndrew GibsonMatthias GlanemannChris E P GoldringMaría José Gómez-LechónGeny M M GroothuisLena GustavssonChristelle GuyotDavid HallifaxSeddik HammadAdam HaywardDieter HäussingerClaus HellerbrandPhilip HewittStefan HoehmeHermann-Georg HolzhütterJ Brian HoustonJens HrachKiyomi ItoHartmut JaeschkeVerena KeitelJens M KelmB Kevin ParkClaus KordesGerd A Kullak-UblickEdward L LeCluysePeng LuJennifer Luebke-WheelerAnna LutzDaniel J MaltmanMadlen Matz-SojaPatrick McMullenIrmgard MerfortSimon MessnerChristoph MeyerJessica MwinyiDean J NaisbittAndreas K NusslerPeter OlingaFrancesco PampaloniJingbo PiLinda PlutaStefan A PrzyborskiAnup RamachandranVera RogiersCliff RoweCeline SchelcherKathrin SchmichMichael SchwarzBijay SinghErnst H K StelzerBruno StiegerRegina StöberYuichi SugiyamaCiro TettaWolfgang E ThaslerTamara VanhaeckeMathieu VinkenThomas S WeissAgata WideraCourtney G WoodsJinghai James XuKathy M YarboroughJan G Hengstler
Affiliations
Review

Recent advances in 2D and 3D in vitro systems using primary hepatocytes, alternative hepatocyte sources and non-parenchymal liver cells and their use in investigating mechanisms of hepatotoxicity, cell signaling and ADME

Patricio Godoy et al. Arch Toxicol. 2013 Aug.

Abstract

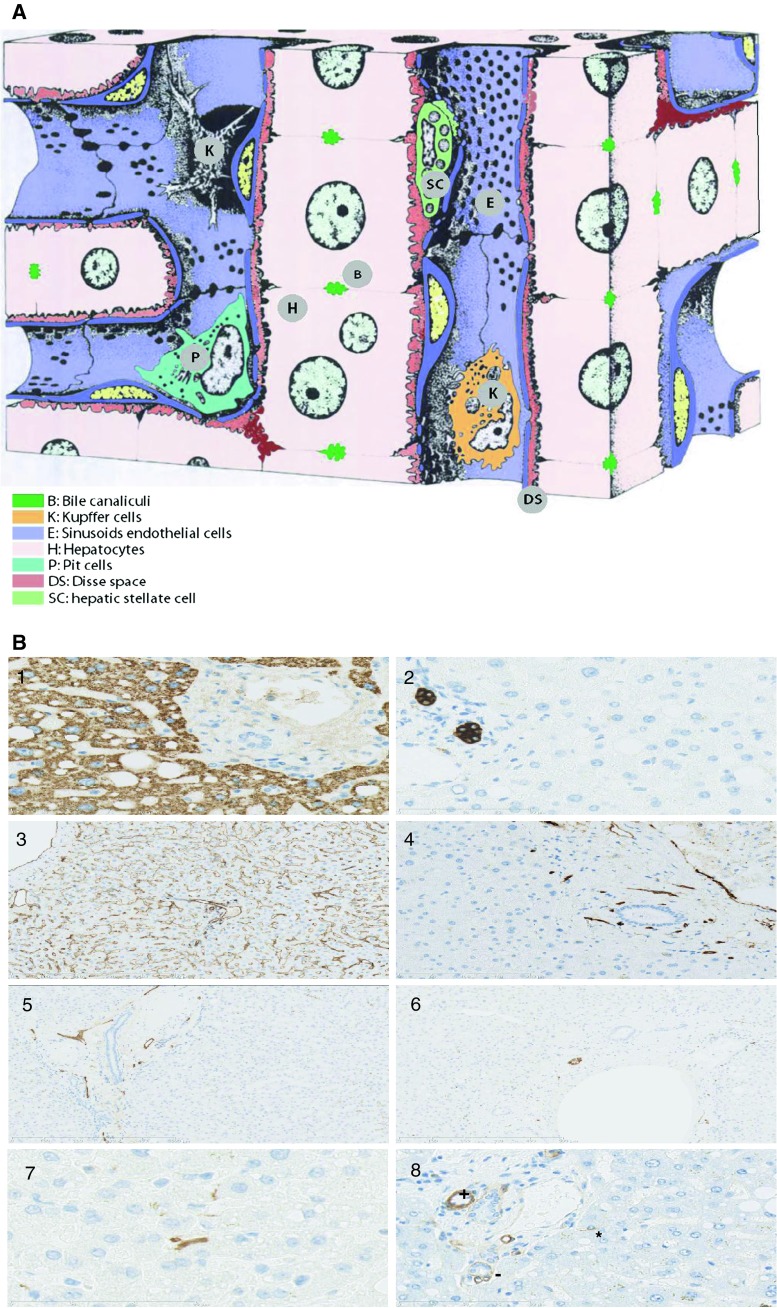
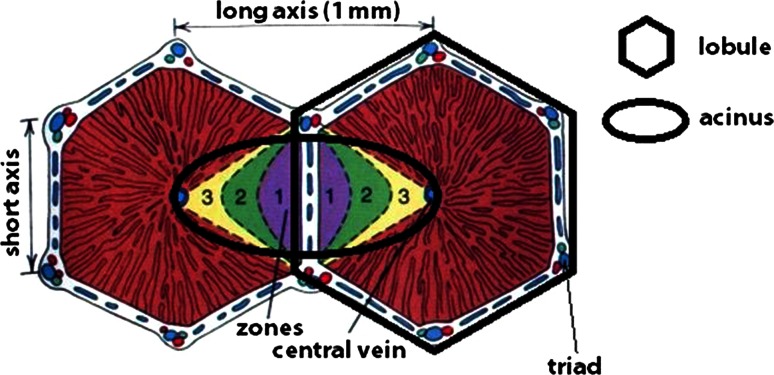
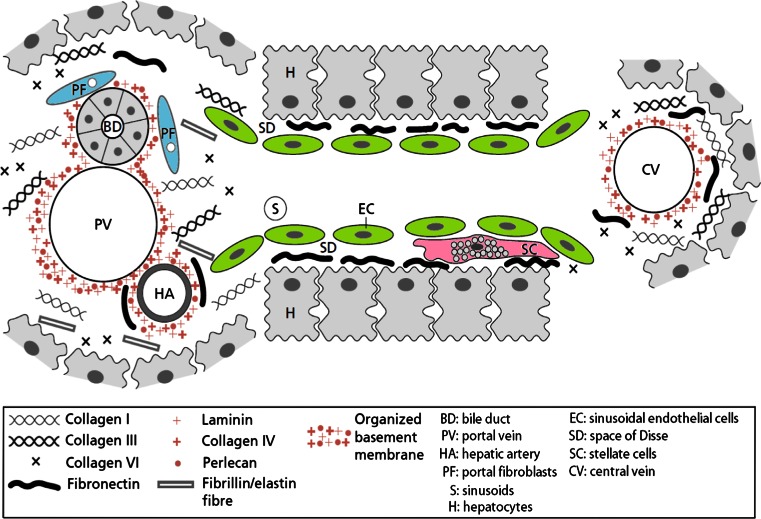
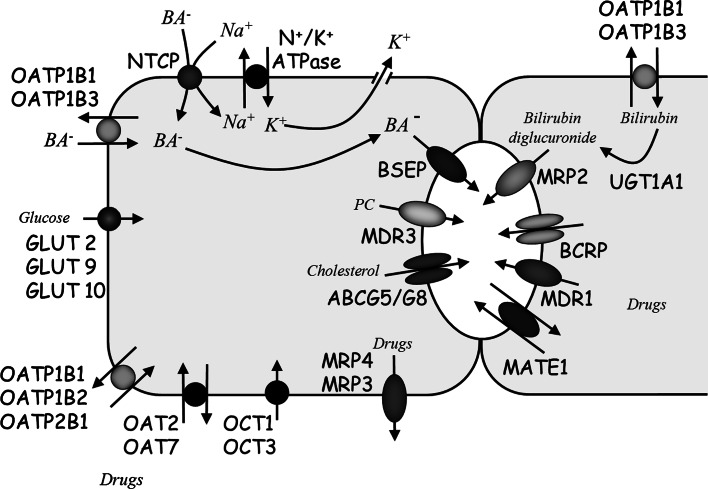
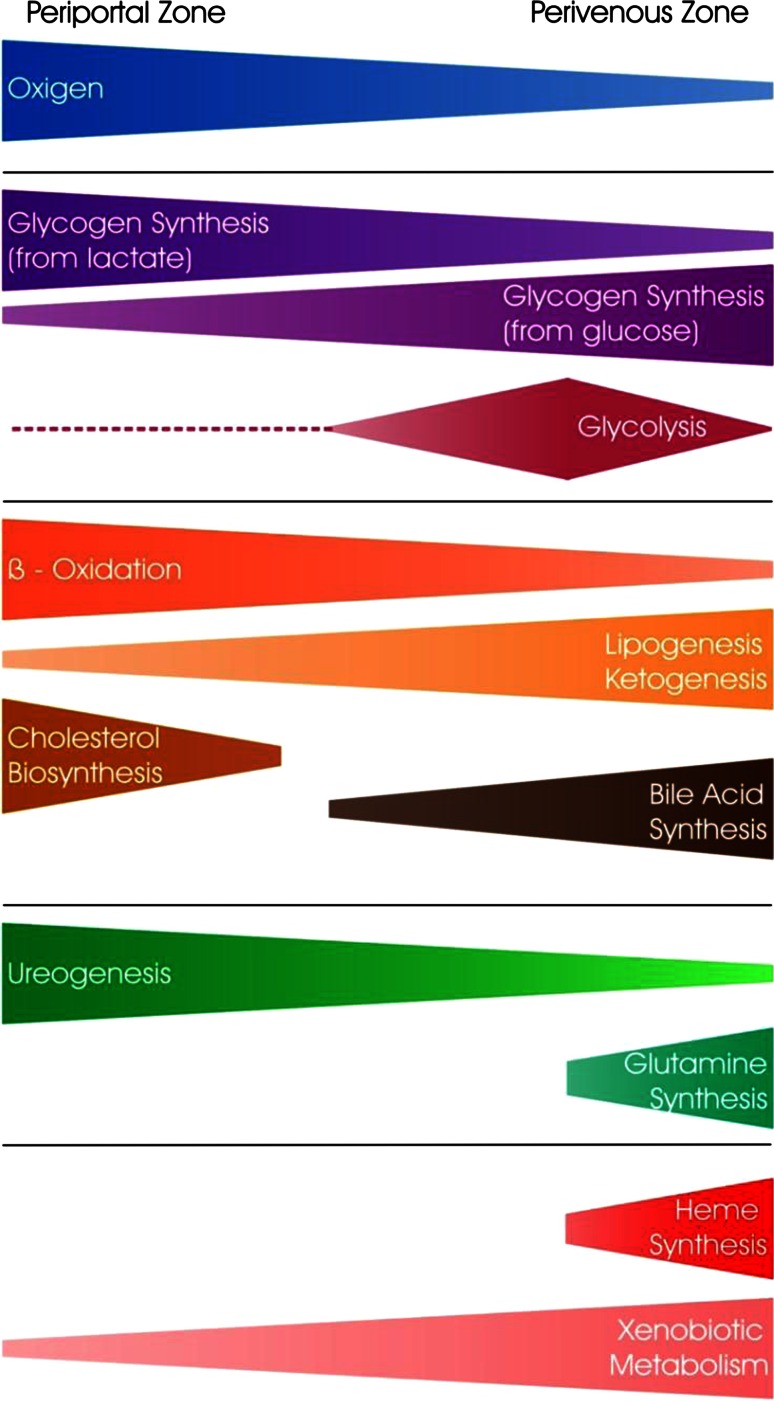
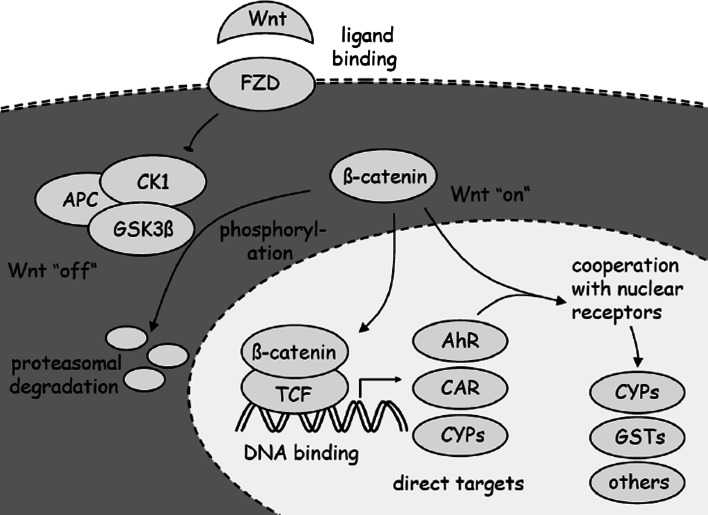
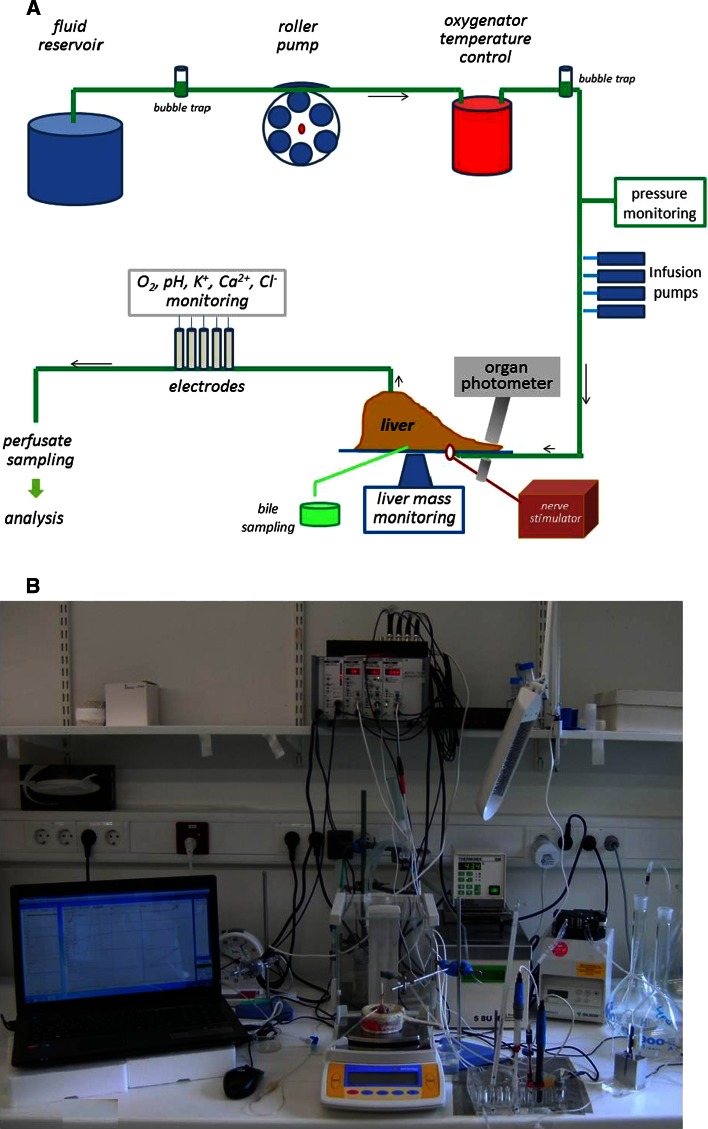
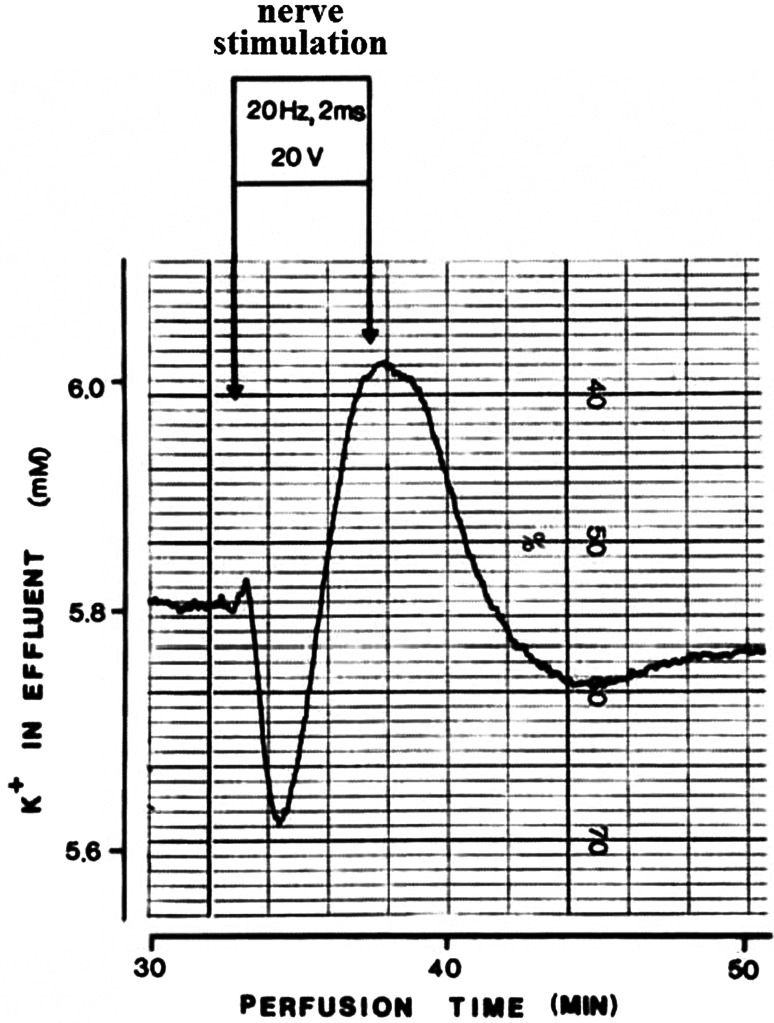
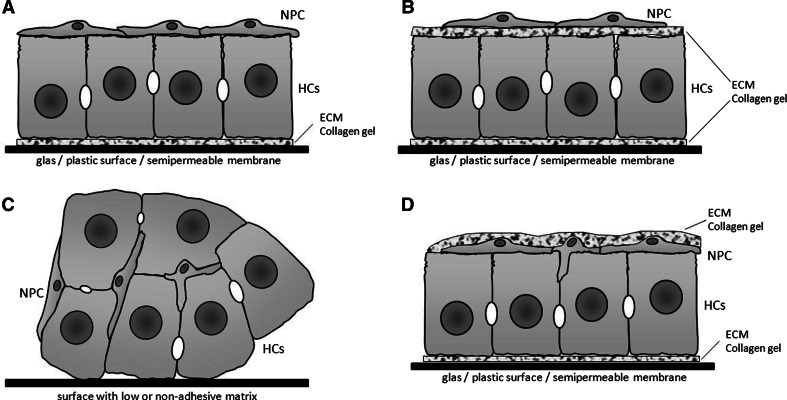
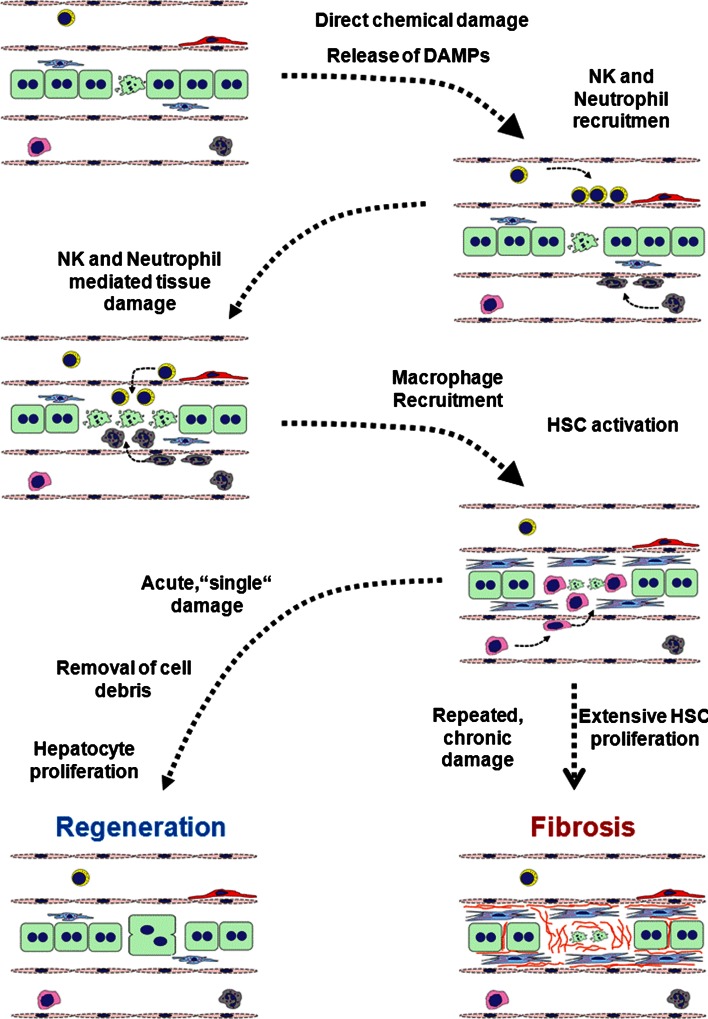
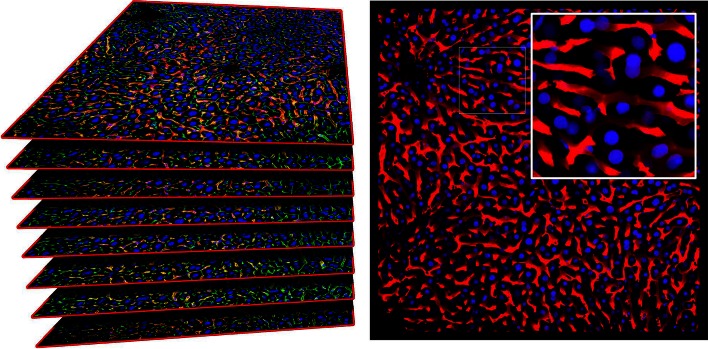
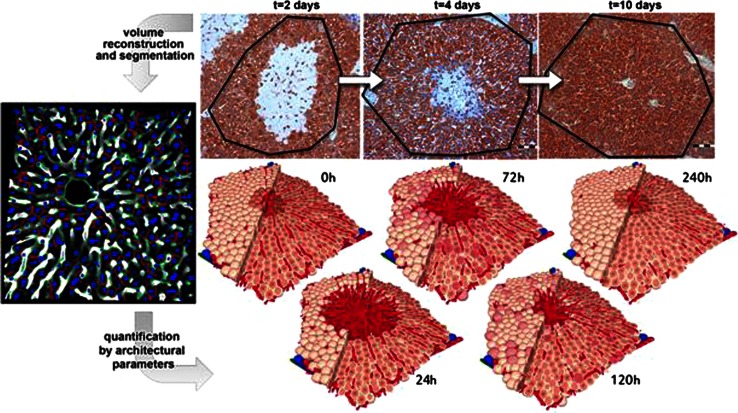
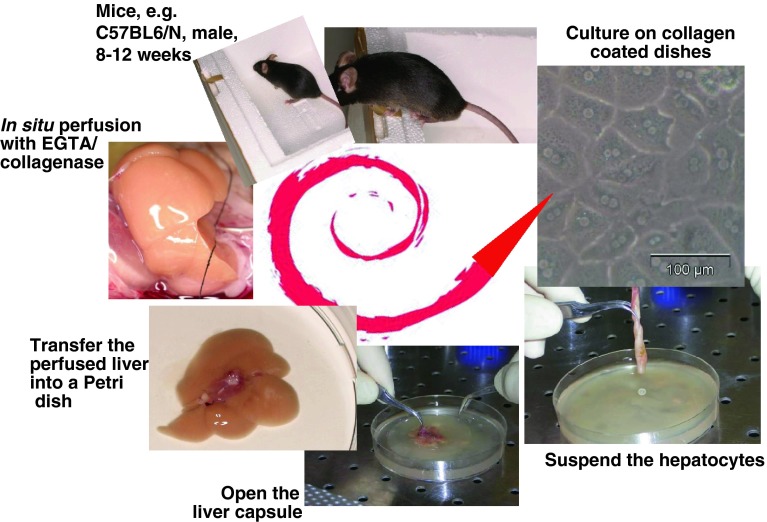
This review encompasses the most important advances in liver functions and hepatotoxicity and analyzes which mechanisms can be studied in vitro. In a complex architecture of nested, zonated lobules, the liver consists of approximately 80 % hepatocytes and 20 % non-parenchymal cells, the latter being involved in a secondary phase that may dramatically aggravate the initial damage. Hepatotoxicity, as well as hepatic metabolism, is controlled by a set of nuclear receptors (including PXR, CAR, HNF-4α, FXR, LXR, SHP, VDR and PPAR) and signaling pathways. When isolating liver cells, some pathways are activated, e.g., the RAS/MEK/ERK pathway, whereas others are silenced (e.g. HNF-4α), resulting in up- and downregulation of hundreds of genes. An understanding of these changes is crucial for a correct interpretation of in vitro data. The possibilities and limitations of the most useful liver in vitro systems are summarized, including three-dimensional culture techniques, co-cultures with non-parenchymal cells, hepatospheres, precision cut liver slices and the isolated perfused liver. Also discussed is how closely hepatoma, stem cell and iPS cell-derived hepatocyte-like-cells resemble real hepatocytes. Finally, a summary is given of the state of the art of liver in vitro and mathematical modeling systems that are currently used in the pharmaceutical industry with an emphasis on drug metabolism, prediction of clearance, drug interaction, transporter studies and hepatotoxicity. One key message is that despite our enthusiasm for in vitro systems, we must never lose sight of the in vivo situation. Although hepatocytes have been isolated for decades, the hunt for relevant alternative systems has only just begun.


Figures

Fig. 1
Fig. 1
a Cellular composition and architecture of the liver. Hepatocytes have two basolateral sides that face the sinusoidal blood vessels. The apical side consists of invaginations of the plasma membrane of adjacent hepatocytes. These invaginations form the strongly interconnected bile canaliculi. Tight junctions separate the apical compartments from the basolateral compartment. Adapted from Sasse et al. (1992). b Immunohistochemical analysis of cell components of normal human liver tissue: 1 hepatocytes (Hepar, ×400); 2 biliary epithelial cells (CK7, ×400); 3 endothelial cells (CD31, ×100); 4 vascular endothelial cells (CD34, ×100); 5 endothelial cells in lymphatic vessels (D2-40, ×100); 6 perineural cells of a nerve (S100, ×100); 7 stellate cells (S100, ×600); 8 laminin deposition in the vicinity of bile ducts (+) and vessels (−), indicating smooth muscle cells as well as a stellate sell (*) in a sinusoid (×400). All primary antibodies from DAKO®. Detection system: EnVision Flex high pH (Link)
Fig. 2
Fig. 2
Organization of the liver lobule and acinus. Based on the local blood composition, the acinus is roughly divided into three zones, 1 periportal, 2 transitional and 3 perivenous. The periportal zone is close to the portal triad vasculature and supplied by highly oxygenated blood (O2 partial pressure 60–70 mmHg). The perivenous zone is proximal to the central vein and receives poorly oxygenated blood (O2 partial pressure 25–35 mmHg). If no specific zonal mechanisms are active (such as pericentral metabolic activation of many hepatotoxic compounds, because many CYP enzymes are preferentially expressed in the center of the liver lobules), toxicity becomes visible at first in the periportal region, as this is the first zone to filter blood (Allen and Bhatia 2003). Adapted from Bacon et al. (2006)
Fig. 3
Fig. 3
Distribution of extracellular matrix (ECM) in the liver acinus. A basement membrane is localized in the periportal and perivenous regions. Fibronectin is the main ECM component of the liver parenchyma, and it is localized in the space of Dissé. Adapted from Rodés (2007)
Fig. 4
Fig. 4
Transport polarity of human hepatocytes. Sodium-dependent uptake of bile salts is mediated by NTCP, while OATP1B1 and OATP1B3 are responsible for sodium-independent bile salt uptake. Canalicular export of bile salts is mediated by BSEP. Glucose is taken up from blood by GLUT transporters. Xenobiotics are taken up by OATPs, OATs and OCTs and exported into bile by MDR1, MRP2 and BCRP (ABCG2) for fecal elimination. Some drugs are exported back into the blood for renal elimination by MRP3 and MRP4. Biliary lipid secretion, phosphatidylcholine (PC) and cholesterol require the concerted action of BSEP, MDR3 and ABCG5/ABCG8
Fig. 5
Fig. 5
Lobular zonation of different metabolic pathways. The length and thickness of the colored fields represents the localization and activity gradients of individual metabolic pathways along the porto-central axis
Fig. 6
Fig. 6
Wnt/β-catenin signaling and its role in drug metabolism. In the absence of agonistic Wnt signals, cytosolic β-catenin is phosphorylated by a cytosolic multi-protein complex and subsequently degraded in the proteasome. Wnt binding to FZD receptors impairs β-catenin degradation. As a consequence, the protein accumulates and translocates to the nucleus. Nuclear β-catenin interacts with TCF transcription factors and induces target gene transcription, e.g. nuclear receptors and certain drug-metabolizing enzymes. Cooperative interplay of β-catenin and nuclear receptors also contributes to the induction of drug-metabolizing enzymes, especially from the CYP and GST families
Fig. 7
Fig. 7
Setup for isolated rat liver perfusion in the open, non-recirculating, constant flow system. a The liver is posted on a balance pan, which allows for continuous monitoring of liver mass. Perivascular nerve stimulation is achieved by means of a platinum electrode placed around the portal vein. b Organ photometry/fluorimetry allows to monitor redox transitions in the NAD(P)H/NAD(P)+ system using nicotinamide nucleotide-specific wavelength pair 350–377 nm
Fig. 8
Fig. 8
Effect of electrical perivascular nerve stimulation on the K+ concentration in effluent perfusate (from Häussinger et al. 1987)
Fig. 9
Fig. 9
Antiproteolytic effect of acetaldehyde in the single pass perfused rat liver. a Acetaldehyde (5 mmol/l) was infused into the perfused liver for 30 min, and the release of [3H]leucine from pre-labeled rats was taken as a measure of proteolysis. b The resulting inhibition of proteolysis under steady-state conditions at different concentrations of acetaldehyde. Data are from 2 to 4 different experiments and are given as mean ± SEM. From vom Dahl and Häussinger (1998)
Fig. 10
Fig. 10
Retrograde/antegrade liver perfusion for studies on hepatocyte heterogeneity. The technique was first used in studies on hepatic ammonia metabolism (Häussinger 1983). Urea cycle enzymes are located in periportal hepatocytes, whereas glutamine synthetase is located in a small perivenous hepatocyte population surrounding the terminal hepatic venule. Under conditions of limited ammonia supply, the metabolic fate of ammonia is dependent on the direction of liver perfusion
Fig. 11
Fig. 11
The influence of macrophage activation on hepatocyte function during lipopolysaccharide (LPS)-induced inflammation depends on the ability of direct cell–cell interaction. Co-culture experiments suggest that the distance between macrophages and hepatocytes and the possibility of direct cell–cell contacts plays an important role for the impact of activated macrophages on hepatocytes during lipopolysaccharide-induced inflammation. Moreover, the data suggest that hepatocyte-derived factors such as the acute phase protein, lipopolysaccharide-binding protein (LBP), is a strong feedback modulator of the inter-cellular communication, since it is produced by hepatocytes in response to cytokines derived from activated macrophages and further enhances macrophage activation. B contrast, co-culture conditions that allow exchange of soluble mediators but no direct cell–cell contact (as is the case under normal conditions with macrophages and hepatocytes which are separated by sinusoidal endothelial cells and the space of Dissé) result in a suppression of the inflammatory macrophage response toward lipopolysaccharide with reduced release of TNFα and upregulation of the production of IFNβ and the anti-inflammatory cytokine IL-10
Fig. 12
Fig. 12
Time course of albumin secretion by hepatocytes within alginate, alginate/GC (a) and alginate/GC/heparin (b) sponges. Albumin secretion rates were measured with various concentrations of GC to alginate contents under the fixed alginate concentration, and heparin to alginate contents under the fixed GC concentration
Fig. 13
Fig. 13
Scanning electron micrographs of a cross section of alginate/GC scaffolds as a function of the freezing temperature: (a) −20 °C, (b) −70 °C and (c) liquid nitrogen
Fig. 14
Fig. 14
Scanning electron micrographs showing the structure of alvetex polystyrene scaffold. a Alvetex is a highly porous (>90 %) material comprised of interconnecting voids. Essentially, alvetex creates “space” and introduces the third dimension to polystyrene. Inside the scaffold, cells occupy and grow in 3D in the space created, maintaining a more natural shape and form. b Alvetex is engineered as a 200-μm-thick membrane, ensuring that any cell is no further than 100 μm away from the source of culture medium. This distance compares favorably with the majority of tissue types and avoids the formation of cellular necrosis in central regions of the scaffold
Fig. 15
Fig. 15
Example of hepatocytes cultured for 7 days in an Alvetex scaffold. Cells maintain a natural 3D morphology and form close associations with adjacent cells thus creating a tissue-like structure. This sample has been fixed, embedded, transverse sectioned and stained with hematoxylin and eosin. Scale bar 30 μm
Fig. 16
Fig. 16
Phase-contrast micrographs of encapsulated hepatocytes in alginate/calcium capsules (a) and galactosylated alginate/calcium capsules (b)
Fig. 17
Fig. 17
Models of combined co-culture and 3D systems. a Hepatocytes grown on a soft collagen surface overlaid by non-parenchymal cells, e.g. endothelial or hepatic stellate cells. b Hepatocytes cultured in sandwich configuration, overlaid by non-parenchymal cells; under these conditions, no heterotypic cell–cell contacts are possible. c Hepatocyte/non-parenchymal cell spheroids, grown on low or non-adhesive matrices. d Hepatocytes and non-parenchymal cells sandwiched in ECM matrices. These conditions enable heterotypic cell–cell communication. Different culture surfaces, e.g. glass, plastic or semi-permeable membranes, can be used. NPC non-parenchymal cells, HCs hepatocytes, ECM extracellular matrix
Fig. 18
Fig. 18
a Confocal image of whole-mount staining of primary rat liver microtissue in co-culture with non-parenchymal cells. The endothelial marker ICAM-1 is visualized by red, bile canalicular marker DPPIV is shown by green, and nuclei are by blue fluorescence. The picture was kindly provided by Dr. Seddik Hammad, IfaDo, Dortmund. b Paraffin section and immunostaining of primary rat liver microtissue in co-culture with NPCs. Kupffer macrophage marker CD68 is visualized by green color, whereas nuclei appear in gray
Fig. 19
Fig. 19
Cell assembly of hepatocytes and liver endothelial cells in HepaChip®. a Assembly of primary mouse hepatocytes onto the cell assembly ridges in less than 2 min. b After 4-h culture, sparsely assembled cryopreserved human hepatocytes are labeled with Calcein-green fluorescence demonstrating the initial cord-like arrangement. c Assembly of cryopreserved mouse liver endothelial cells (Calcein-red) onto 4-h cultured hepatocytes (Calcein-green)
Fig. 20
Fig. 20
Sinusoid-like shape of a 96-h-old hepatocyte/endothelial cell culture in HepaChip®. a Micrograph overlay of DAPI fluorescence and transmission microscope images. b Immunofluorescence image of von Willebrandt factor (green) decorated endothelial cells and DAPI (blue) nuclei. c Enlarged receptive of image B showing clearly an endothelial cell characteristic granular pattern of von Willebrandt factor in HepaChip® “sinusoids”
Fig. 21
Fig. 21
Primary mouse hepatocytes and liver endothelial cells: Phase I biotransformation in HepaChip® and standard 2D cell cultures. CYP3A metabolism was measured using testosterone hydroxylation (a) and CYP1A2 activity using phenacetin metabolism to acetaminophen (b). Data represent mean values ± SD of four mice
Fig. 22
Fig. 22
Primary mouse hepatocytes and liver endothelial cells: Phase II biotransformation in HepaChip® and standard 2D cell cultures. Sulfotransferase (a) and UDP glucuronosyltransferase (b) activities were measured using 7-hydroxycoumarin as a substrate (b). Data represent mean values ± SD of four mice
Fig. 23
Fig. 23
Primary mouse hepatocytes and liver endothelial cells: urea (a) and albumin (b) secretion in HepaChip® versus standard 2D cell cultures. Data represent values ± SD of four mice
Fig. 24
Fig. 24
a Hepatocyte polarization in 2D and 3D collagen gel. In the collagen “sandwich” gel, hepatocytes assume a typical polar structure, with multiple basolateral and apical compartments. The basolateral sides face the collagen layers and the apical sides face the bile canaliculi. By contrast, hepatocytes on collagen monolayers are flattened and form actin stress fibers. Adapted from (Dunn et al. 1991). b Formation of canaliculi in micropatterned sandwich culture. The hepatocytes are cultured in micromolded collagen pits of increasing diameters. Following 2 days in culture, the hepatocytes have formed a canalicular network (green staining). The canalicular network appears more organized in the pits than in a conventional non-patterned sandwich culture. A pit diameter of 80–100 µm is optimal for canaliculi formation. Scale bar 100 µm (from Matsui et al. 2012)
Fig. 25
Fig. 25
Mimicking liver plates and fenestrated endothelium by seeding the hepatocytes in chambers enclosed by microfabricated pores. a1 Schematic representation of the system developed by Toh et al. (2009). An array of micropillars separates the microchannel in the central compartment containing the seeded hepatocytes and two-side compartments with the perfusing media. a2 Transmitted light image of seeded hepatocytes. b12 SEM micrograph and schematic representation of the microfluidic artificial sinusoid. The central channel containing the hepatocytes and the outer flow channel have a width of 50 µm and a height of 30 µm. b3a3b phase-contrast and epifluorescence images (calcein and ethidium homodimer-1 staining) of hepatocytes seeded at low density. The images indicate that hepatocytes have a low viability at low cell density. b3cd By contrast, hepatocytes seeded at high density are viable, as visible from the calcein staining (green) (from Lee et al. 2007)
Fig. 26
Fig. 26
Self-assembly of sinusoid-like structures in vitro by co-culturing hepatocytes and endothelial cells. Endothelial cells were seeded on Matrigel. The endothelial cells rapidly formed tubes. Subsequently, freshly isolated hepatocytes were randomly seeded in the culture. The hepatocytes directionally migrated toward the artificial vasculature and adhered to it. The image shows hepatocytes decorating an endothelial cell tube at day four in co-culture. Double-immunofluorescence staining for endothelial cells (CD31, red) and hepatocytes (CK-18, green). Scale bar 200 µm (from Nahmias et al. 2006b)
Fig. 27
Fig. 27
Phosphorylated and total ERK1/2 and Akt in liver tissue from C57BL6/N mice (“liver”), freshly isolated hepatocytes (“fresh hep”), hepatocytes cultured on stiff and dry collagen (“Col. Monolayer”) and between two layers of soft gel collagen (“Col Sandwich”) (Godoy et al. 2009)
Fig. 28
Fig. 28
Influence of hepatocyte culture conditions on signaling and phenotype. When hepatocytes are isolated from the organ and cultured on stiff and dry collagen (“collagen monolayers”), at least two signaling pathways (ERK and Akt) are activated. The activation process involves focal adhesion kinase (FAK) and src although the exact mechanisms initiating this process are still unknown. Signaling via the Ras/Raf/ERK pathway (“MAP kinase”) causes dedifferentiation and epithelial to mesenchymal transition (EMT). Activation of the PI3K/Akt pathway causes resistance to apoptosis. Both pathways are strongly activated in collagen monolayers but much less in collagen sandwich cultures (Godoy et al. 2009)
Fig. 29
Fig. 29
Epigenetic control mechanisms of gene transcription. Inhibition of gene transcription typically corresponds with hypermethylated CpG islands in gene promoter regions and deacetylated histone tails at local chromatin domains. HDAC inhibitors (HDACi) and DNMT inhibitors (DNMTi) modulate the chromatin structure. They create an open, transcriptionally active euchromatin configuration at gene coding and regulatory regions, accessible for transcription factors (TF), thereby facilitating gene transcription. 5-AzaC decitabine, M, 5-methyl cytosine at CpGs, SB sodium butyrate, TSA Trichostatin A, VPA valproic acid (from Snykers et al. 2009)
Fig. 30
Fig. 30
Biogenesis of miRNA. miRNAs are processed through the canonical pathway or mirtron pathway into pre-miRNA. After exporting the pre-miRNA from the nucleus to the cytoplasm, miRNA–miRNA* duplexes are formed after cleavage by Dicer. From this duplex, only the guide strand is loaded into the RISC complex, forming miRISC. This complex will cause translational repression or mRNA cleavage. DGCR DiGeorge syndrome critical region, Pre-miRNA Precursor miRNA, Pri-miRNA Primary miRNA, RISC RNA-induced silencing complex
Fig. 31
Fig. 31
Modulation of CYP activity levels in HepG2 cells transduced with CYP adenoviruses. HepG2 cells were individually transfected with increasing doses (moi) of adenoviruses encoding CYP1A2 (a), CYP2C9 (b) or CYP3A4 (c). Afterward, activities were determined for 48 h using phenacetin, diclofenac or midazolam as selective substrates, respectively. Activity data are expressed as pmol of the corresponding metabolite formed per minute and per mg of cell protein
Fig. 32
Fig. 32
CYP activities in HepG2 cells simultaneously transduced with a mix of adenoviruses encoding CYP1A2, CYP2C9 and CYP3A4. HepG2 cells were co-transfected with a mixture of adenoviral CYP constructs (6 moi CYP1A2 + 90 moi CYP2C9 + 66 moi CYP3A4). CYP1A2 (phenacetin O-deethylation), CYP2C9 (diclofenac 4′-hydroxylation) and CYP3A4 (midazolam 1′-hydroxylation) were determined 48 h later in the cells and compared to those in control HepG2 cells and human hepatocytes (HH) in primary culture. Activity values are expressed as pmol of the corresponding metabolite formed per minute and per mg of cell protein
Fig. 33
Fig. 33
Aflatoxin B1-induced toxicity in upgraded HepG2 cells. Metabolically competent HepG2 cells (prepared by co-transduction with CYP1A2, CYP2C9 and CYP3A4 adenoviruses) or control HepG2 cells were treated for 24 h with increasing concentrations of Aflatoxin B1. Cell viability (a), nuclear changes indicative of apoptotic death (b), mitochondrial membrane potential (MMP) (c) and intracellular calcium concentration (d) were compared in both cell systems (*p < 0.01). Results are expressed as percentage of untreated cells
Fig. 34
Fig. 34
Scheme of key simultaneous processes of hepatocyte disposition. From Baker and Parton (2007)
Fig. 35
Fig. 35
Relation of predicted CLint, in vitro and CLint, in vivo for hepatocytes (a) and microsomes (b). Dashed lines represent unity, fitted power functions and (a) upper and lower limits of bias correction for hepatocytes. From: Hallifax et al. 2010
Fig. 36
Fig. 36
Comparison of CLint in cryopreserved HepaRG cells and cryopreserved human hepatocytes. The solid line is the line of identity; the dashed line is the line of regression. From Zanelli et al.
Fig. 37
Fig. 37
Simulation of blood and liver concentration profiles based on a simple PBPK model shown in Fig. S6; see 10.1007/s00204-013-1078-5
Fig. 38
Fig. 38
PPARα transcriptional regulatory network and dose-dependent transition. Rectangular nodes indicate regulatory transcription factors (TFs), with the PPARα- RXRα heterodimer marked with a bold label. Each edge in the network indicates binding of a TF to the promoter of a target gene (circular nodes). a The “latent” network showing: (1) direct genomic binding by PPARα (thick black edges); (2) indirect genomic binding by PPARα (light blue edges); (3) non-genomic interactions (NGI) mediated by other TFs (dark blue edges). Dose-dependent evolution of the network indicated by expression levels of target genes at 72 h for PPARα ligand concentrations of b 0.001 μM and c 10 μM
Fig. 39
Fig. 39
Activation of different death receptor signaling pathways depending on the culture conditions of hepatocytes. In the mouse liver and when kept in suspension right after isolation, hepatocytes undergo apoptosis in response to FasL in a manner dependent on the BH3-only protein Bid and mitochondrial outer membrane permeabilization (cytochrome c release) (so-called type II signaling). However, when plated on a stiff collagen monolayer or embedded into a soft collagen sandwich, the FasL signaling pathway switches to a more direct manner that bypasses mitochondria and cleaves and activates effector caspase-3 directly by death receptor-bound caspase-8 (type I signaling). Interestingly, TNFa signaling does not switch in collagen-cultured hepatocytes, as sensitization of FasL-induced apoptosis by a pretreatment with TNFa remains Bid/mitochondria (type II)-dependent
Fig. 40
Fig. 40
Induction of lipid accumulation in hepatocytes in vitro. Oil red O staining of primary human hepatocytes (PHHs) incubated with b: palmitate (0.2 mM) or (a) FFA-free BSA, which served as a control
Fig. 41
Fig. 41
Dose-dependent induction of cellular triglyceride accumulation in hepatocytes in vitro. Colorimetric quantification of the intracellular triglyceride concentration in primary human hepatocytes exposed to 0.1–0.4 mM palmitate (*P < 0.05 compared to control)
Fig. 42
Fig. 42
Mechanisms of drug-induced liver injury (DILI). 1 Detoxification of chemically reactive metabolites (CRM) by conjugation with glutathione. However, high demand or reduced replenishment of glutathione can prevent such detoxification, leaving the liver at increased risk of injury. 2 Altered calcium homeostasis due to chemically reactive metabolite (CRM) presence can cause actin disassembly, cell membrane blebbing and lysis. 3 CRM may bind to transport pumps or actin around the bile canaliculi preventing bile export. 4 CRM binding to mitochondrial proteins may reduce ATP formation, produce ROS, and open the MPTP causing apoptosis. Apoptosis is ATP dependent. Due to the lack of ATP formation necrosis occurs. 5 Immune stimulation via the hapten or prohapten mechanisms leading to either humoral (B cell) or cell-mediated (T-cell) reactions. B cells produce antibodies that cause inflammation and cell damage; T-cell release cytotoxic cytokines causing apoptosis. 6 The same as the aforementioned immune activation, however, this occurs by the PI mechanism using the parent drug. 7 TNF receptor sensitivity may be heightened increasing responsiveness to TNF, leading to reduced NF-kappaβ, and apoptotic caspase activation. DME drug-metabolizing enzyme, CRM chemically reactive metabolite, ROS reactive oxygen species, MPTP mitochondrial permeability transition pore, APC antigen-presenting cell, MRP2 multidrug resistance protein 2, NF-kappaβ nuclear factor kappa beta (from Lee ; Kaplowitz ; Bleibel et al. 2007)
Fig. 43
Fig. 43
Mechanisms of immune stimulation by drugs. a Hapten theory—a drug binds to self-proteins causing the immune system to recognize the protein–hapten complex as foreign. This may be followed by antigen uptake and processing by APCs creating peptides which are then covalently bound on MHC molecules on the APC surface for presentation to T cells. b Prohapten theory—the same process as for the hapten mechanism but the drug is first metabolized to a CRM which then acts as the hapten. c The parent drug is directly expressed in a MHC-dependent, non-covalent fashion to T cells (from Pichler et al. 2006)
Fig. 44
Fig. 44
In vivo: in vitro correlation of gene expression alterations (from Heise et al. 2012). Aflatoxin B1 (AB1), 2-nitrofluorene (2-NF), methapyrilene (MP) and piperonyl-butoxide (PBO) were tested after oral administration to male Wistar rats (gene expression analysis 24 h after administration) and in sandwich cultures of hepatocytes isolated from male Wistar rats (incubation period: 24 h). In vitro, the test compounds were used at three concentrations (C1: low; C2: intermediate; C3: high, corresponding to the in vitro EC20). 22 Genes were analyzed that either belong to the group of “stress response genes” or represent “proliferation associated genes”
Fig. 45
Fig. 45
Schematic representation of potential immune cell participation in liver injury induced by hepatotoxic drugs (see Table 8 for details). Upon direct chemical-induced damage, only a small fraction of parenchymal cells (hepatocytes) are killed, releasing death-associated molecular patterns (DAMPs) such as CpG-rich DNA, which are detected by TLR9 expressed in LSEC, HSC and Kupffer cells. In turn, these cells release cytokines (e.g. TNFα, IL-1) which trigger the secretion of chemokines (e.g. Cxcl1) that recruit NK cells and neutrophils. These leukocytes infiltrate the parenchyma at the site of initial injury, where they further extend tissue damage by their cytotoxic arsenal (e.g. IFNγ, Fas-L in NK cells; hypochlorous acid, proteases in neutrophils). Afterward, circulating monocytes are recruited to the site of injury by chemokines (e.g. Cxcl2, RANTES, Mcp-1), where they become infiltrating macrophages (IM). These IM can resolve the cytotoxic immune milieu, by inducing apoptosis of infiltrating neutrophils and by actively removing cell debris. At the same time, HSC become activated and promote tissue repair by deposition of extracellular matrix (collagen-). If there is a single-acute injury, the inflammatory process will regress and the parenchyma will be reconstituted, mainly due to hepatocyte proliferation. However, if the damage is repeated chronically, activated HSC proliferate leading to fibrotic scarring, characterized by extensive collagen I deposition in the parenchyma
Fig. 46
Fig. 46
Identification of DILI compounds. It was found that a threshold of 100 times the average single-dose human therapeutic Cmax represented a reasonable threshold that differentiated positive (toxic) versus negative (non-toxic) drugs for idiosyncratic DILI. Sandwich-cultured human hepatocytes were treated with drugs for 24 h before subject to staining by a mixture of fluorescent probes for nuclei/lipids, reactive oxygen species, mitochondria and reduced glutathione. The negative controls included famotidine, fluoxetine and vehicle controls. The positive drugs included drugs that cause DILI in the clinic, e.g. nimesulide, telithromycin, nefazodone and perhexiline (for further experimental details, please refer to Xu et al. 2008)
Fig. 47
Fig. 47
CP-724,714 was found to completely abolish the activity of bile salt efflux pump (BSEP) in sandwich-cultured primary human hepatocyte cultures compared to vehicle-treated controls. The nuclei were stained with Hoechst. The bile canaliculi were stained by cholyl lysyl fluorescein (CLF), a substrate for BSEP. The clinical development of CP-724,714, a small molecule Her2 inhibitor for oncology indications, was stopped in phase 2 due to jaundice and cholestatic liver damage (for further experimental details, refer to Xu et al. 2012)
Fig. 48
Fig. 48
Left: Hepatocytes on collagen (I) spot after 5 days in culture (from Jones et al. 2009). Right Corresponding situation in the monolayer culture system
Fig. 49
Fig. 49
Left Stack of typical experimental images in confocal microscopy (Blue DAPI, Red DokaMS, Green DPPIV). Right Three-dimensional reconstruction and segmentation of all structures relevant to the in vivo model (Red Sinusoids, Blue Cell nuclei)
Fig. 50
Fig. 50
This scheme illustrates the general strategy of how architectural parameters obtained by image analysis of confocal micrographs (left) are used together with a quantification of dynamic processes in the liver (top row: regeneration after intoxication with CCl4; brown: hepatocytes, blue: central necrosis) to construct a dynamic model of the in vivo situation (bottom row: regeneration after intoxication in the model; light rose: quiescent hepatocytes, dark rose: proliferating hepatocytes, brown: glutamine synthetase positive hepatocytes, red: sinusoids, central and portal vein, blue: portal artery). Left picture: confocal micrographs after image processing; blue: hepatocytes nuclei, white: sinusoids
Fig. 51
Fig. 51
Overview over the hepatocyte isolation process. The procedure can be applied to livers of humans, rats, mice and other species
Fig. 52
Fig. 52
Liver cell isolation setup. a Ready-to-use sterile work area with sterile drape sheet, glass and plastic dishes, scalpel, forceps, cell scraper, gauze and cannula for perfusion. b Perfusion system with water bath, thermostat, peristaltic pump and Buchner funnel. c Plastic funnel with aseptic gauze and 50-ml tubes for the filtration of the cell suspension after the isolation procedure
Fig. 53
Fig. 53
a Resected liver piece on a sterile work area in the surgical suite showing a colorectal liver metastasis (see arrow) after right-lateral hemihepatectomy. b Preparation of the piece of liver tissue for the perfusion procedure using an amputation knife
Fig. 54
Fig. 54
a A buttoned cannula is placed in a blood vessel and fixed with tissue glue. b The first perfusion step is carried out in order to remove residual blood and to warm up the tissue. c Recirculation of Collagenase P-containing perfusion solution for digestion of the liver tissue during perfusion step II. d The digested liver tissue is gently tweezed and cut into two halves with a scalpel, before the cells are released into the surrounding stop solution
Fig. 55
Fig. 55
Digested liver tissue: The left side of the tissue shows the typical morphology of digested tissue matrix after harvesting the hepatocytes. The right side, however, has not been sufficiently perfused and therefore the tissue remains intact
Fig. 56
Fig. 56
Separation of viable and dead hepatocytes by density gradient centrifugation. a A 25 % Percoll solution is carefully overlaid with the suspension containing a maximum of 50 million viable cells. b After the centrifugation, the dead cells and the cell debris are located at the interphase, while viable cells are pelleted
Fig. 57
Fig. 57
Progressive workflow of rat liver perfusion

References

    1. Abe T, Unno M, Onogawa T, Tokui T, Kondo TN, Nakagomi R, Adachi H, Fujiwara K, Okabe M, Suzuki T, Nunoki K, Sato E, Kakyo M, Nishio T, Sugita J, Asano N, Tanemoto M, Seki M, Date F, Ono K, Kondo Y, Shiiba K, Suzuki M, Ohtani H, Shimosegawa T, Iinuma K, Nagura H, Ito S, Matsuno S. LST-2, a human liver-specific organic anion transporter, determines methotrexate sensitivity in gastrointestinal cancers. Gastroenterology. 2001;120:1689–1699. - PubMed
    1. Abramovitch S, Dahan-Bachar L, Sharvit E, Weisman Y, Bentov A, Brazowski E, Reif S. Vitamin D inhibits proliferation and profibrotic marker expression in hepatic stellate cells and decreases thioacetamide-induced liver fibrosis in rats. Gut. 2011;60:1728–37. - PubMed
    1. Abshagen K, Eipel C, Kalff JC, Menger MD, Vollmar B. Loss of NF-kappaB activation in Kupffer cell-depleted mice impairs liver regeneration after partial hepatectomy. Am J Physiol Gastrointest Liver Physiol. 2007;292:G1570–7. - PubMed
    1. Abshagen K, Eipel C, Kalff JC, Menger MD, Vollmar B. Kupffer cells are mandatory for adequate liver regeneration by mediating hyperperfusion via modulation of vasoactive proteins. Microcirculation. 2008;15:37–47. - PubMed
    1. Abu-Absi SF, Friend JR, Hansen LK, Hu WS. Structural polarity and functional bile canaliculi in rat hepatocyte spheroids. Exp Cell Res. 2002;274:56–67. - PubMed

MeSH terms

Substances