. 2014 Jan;99(1):116-24.
doi: 10.3324/haematol.2013.088286. Epub 2013 Aug 23.

STAT3-mediated activation of microRNA cluster 17~92 promotes proliferation and survival of ALK-positive anaplastic large cell lymphoma

Affiliations

STAT3-mediated activation of microRNA cluster 17~92 promotes proliferation and survival of ALK-positive anaplastic large cell lymphoma

Elisa Spaccarotella et al. Haematologica. 2014 Jan.

Abstract

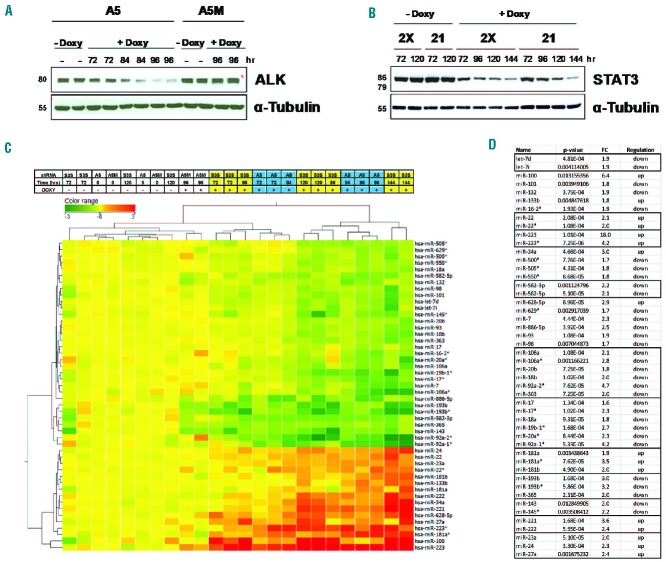
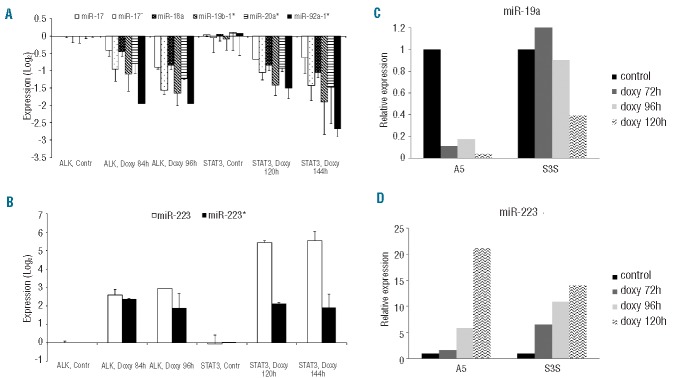
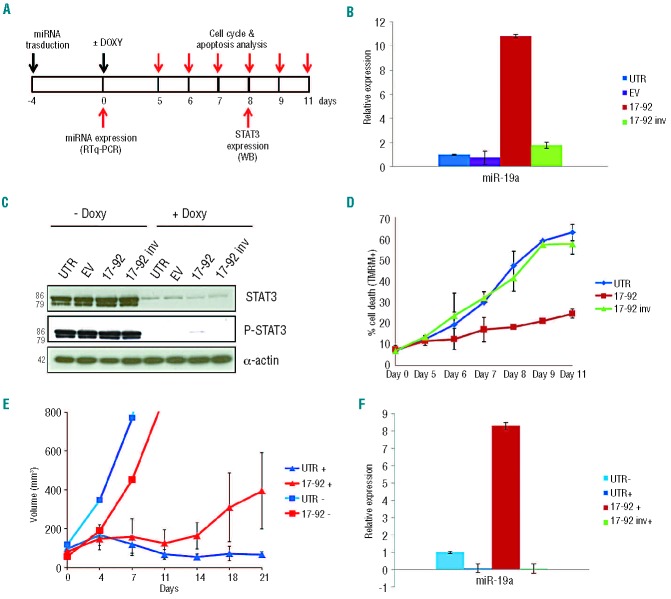
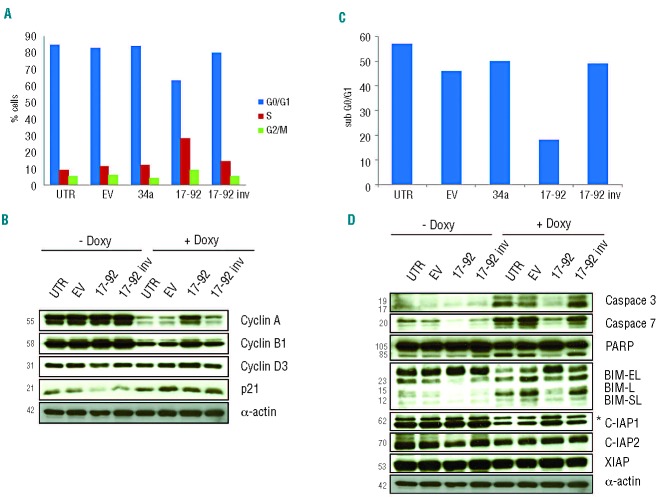
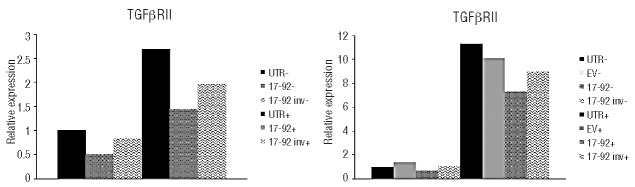
Systemic anaplastic large cell lymphoma is a category of T-cell non-Hodgkin's lymphoma which can be further subdivided into two distinct entities (ALK(+) and ALK(-)) based on the presence or absence of ALK gene rearrangements. Among several pathways triggered by ALK signaling, constitutive activation of STAT3 is strictly required for ALK-mediated transformation and survival. Here we performed genome-wide microRNA profiling and identified 48 microRNA concordantly modulated by the inducible knock-down of ALK and STAT3. To evaluate the functional role of differentially expressed miRNA, we forced their expression in ALK(+) anaplastic large cell lymphoma cells, and monitored their influence after STAT3 depletion. We found that the expression of the microRNA-17~92 cluster partially rescues STAT3 knock-down by sustaining proliferation and survival of ALK(+) cells. Experiments in a xenograft mouse model indicated that forced expression of microRNA-17~92 interferes with STAT3 knock-down in vivo. High expression levels of the microRNA-17~92 cluster resulted in down-regulation of BIM and TGFβRII proteins, suggesting that their targeting might mediate resistance to STAT3 knock-down in anaplastic large cell lymphoma cells. We speculate that the microRNA-17~92 cluster is involved in lymphomagenesis of STAT3(+) ALCL and that its inhibition might represent an alternative avenue to interfere with ALK signaling in anaplastic large cell lymphomas.


Figures

Figure 1.
Figure 1.
(A–B) Kinetics of ALK and STAT3 knock-down (KD) in the ALK-positive ALCL cell line TS-SUP-M2. (A) TS-SUP-M2 cells co-transduced with pLV-tTR-KRAB/DsRed and pLVTH-ALK-A5/GFP (A5) or with the mutated pLVTH-ALKA5M/GFP (A5M) lentiviral preparations were cultured in the presence (+ Doxy) or absence (− Doxy) of doxycycline (1 μg/mL) and harvested at the indicated times. Whole-cell lysates were analyzed by western blotting with anti-α-tubulin or ALK antibodies. (B) Two clones (2X and 21) derived from TS-SUP-M2 cells co-transduced with pLV-tTR-KRAB/DsRed and pLVTH-STAT3-S3S/GFP (S3S) lentiviral preparations were cultured in the presence (+ Doxy) or absence (− Doxy) of doxycycline (1 μg/mL) for the indicated time intervals and analyzed by western blotting with anti-α-tubulin or STAT3 antibodies. (C) Heatmap representation of miRNA modulated by ALK or STAT3 inducible KD in TS-SUP-M2 cells. Light blue and yellow lanes designate ALK- and STAT3-silenced samples, respectively. RNA samples from two independent replicates were hybridized on a human miRNA microarray (#G4470B, Agilent Technologies). Differentially expressed miRNA were employed for sample cluster analysis using the Manhattan correlation as a measure of similarity. Expression levels are referred to control samples. Upregulated miRNA are shown in red, downregulated miRNA are shown in green. A5M, A5, and S3S indicate control, ALK, or STAT3 shRNA, respectively. (D) miRNA concordantly modulated by ALK or STAT3 KD. miRNA clusters are highlighted by the same color. FC: fold change after STAT3 KD (late time points vs. controls); P value: P value of an unpaired t-test with Benjamini-Hochberg correction; regulation: direction of miRNA expression modulation after STAT3 KD.
Figure 2.
Figure 2.
Expression levels of representative miRNA in TS-SUP-M2 cells. Quantification of the miR-17~92 cluster (A) and miR-223 (B), as revealed by genome-wide miRNA profiling following ALK or STAT3 inducible KD. Relative quantities are log2 normalized to control samples. The error bars report standard deviations from duplicates. (C–D) Validation of ALK/STAT3-mediated miR-19a and miR-223 regulation by RT-qPCR. Changes of mature miR-19a and miR-223 levels, normalized to RNU6B expression, were measured at the indicated time points after doxycycline treatment in an independent experiment. Relative quantities are log2 normalized to control samples.
Figure 3.
Figure 3.
(A) Experimental design to evaluate the functional role of miR-17~92 cluster expression in the TS-SUP-M2 S3S cell line, after STAT3 KD by doxycycline treatment. (B) miR-19a expression levels in TS-SUP-M2 S3S cells transduced with lentiviral particles expressing the indicated miRNA, as detected by RT-qPCR 4 days after infection. (C) STAT3 and phosho-STAT3 expression in TS-SUP-M2 S3S cells 8 days after doxycycline treatment detected by western blot analysis with the indicated antibodies. (D) Apoptosis analysis in TS-SUP-M2 S3S cells expressing the indicated miRNA at different time points after induction of STAT3 KD by doxycycline. Analysis was performed by TMRM staining-flow cytometry. These findings are representative of three independent experiments. (E) Tumor growth curves of TS-SUP-M2 S3S cells injected into NSG mice in the absence (−) or presence (+) of doxycycline. TS-SUP-M2 S3S cells untransduced (UTR) or transduced with miR-17~92 cluster (17-92) were injected subcutaneously into eight NSG mice. Two weeks after cell injection, six mice of each group were treated with 0.1 mg/mL doxycycline to induce STAT3 KD (+), and two mice remained untreated (−). Tumor growth was monitored over time by determining the volume of tumor masses. Error bars indicate standard deviation. (F) miR-19a expression levels in mice tumors over-expressing the indicated miRNA after sacrifice of the animals, as determined by RT-qPCR. UTR: untransduced cells; EV: empty vector; 17~92: miR-17~92 cluster; 17~92 inv: miR-17~92 cluster antisense.
Figure 4.
Figure 4.
(A) Cell cycle analysis of TS-SUP-M2 S3S cells expressing the indicated miRNA 5 days after doxycycline treatment. Cells expressing miR-17~92 cluster displayed reduced G0/G1 arrest and increased S-phase as compared to control cells and cells transduced with the indicated lentiviral particles. Cell cycle was analyzed by propidium iodide staining-flow cytometry. These findings are representative of three independent experiments. (B) Western blot analysis of the experiment described above revealed that cells expressing the miR-17~92 cluster showed increased levels of cyclin A, B1 and D3 following STAT3 KD as compared to control cells. (C) TS-SUP-M2 S3S cells expressing the miR-17~92 cluster undergo reduced apoptosis as compared to control cells. Propidium iodide staining analysis was performed at day 9 after induction with doxycycline. The sub-G0/G1 fraction was used to quantify apoptotic cells. These findings are representative of three independent experiments. (D) Western blot analysis of the experiment descibed above (C) revealed that miR-17~92 over-expressing cells displayed lower levels of activated caspase 3 and caspase 7, processed PARP, BIM and higher levels of IAP1 protein. Asterisk (*) indicates unspecific band for IAP1.
Figure 5.
Figure 5.
Expression of TGFβRII as detected by gene expression profiling at 96 h (left panel), and by RT-qPCR after 8 days of doxycycline treatment (right panel). TS-SUP-M2 S3S cells were transduced with the indicated lentivectors and cultured in the presence (+) or absence (−) of doxycycline (1 μg/mL). Experiments were performed in biological duplicates.

References

    1. Fornari A, Piva R, Chiarle R, Novero D, Inghirami G. Anaplastic large cell lymphoma: one or more entities among T-cell lymphoma¿ Hematol Oncol. 2009;27(4):161–70 - PubMed
    1. Vose J, Armitage J, Weisenburger D. International peripheral T-cell and natural killer/T-cell lymphoma study: pathology findings and clinical outcomes. J Clin Oncol. 2008;26(25):4124–30 - PubMed
    1. Morris SW, Kirstein MN, Valentine MB, Dittmer KG, Shapiro DN, Saltman DL, et al. Fusion of a kinase gene, ALK, to a nucleolar protein gene, NPM, in non-Hodgkin’s lymphoma. Science. 1994;263(5151):1281–4 - PubMed
    1. Chiarle R, Voena C, Ambrogio C, Piva R, Inghirami G. The anaplastic lymphoma kinase in the pathogenesis of cancer. Nat Rev Cancer. 2008;8(1):11–23 - PubMed
    1. Amin HM, Medeiros LJ, Ma Y, Feretzaki M, Das P, Leventaki V, et al. Inhibition of JAK3 induces apoptosis and decreases anaplastic lymphoma kinase activity in anaplastic large cell lymphoma. Oncogene. 2003;22(35):5399–407 - PubMed

Publication types

MeSH terms