. 2013 Nov;41(21):9764-78.
doi: 10.1093/nar/gkt732. Epub 2013 Aug 23.

Elucidating the evolutionary conserved DNA-binding specificities of WRKY transcription factors by molecular dynamics and in vitro binding assays

Affiliations

Elucidating the evolutionary conserved DNA-binding specificities of WRKY transcription factors by molecular dynamics and in vitro binding assays

Luise H Brand et al. Nucleic Acids Res. 2013 Nov.

Abstract

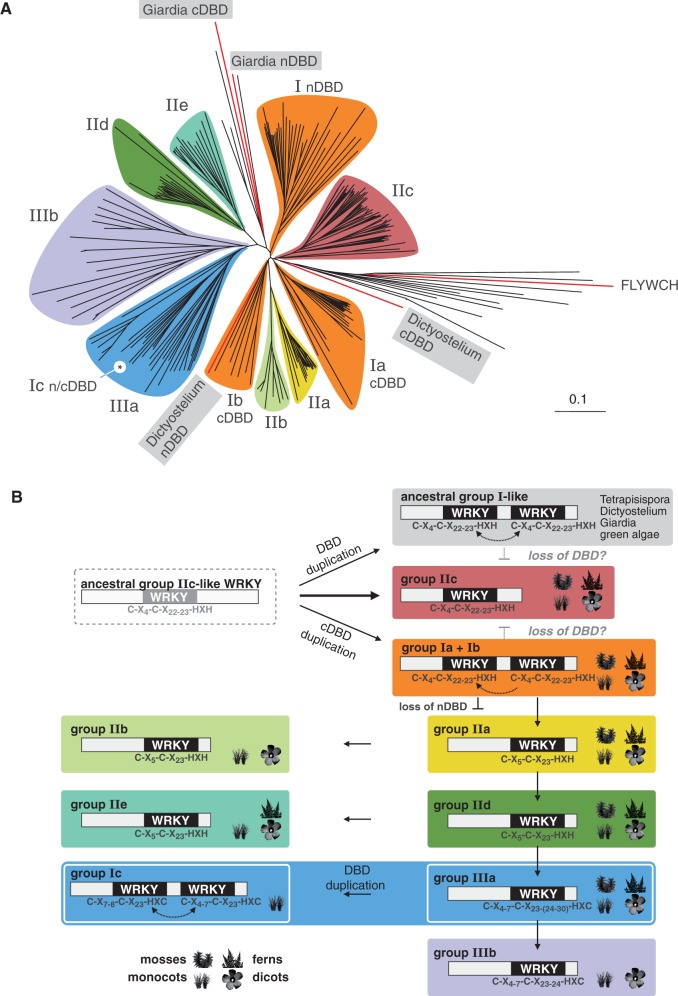
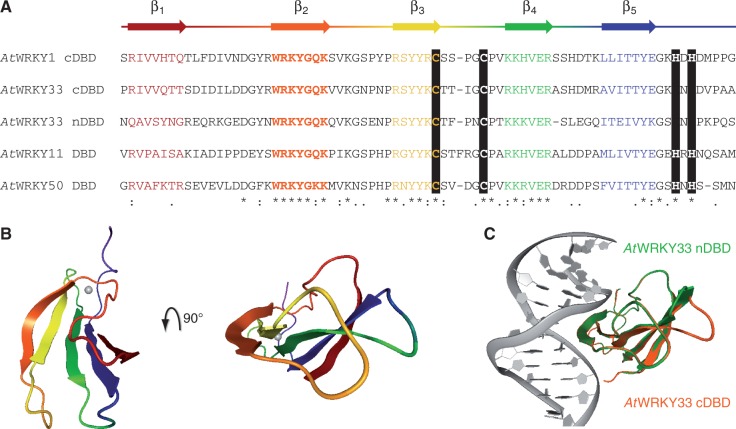
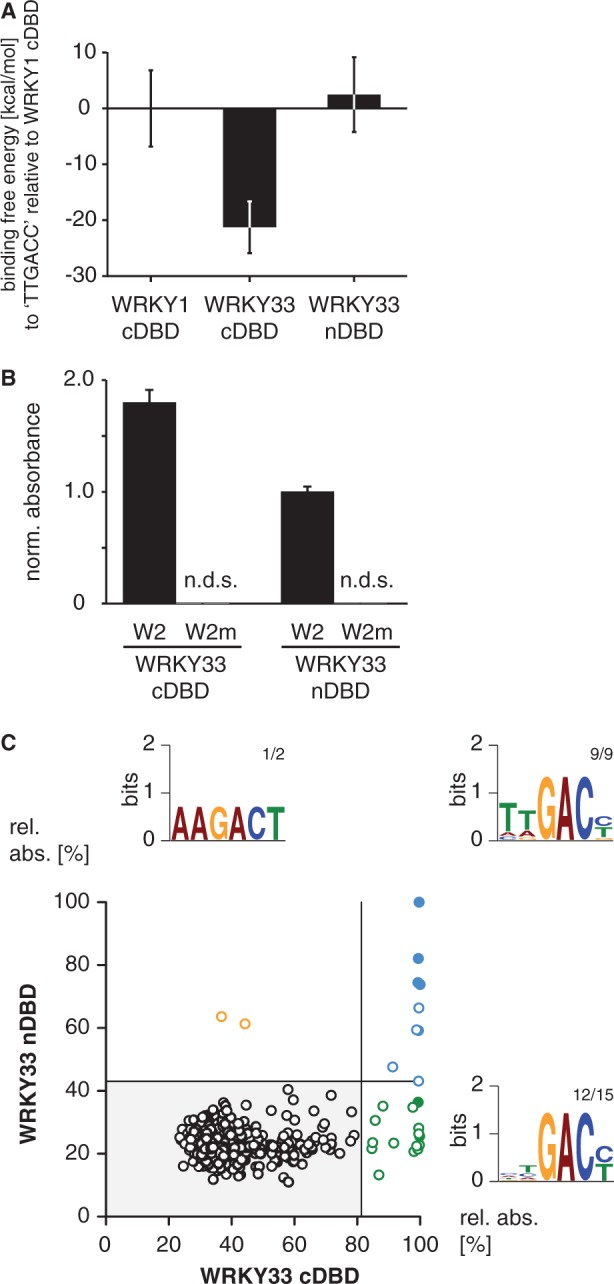
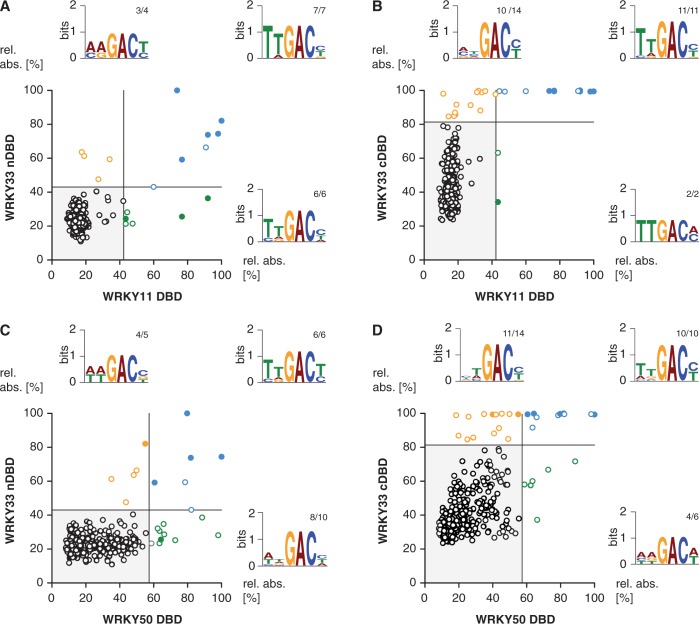
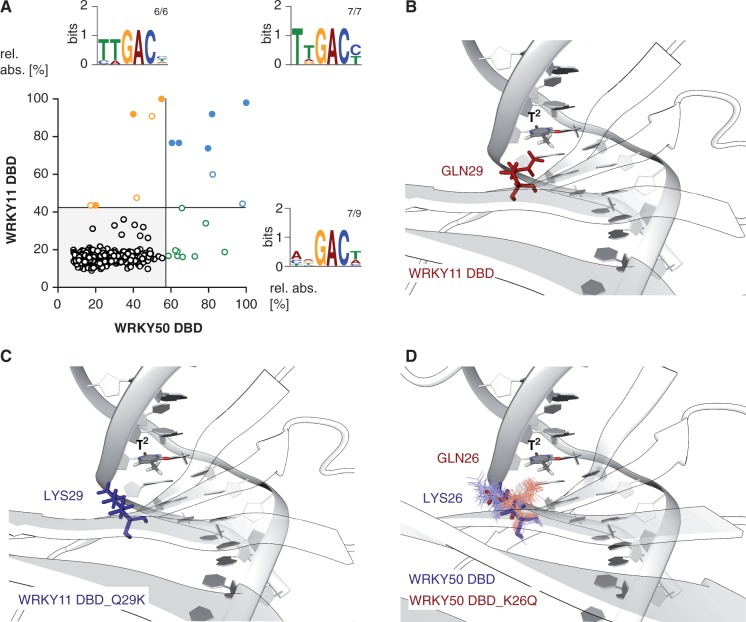
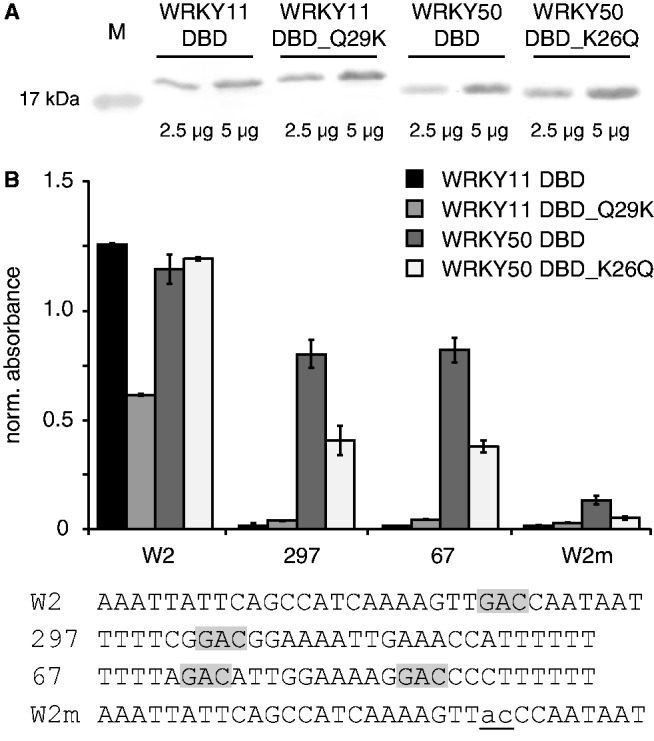
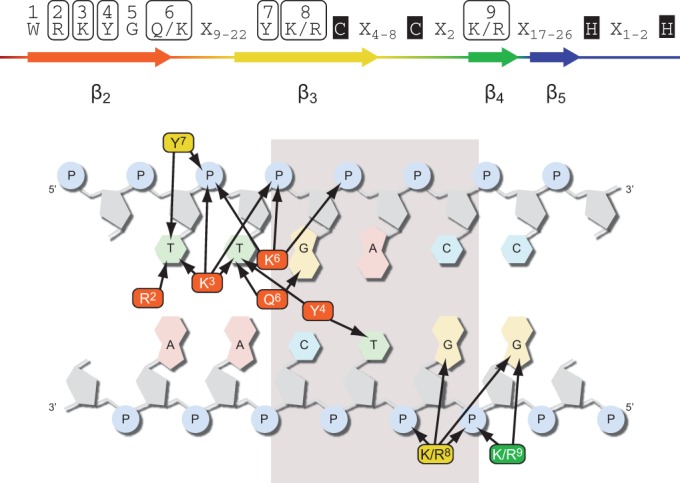
WRKY transcription factors constitute a large protein family in plants that is involved in the regulation of developmental processes and responses to biotic or abiotic stimuli. The question arises how stimulus-specific responses are mediated given that the highly conserved WRKY DNA-binding domain (DBD) exclusively recognizes the 'TTGACY' W-box consensus. We speculated that the W-box consensus might be more degenerate and yet undetected differences in the W-box consensus of WRKYs of different evolutionary descent exist. The phylogenetic analysis of WRKY DBDs suggests that they evolved from an ancestral group IIc-like WRKY early in the eukaryote lineage. A direct descent of group IIc WRKYs supports a monophyletic origin of all other group II and III WRKYs from group I by loss of an N-terminal DBD. Group I WRKYs are of paraphyletic descent and evolved multiple times independently. By homology modeling, molecular dynamics simulations and in vitro DNA-protein interaction-enzyme-linked immunosorbent assay with AtWRKY50 (IIc), AtWRKY33 (I) and AtWRKY11 (IId) DBDs, we revealed differences in DNA-binding specificities. Our data imply that other components are essentially required besides the W-box-specific binding to DNA to facilitate a stimulus-specific WRKY function.


Figures

Figure 1.
Figure 1.
Phylogeny of WRKY DBDs. (A) Unrooted phylogenetic tree of 295 WRKY domain sequences from 16 different species, including all Arabidopsis (AtWRKY) and rice (OsWRKY) members. Basal plant WRKY DBD sequences, e.g. from P. patens and S. moellendorfii, were included to achieve better separation of the different WRKY clades. WRKY groups and subgoups 1–3 are highlighted in different colors. The positions of novel group Ic WRKY proteins and basal group I DBD from G. lamblia and D. discoideum as well as the H. sapiens FLYWCH domain inside the tree are indicated. The tree is drawn to scale, and branch lengths are indicated. A full list of WRKY DBD sequences is provided as Supplementary Table S1. The same data are given as detailed phylogram that shows all labels and names (Supplementary Figure S1). (B) Schematic overview of the evolutionary history of the WRKY DBD. The analysis of ancestral WRKY proteins revealed paraphyletic origin for group I proteins and direct monophyletic descent of group IIc WRKY proteins from an ancestral group IIc-like WRKY domain. Presence of WRKY members in the basal plant species P. patens or S. moellendorfii and in monocot or dicot phyla is indicated by pictographs. Evolutionary relatedness was inferred by the position in the phylogenetic tree, by structural features of the zinc finger and by representative members of the four plant phyla within each of the clades.
Figure 2.
Figure 2.
Homology models of AtWRKY DBDs. (A) The general protein secondary structure based on the crystal structure of WRKY1 C-terminal DNA-binding domain (cDBD; PDB id: 2ayd) is given above the alignment of AtWRKY cDBDs and N-terminal DBD (nDBD). Black bars highlight the conserved zinc finger; other conserved amino acids are indicated: (*) same amino acid, (:) amino acid with similar chemical properties, (.) majority of amino acids with similar chemical properties. (B) The five conserved β-strands of AtWRKY1 cDBD are colored according to A in the structure shown (PDB id: 2ayd). (C) The overlay of the protein-DNA models of AtWRKY33 cDBD (orange) and WRKY33 nDBD (green) is displayed. The protein structures are homology models and superimposed with respect to their β-sheet Cα atoms.
Figure 3.
Figure 3.
Comparison of the DNA-binding specificities of group I AtWRKY33 N-terminal and C-terminal DNA-binding domain. (A) The relative binding free energies (kcal/mol) of AtWRKY33 C-terminal DNA-binding domain (cDBD) and AtWRKY33 N-terminal DNA-binding domain (nDBD) with respect to WRKY1 cDBD to the DNA sequence (5′-AAAGTTGACCAA-3′) were calculated using the MM-PBSA method in Amber 11. (B) Probing of the W2 or W2m DNA with AtWRKY33 cDBD or nDBD by DPI-ELISA reveals binding ability of both protein domains (n.d.s., no detectable signal; absolute error is shown). Each absorbance value was normalized to the mean of the background control. (C) The XY-plots of relative absorbance values of the DPI-ELISA screens of AtWRKY33 cDBD and nDBD are shown. Those double-stranded DNA probes significantly bound by AtWRKY33 cDBD and nDBD are in blue, those only bound by AtWRKY33cDBD are in green and those only bound by AtWRKY33nDBD are in orange. The filled circles indicate probes exhibiting the known ‘TTGACY’ binding motif. Lines indicate the significance threshold (P ≤ 0.05). The sequences of all positively bound probes were used as MEME input for motif identification. Motif consensus was shown as Weblogos; numbers of probes that contain the motif displayed as Weblogo and number of motifs per quartile are indicated as small numbers.
Figure 4.
Figure 4.
Comparison of the DNA-binding specificities of four AtWRKY DBDs. The XY-plots of relative absorbance values of the DPI-ELISA screens of the DBDs of AtWRKY11 DBD versus AtWRKY33 nDBD (A), WRKY50 DBD versus WRKY33 nDBD (B), WRKY33 cDBD versus WRKY11 DBD (C) and WRKY33 cDBD versus WRKY50 DBD are graphed. The dsDNA probes significantly bound by both the x- and y-component are in blue, those only bound by the respective x-component are in green and those only bound by the respective y-component are in orange. The filled circles indicate probes exhibiting the known ‘TTGACY’ binding motif. Lines indicate the significance threshold (P ≤ 0.05). The sequences of all positively bound probes were used as MEME input for motif identification. Motif consensus was shown as Weblogos; numbers of probes that contain the motif displayed as Weblogo and number of motifs per quartile are indicated as small numbers.
Figure 5.
Figure 5.
Comparison of the DNA-binding specificities of the DBDs of AtWRKY50 versus AtWRKY11. (A) The XY-plots of relative absorbance values of the DPI-ELISA screens of the DBDs of WRKY50 DBD and WRKY11 DBD are shown. The dsDNA probes significantly bound by WRKY50 DBD and WRKY11 DBD are in blue, those only bound by WRKY50 DBD are in green and those only bound by WRKY11 DBD are in orange. The filled circles indicate probes exhibiting the known ‘TTGACY’ binding motif. Lines indicate the significance threshold (P ≤ 0.05). The sequences of all positively bound probes were used as MEME input for motif identification. Motif consensus was shown as Weblogos; numbers of probes that contain the motif displayed as Weblogo and number of motifs per quartile are indicated as small numbers. (B and C) The close-up of the protein-DNA model of WRKY11 DBD (B) and WRKY11 DBD_Q29K (C) is shown (GLN29 - Glutamin - red; LYS29 - Lysin - blue). Both protein structures are homology models and superimposed with respect to their β-sheet Cα atoms. (D) The molecular dynamics simulations (10 ns) of WRKY50 DBD (blue) and WRKY50 DBD_K26Q (red) are shown as close-up.
Figure 6.
Figure 6.
Influence of the glutamine/lysine of the β2-strand of the DBDs of AtWRKY50 DBD and AtWRKY11 DBD on the DNA-binding specificities. (A) Crude E. coli protein extracts of WRKY11 DBD, 11_DBDQ29K, 50 DBD and 50 DBD_Q26K were analyzed by western blot analyses to show comparable protein concentrations and appropriate protein sizes. (B) Equal amounts of protein extract [3 µg/well] were used to probe dsDNA probes [2 pmol/well] with different versions of the W-box by quantitative DPI-ELISA. The forward sequences of the dsDNA probes are given below the graph. The invariable GAC-core is shaded in gray. The absorbance values were normalized to the mean of the background controls. The absolute error is shown.
Figure 7.
Figure 7.
Model of the WRKY–DNA-binding interface. The molecular dynamics simulations of WRKY DBDs led to the identification of amino acids in 1–4Å proximity to either the nucleobases or the phosphate backbone of the DNA (arrow). These amino acids are considered to possibly influence WRKY binding to the W-box. The conserved tryptophan (W1) and the zinc finger are important structural determinants for the WRKY–DNA interaction, but are not in proximity to the DNA (Xn–number of amino acids between conserved proximity sites).

References

    1. Kilian J, Peschke F, Berendzen KW, Harter K, Wanke D. Prerequisites, performance and profits of transcriptional profiling the abiotic stress response. Biochim. Biophys. Acta. 2012;1819:166–175. - PubMed
    1. Babu MM, Iyer LM, Balaji S, Aravind L. The natural history of the WRKY-GCM1 zinc fingers and the relationship between transcription factors and transposons. Nucleic Acids Res. 2006;34:6505–6520. - PMC - PubMed
    1. Eulgem T, Rushton PJ, Robatzek S, Somssich IE. The WRKY superfamily of plant transcription factors. Trends Plant Sci. 2000;5:199–206. - PubMed
    1. Pandey SP, Somssich IE. The role of WRKY transcription factors in plant immunity. Plant Physiol. 2009;150:1648–1655. - PMC - PubMed
    1. Ramirez SR, Basu C. Comparative analyses of plant transcription factor databases. Curr. Genomics. 2009;10:10–17. - PMC - PubMed

Publication types

MeSH terms