Review
. 2014 May;137(Pt 5):1282-303.
doi: 10.1093/brain/awt202. Epub 2013 Aug 22.

Genotype-phenotype correlations in neurogenetics: Lesch-Nyhan disease as a model disorder

Affiliations
Review

Genotype-phenotype correlations in neurogenetics: Lesch-Nyhan disease as a model disorder

Rong Fu et al. Brain. 2014 May.

Abstract

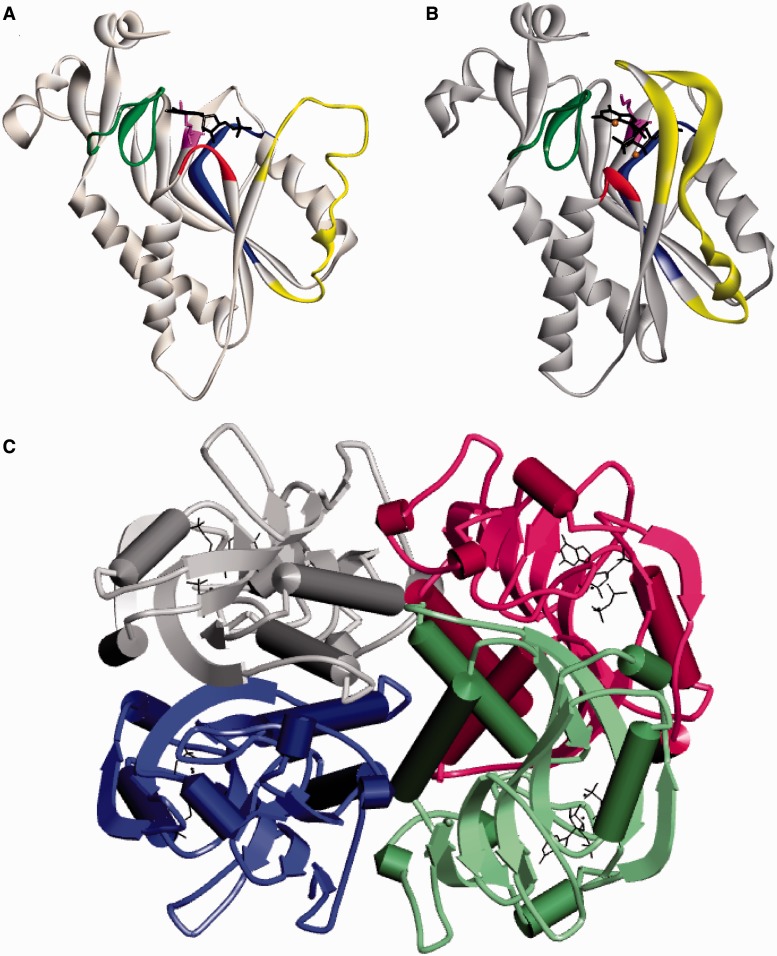
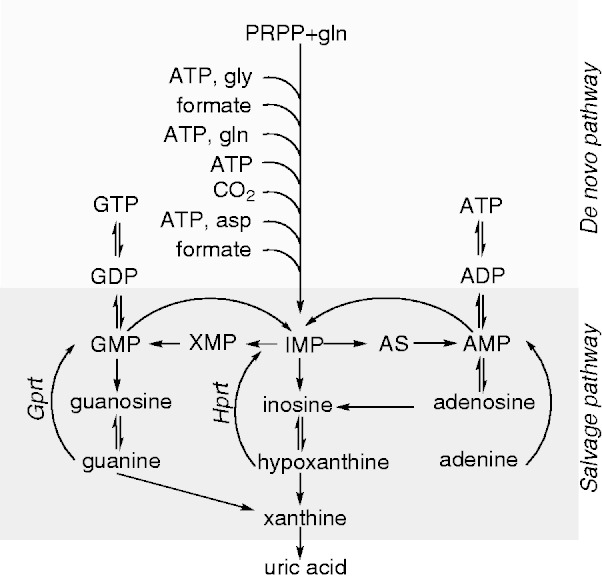
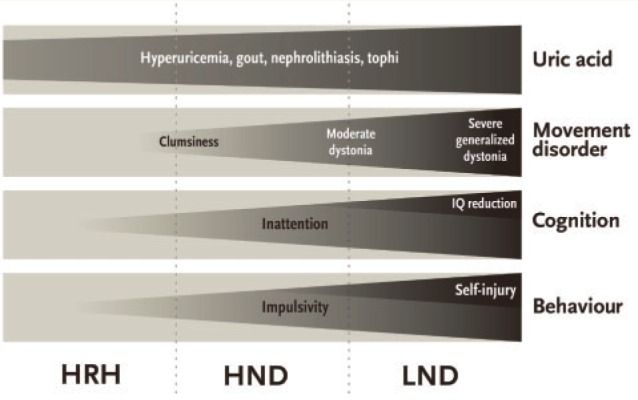
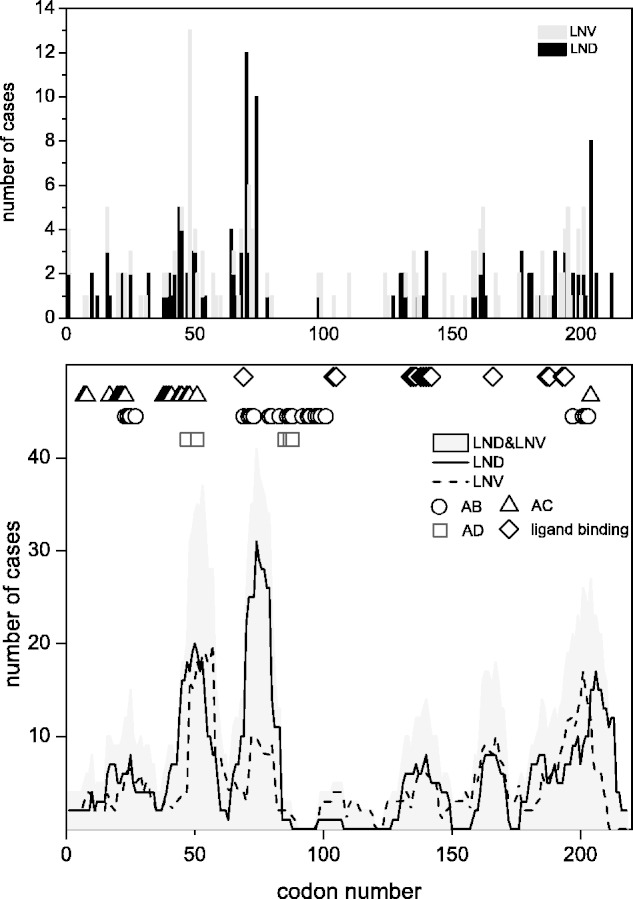
Establishing meaningful relationships between genetic variations and clinical disease is a fundamental goal for all human genetic disorders. However, these genotype-phenotype correlations remain incompletely characterized and sometimes conflicting for many diseases. Lesch-Nyhan disease is an X-linked recessive disorder that is caused by a wide variety of mutations in the HPRT1 gene. The gene encodes hypoxanthine-guanine phosphoribosyl transferase, an enzyme involved in purine metabolism. The fine structure of enzyme has been established by crystallography studies, and its function can be measured with very precise biochemical assays. This rich knowledge of genetic alterations in the gene and their functional effect on its protein product provides a powerful model for exploring factors that influence genotype-phenotype correlations. The present study summarizes 615 known genetic mutations, their influence on the gene product, and their relationship to the clinical phenotype. In general, the results are compatible with the concept that the overall severity of the disease depends on how mutations ultimately influence enzyme activity. However, careful evaluation of exceptions to this concept point to several additional genetic and non-genetic factors that influence genotype-phenotype correlations. These factors are not unique to Lesch-Nyhan disease, and are relevant to most other genetic diseases. The disease therefore serves as a valuable model for understanding the challenges associated with establishing genotype-phenotype correlations for other disorders.

Keywords: Lesch-Nyhan disease; genotype–phenotype correlations; neurogenetics.


Figures

Figure 1
Figure 1
Ribbon diagram for human HGprt. (A) A monomer with guanosine monophosphate in the open loop state (PDB: 1hmp). (B) A monomer with transition-state analogue and PPi in the closed loop state (PDB: 1bzy). (A and B) The PPi loop is shown in red, the PRPP loop is shown in blue, the C-terminal hood domain is shown in green, and the long flexible loop is shown in yellow. K166 is displayed in purple and the ligands are black. (C) The tetrameric structure of HGprt with each of the four subunits in a different colour (A in grey, B in blue, C in red and D in green).
Figure 2
Figure 2
Purine metabolism. AS = adenylosuccinate; asp = aspartic acid; ATP = adenosine triphosphate; GDP = guanosine diphosphate; gln = glutamine; gly = glycine; GMP = guanosine monophosphate; Gprt = guanine phosphoribosyltransferase; GTP = guanosine triphosphate; Hprt = hypoxanthine phosphoribosyltransferase; IMP = inosine monophosphate; XMP = xanthine monophosphate. In this diagram, HGprt is shown separately at its two distinct functional sites (Hprt and Gprt).
Figure 3
Figure 3
Clinical spectrum in Lesch-Nyhan disease and its variants. The four major aspects of the clinical phenotype are shown in grey boxes, with overall severity and frequency depicted by tapering triangles. LND = Lesch-Nyhan disease.
Figure 4
Figure 4
Distribution of cases with missense mutations in the HPRT1 gene. The top panel shows the numbers of cases with missense mutations reported according to codon number. Cases with Lesch-Nyhan disease (LND) are shown as black lines and Lesch-Nyhan variant (LNV) as dark grey lines. The height of each bar reflects the total numbers of independent cases reported for unrelated families. The bottom panel shows the same data as in the top panel, with a line showing a running average of 10 codons at each point. This analysis more readily permits the visualization of five hot clusters of mutations with peaks of at least 10 cases. These hot clusters show similar distributions for Lesch-Nyhan disease (solid line) and Lesch-Nyhan variant (dashed line). The total cases combined are shaded in light grey. The different symbols above the graph depict the subunit interfaces (circles for A–B; triangles for A–C; squares for A–D) and the ligand binding sites (diamonds). Cases contributing to this figure are listed individually at www.lesch-nyhan.org.
Figure 5
Figure 5
Correlations between residual enzyme activity and clinical severity in patient cells. Panel A is a box-whisker plot showing residual activities for Hprt as measured by the intact fibroblast assay for 56 patients previously reported (Itiaba et al., 1978; Bakay et al., 1979; Gottlieb et al., 1982; Warzok et al., 1982; Fattal et al., 1984; Lorentz et al., 1984; Mitchell and McInnes, 1984; Hersh et al., 1986; Tarle et al., 1991; Gilbert et al., 1992; Sege-Peterson et al., 1992; Jenkins et al., 1994; Erhard et al., 1997; Puig et al., 2001; Zoref-Shani et al., 2003, 2004; Cherian and Crompton, 2005; Cossu et al., 2006; Jinnah et al., 2010; Sarafoglou et al., 2010; Torres et al., 2010). Panel B is a box-whisker plot showing residual activities for Hprt as measured by the intact erythrocyte assay for 54 patients previously reported (Shnier et al., 1972; Ludman et al., 1992; Sege-Peterson et al., 1992; Davidson et al., 1994; Willers et al., 1999; Puig et al., 2001; Augoustides-Savvopoulou et al., 2002; Bertelli et al., 2004; Kassimatis et al., 2005; Cossu et al., 2006; Garcia et al., 2008; de Gemmis et al., 2010; Corrigan et al., 2011). Corresponding values for Gprt activity were not available. In these plots, the whiskers show the whole data range, while the boxes show the 25th and 75th percentiles of the data. The horizontal line depicts the median. These data must be interpreted with caution, because they were collected from published reports from different laboratories, each with different methods for the assay and different strategies for normalization of the results.
Figure 6
Figure 6
Correlations between residual enzyme activity and clinical severity using purified engineered mutant proteins in vitro. The two different functions of HGprt are shown separately as Hprt and Gprt. The panels show box-whisker plots for residual Hprt activity with a fixed high concentration of hypoxanthine (A) and a fixed high concentration of PRPP (C), residual Gprt activity with a fixed high concentration of guanine (B) and a fixed high concentration of PRPP (D) as previously described (Fu and Jinnah, 2012). In these plots, the whiskers show the whole data range, while the boxes show the 25th and 75th percentiles of the data. The horizontal line depicts the median.

References

    1. Adzhubei IA, Schmidt S, Peshkin L, Ramensky VE, Gerasimova A, Bork P, et al. A method and server for predicting damaging missense mutations. Nat Methods. 2010;7:248–9. - PMC - PubMed
    1. Anderson LT, Ernst M. Self-injury in Lesch-Nyhan disease. J Autism Dev Disord. 1994;24:67–81. - PubMed
    1. Anderson LT, Ernst M, Davis SV. Cognitive abilities of patients with Lesch-Nyhan disease. J Autism Dev Disord. 1992;22:189–203. - PubMed
    1. Aral B, de Saint B, Al-Garawi S, Kamoun P, Ceballos-Picot I. Novel nonsense mutation in the hypoxanthine guanine phosphoribosyltransferase gene and nonrandom X-inactivation causing Lesch-Nyhan syndrome in a female patient. Hum Mutat. 1996;7:52–8. - PubMed
    1. Augoustides-Savvopoulou P, Papachristou F, Fairbanks LD, Dimitrakopoulos K, Marinaki AM, Simmonds HA. Partial hypoxanthine-guanine phosphoribosyltransferase deficiency as the unsuspected cause of renal disease spanning three generations: a cautionary tale. Pediatr. 2002;109:E17. - PubMed

Publication types

MeSH terms

Substances