. 2014 Jan 1;23(1):182-93.
doi: 10.1093/hmg/ddt410. Epub 2013 Aug 23.

Modulation of lipid metabolic defects rescues cleft palate in Tgfbr2 mutant mice

Affiliations

Modulation of lipid metabolic defects rescues cleft palate in Tgfbr2 mutant mice

Junichi Iwata et al. Hum Mol Genet. .

Abstract

Mutations in transforming growth factor beta (TGFβ) receptor type II (TGFBR2) cause Loeys-Dietz syndrome, characterized by craniofacial and cardiovascular abnormalities. Mice with a deletion of Tgfbr2 in cranial neural crest cells (Tgfbr2(fl/fl);Wnt1-Cre mice) develop cleft palate as the result of abnormal TGFβ signaling activation. However, little is known about metabolic processes downstream of TGFβ signaling during palatogenesis. Here, we show that Tgfbr2 mutant palatal mesenchymal cells spontaneously accumulate lipid droplets, resulting from reduced lipolysis activity. Tgfbr2 mutant palatal mesenchymal cells failed to respond to the cell proliferation stimulator sonic hedgehog, derived from the palatal epithelium. Treatment with p38 mitogen-activated protein kinase (MAPK) inhibitor or telmisartan, a modulator of p38 MAPK activation and lipid metabolism, blocked abnormal TGFβ-mediated p38 MAPK activation, restoring lipid metabolism and cell proliferation activity both in vitro and in vivo. Our results highlight the influence of alternative TGFβ signaling on lipid metabolic activities, as well as how lipid metabolic defects can affect cell proliferation and adversely impact palatogenesis. This discovery has broader implications for the understanding of metabolic defects and potential prevention of congenital birth defects.


Figures
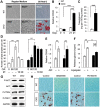
Figure 1.
Figure 1.
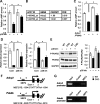
Spontaneous accumulation of lipid droplets in Tgfbr2 mutant cells resulting from a defect in lipolysis. (A) Primary MEPM cells from Tgfbr2fl/fl (WT) and Tgfbr2fl/fl;Wnt1-Cre (CKO) mice cultured in regular medium for 0 or 21 days. Lipid droplets were stained with Oil Red O. Bar, 50 μm. (B) Quantitative analysis of lipid accumulation by Oil Red O staining in WT (white bar) and CKO (black bar) MEPM cells. Data are OD490 measurements. ***P<0.001. (C) Triacylglycerol level in WT and CKO MEPM cells cultured for 21 days. Data are expressed as mg per 100 mg protein. ***P < 0.001. (D) Pulse-chase analysis of lipid droplet formation using chemical inducers, oleic acid (OA) for lipogenesis (after 0, 60 and 120 min) and isoproterenol (IP) for lipolysis (after 10 and 30 min), in MEPM cells of WT and CKO mice. **P < 0.01. (E) Quantitative analysis of adipogenesis by Oil Red O staining in WT and CKO MEPM cells after 1 week of culture in adipogenic induction (+) or regular medium (−). Data are relative OD490 measurements. **P < 0.01. (F) Quantitative analysis of glycerol released into the medium by isoproterenol stimulation (+) or mock treatment (−) in MEPM-derived adipocytes of WT and CKO mice. *P < 0.05; **P < 0.01; NS, not significant. (G) Immunoblotting analysis of indicated molecules related to AKT signaling in MEPM cells from WT and CKO mice. (H) Oil Red O staining of MEPM cells from WT and CKO mice treated without (control) or with p38 MAPK inhibitor SB203580 or PD169316 for 3 weeks. Bars, 20 μm.
Figure 2.
Figure 2.
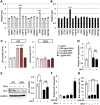
Identification of target molecules regulating lipid metabolism in Tgfbr2 mutant cells. (A) Quantitation of cAMP levels in the MEPM cells of Tgfbr2fl/fl (WT, white bars) and Tgfbr2fl/fl;Wnt1-Cre (CKO, black bars) mice. *P < 0.05. (B) Summary of microarray analysis results from MEPM cells of WT and CKO mice. Forty-seven gene transcripts were down-regulated in Tgfbr2fl/fl;Wnt1-Cre MEPM cells compared with Tgfbr2fl/fl MEPM cells. Forty-four gene transcripts were up-regulated in CKO MEPM cells compared with WT MEPM cells. n = 4 per genotype. Altered gene expression of 5′-cyclic monophosphate (cAMP) regulators is listed. (C) Measurement of cAMP in the MEPM cells of WT and CKO mice after Adcy2 overexpression and Pde4b siRNA knock-down (+) or control treatment (−). *P < 0.05. (D) Quantitative reverse transcription polymerase chain reaction (RT–PCR) analyses of Adcy2 and Pde4b in WT and CKO MEPM cells after treatment with p38 MAPK inhibitor SB203580 (p38 inh.) or no drug control (Cont.). *P < 0.05. (E) Immunoblotting analysis of indicated molecules related to PKA signaling in MEPM cells from WT and CKO mice treated with (+) or without (−) p38 inhibitor. Bar graphs (right) show the ratios of phosphorylated PKAR2 to PKAR2 following quantitative densitometry analysis of immunoblotting data. *P < 0.05. (F) Schematic diagram of mouse Adcy2 and Pde4b promoter regions showing putative MEF2 response elements (REs) identified by genomatix software within the Adcy2 and Pde4b genes. Arrowheads indicate the position of primers used in ChIP analysis. (G) ChIP analysis to detect MEF2 binding of the Adcy2 and Pde4b promoter in MEPM cells. PCR was performed using primers indicated in Materials and Methods.
Figure 3.
Figure 3.
SHH response is impaired in Tgfbr2 mutant cells. (A and B) Cell proliferation assays in Tgfbr2fl/fl littermate (white bars, A) and Tgfbr2fl/fl;Wnt1-Cre (black bars, B) mice after 24 h of culturing with indicated molecules. ***P < 0.001. (C) Cell proliferation assays of MEPM cells from WT and CKO mice after 24 h of culturing with various concentrations of SHH protein (0, 0.1, 0.5 and 1.0 μg/ml). ***P < 0.001. (D) Quantitative RT–PCR analyses of Gli1 with (+) or without (−) SHH treatment in WT and CKO MEPM cells. *P < 0.05. NS, not significant. (E) Immunoblotting analysis of GLI1 expression with (+) or without (−) SHH in MEPM cells of WT and CKO mice. Bar graph (right) shows the ratio of GLI1 to GAPDH following quantitative densitometry analysis of immunoblotting data. *P < 0.05. NS, not significant. (F) Quantitative RT–PCR analyses of Gli1 with (+) or without (−) p38 MAPK inhibitor and/or SHH treatment in WT and CKO MEPM cells. *P < 0.05. (G) BrdU incorporation assay after treatment of MEPM cells from WT and CKO mice with (+) or without (−) p38 MAPK inhibitor and/or SHH. Bar graph shows the percentage of BrdU-positive cells. ***P < 0.001.
Figure 4.
Figure 4.
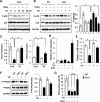
Telmisartan restores p38 MAPK activation and cell proliferation activity in Tgfbr2 mutant cells. (A) Immunoblotting analysis of indicated molecules after treatment with telmisartan at indicated concentrations and addition (+) or no addition (−) of TGFβ in MEPM cells from Tgfbr2fl/fl;Wnt1-Cre (CKO) mice. (B) Immunoblotting analysis of indicated molecules in MEPM cells from Tgfbr2fl/fl (WT) and Tgfbr2fl/fl;Wnt1-Cre (CKO) mice after treatment with (+) or without (−) TGFβ and/or telmisartan. Bar graph (right) shows the ratios of phosphorylated p38 to p38 following quantitative densitometry analysis of immunoblotting data. White bars, WT; black bars, CKO. (C) Quantitative RT–PCR analyses of Adcy2 and Pde4b in WT and CKO MEPM cells with (Tel.) or without (Cont.) telmisartan treatment. *P < 0.05. (D) Quantitative RT–PCR analyses of Gli1 in WT and CKO MEPM cells with (+) or without (−) telmisartan treatment. *P < 0.05. (E) Quantitation of cAMP levels in the MEPM cells of WT and CKO mice after telmisartan treatment (+) or no treatment (−). *P < 0.05. (F) Immunoblotting analysis of indicated molecules after treatment with (+) or without (−) telmisartan in MEPM cells from WT and CKO mice. Bar graph (right) shows the ratios of phosphorylated PKAR2 to PKAR2 following quantitative densitometry analysis of immunoblotting data. (G) BrdU incorporation assay after treatment with (+) or without (−) telmisartan and/or SHH in MEPM cells from WT and CKO mice. Bar graph shows the percentage of BrdU-positive cells. ***P < 0.001.
Figure 5.
Figure 5.
SHH response is normalized in Tgfbr2 mutant palates after treatment with p38 MAPK inhibitor or telmisartan. (A) Schematic diagram of sample preparation and assay. Palatal explants with the palatal epithelium removed were cultured with BSA or SHH-containing beads for 24 h. BrdU staining was performed to measure cell proliferation activity. (B) H&E (left) and BrdU (right) staining of Tgfbr2fl/fl;Wnt1-Cre palatal explants 24 h after epithelium removal and implantation of SHH-containing beads. B, bead. Bars, 200 μm. (C) Quantification of BrdU-positive cells in bead implantation samples. White bars, WT; black bars, CKO. NS, not significant. Five samples per group were used. *P < 0.05. (D) Quantitation of the percentage of BrdU-labeled nuclei in the palates of WT and CKO mice treated with p38 MAPK inhibitor and SHH (+) or BSA control (−) beads for 24 h. *P < 0.05. (E) Quantitation of the percentage of BrdU-labeled nuclei in the palates of WT and CKO mice treated with telmisartan and SHH (+) or BSA control (−) beads for 24 h. *P < 0.05. (F) Immunoblotting analysis of SHH in the palates of WT and CKO mice at E14.5. Bar graph (below) shows the ratio of SHH to GAPDH following quantitative densitometry analysis of immunoblotting data.
Figure 6.
Figure 6.
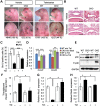
Prevention of cleft palate in Tgfbr2 mutant embryos by telmisartan. (A) Lateral, frontal and palatal views of Tgfbr2fl/fl littermate (WT) and Tgfbr2fl/fl;Wnt1-Cre (CKO) mice after treatment with vehicle or telmisartan. Arrows indicate the edge of the palate. Open arrowheads show defects in the frontal bone. Appearance of the palate was scored as normal or cleft (below). (B) Histological observation of WT and CKO mice after treatment with vehicle or telmisartan. Lower panels show higher magnification of upper panels. Bars, 500 μm (upper panels) and 200 μm (lower panels). (C) Quantification of BrdU-positive cells in E14.5 palate of Tgfbr2fl/fl (WT) and Tgfbr2fl/fl;Wnt1-Cre (CKO) mice with or without telmisartan treatment. White bars, WT; black bars, CKO. Three samples per group were used. ***P < 0.001. (D) Quantitative RT–PCR analyses of Ccnd1 and Ccnd3 in WT and CKO MEPM cells with (w) or without (w/o) telmisartan (Tel) treatment. **P < 0.01, ***P < 0.001. (E) Immunoblotting analysis of p38 and phosphorylated p38 (P-p38) in WT and CKO mice after treatment with vehicle (−) or telmisartan (+). (F) Triacylglycerol level in E18.5 WT (white bars) and CKO (black bars) mice after treatment with telmisartan (+) or vehicle (−). *P < 0.05. (G and H) Quantitative RT–PCR analyses of Adcy2 (E) and Pde4b (F) in E14.5 WT and CKO palates. *P < 0.05.

Similar articles

Cited by

References

    1. Mossey P.A., Little J., Munger R.G., Dixon M.J., Shaw W.C. Cleft lip and palate. Lancet. 2009;374:1773–1785. doi:10.1016/S0140-6736(09)60695-4. - DOI - PubMed
    1. Hrubec T.C., Prater M.R., Toops K.A., Holladay S.D. Reduction in diabetes-induced craniofacial defects by maternal immune stimulation. Birth Defects Res. B Dev. Reprod. Toxicol. 2006;77:1–9. doi:10.1002/bdrb.20062. - DOI - PMC - PubMed
    1. Al Ghafli M.H., Padmanabhan R., Kataya H.H., Berg B. Effects of alpha-lipoic acid supplementation on maternal diabetes-induced growth retardation and congenital anomalies in rat fetuses. Mol. Cell. Biochem. 2004;261:123–135. doi:10.1023/B:MCBI.0000028747.92084.42. - DOI - PubMed
    1. Moore L.L., Singer M.R., Bradlee M.L., Rothman K.J., Milunsky A. A prospective study of the risk of congenital defects associated with maternal obesity and diabetes mellitus. Epidemiology. 2000;11:689–694. doi:10.1097/00001648-200011000-00013. - DOI - PubMed
    1. Ewart-Toland A., Yankowitz J., Winder A., Imagire R., Cox V.A., Aylsworth A.S., Golabi M. Oculoauriculovertebral abnormalities in children of diabetic mothers. Am. J. Med. Genet. 2000;90:303–309. doi:10.1002/(SICI)1096-8628(20000214)90:4<303::AID-AJMG8>3.0.CO;2-Q. - DOI - PubMed

Publication types

MeSH terms

Substances