. 2014 Jan 1;23(1):194-208.
doi: 10.1093/hmg/ddt411. Epub 2013 Aug 23.

A model for the molecular underpinnings of tooth defects in Axenfeld-Rieger syndrome

Affiliations

A model for the molecular underpinnings of tooth defects in Axenfeld-Rieger syndrome

Xiao Li et al. Hum Mol Genet. .

Abstract

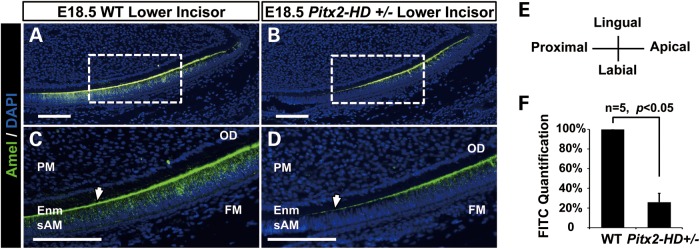
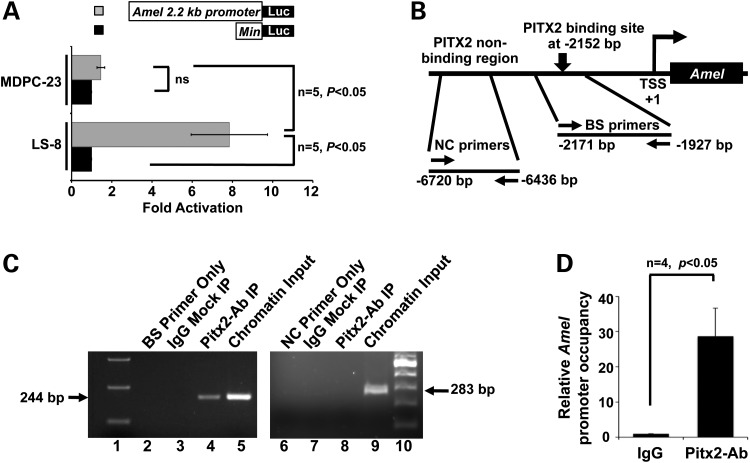
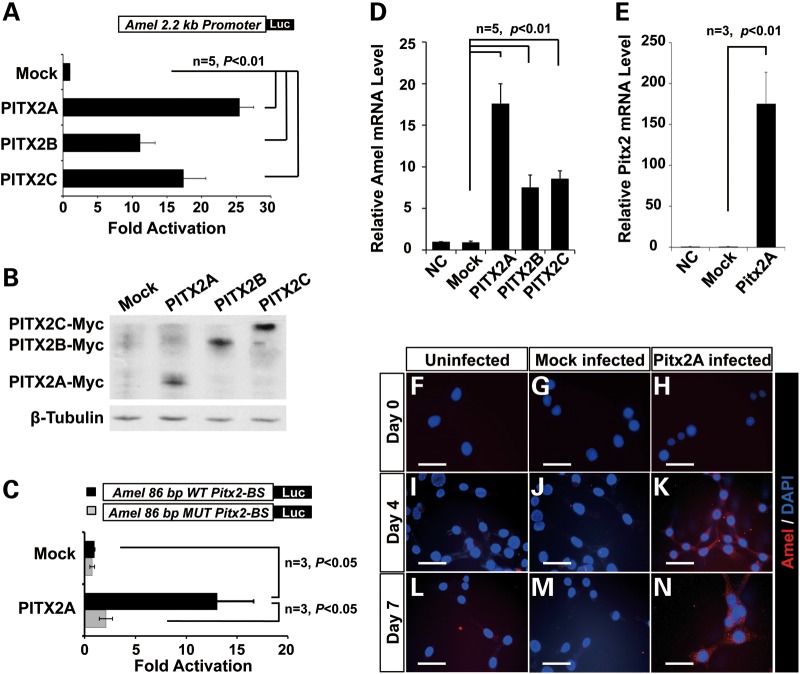
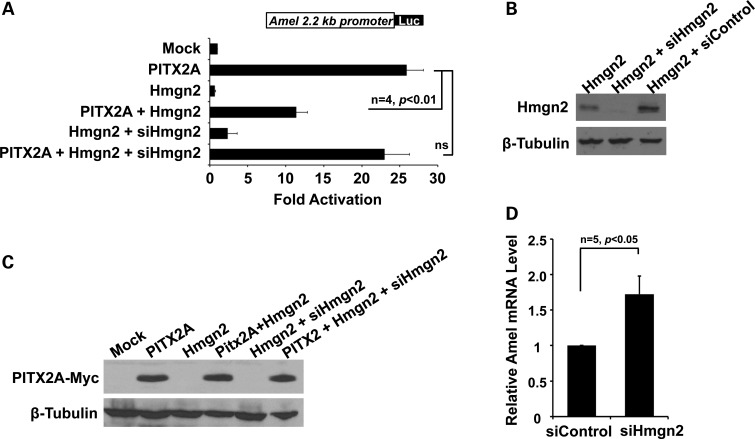
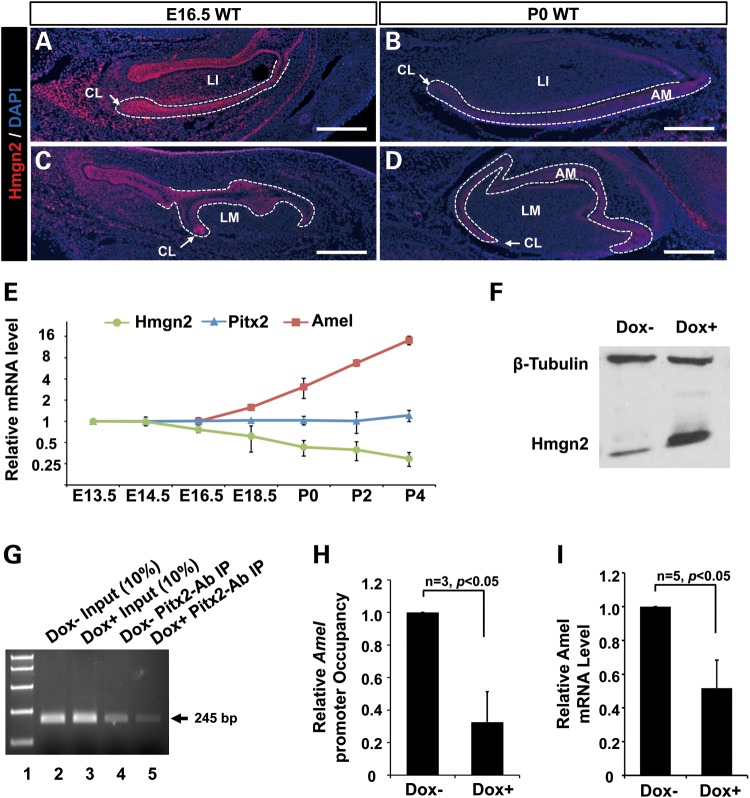
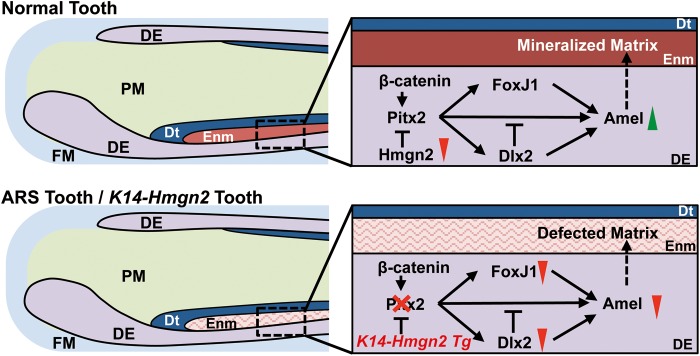
Patients with Axenfeld-Rieger Syndrome (ARS) present various dental abnormalities, including hypodontia, and enamel hypoplasia. ARS is genetically associated with mutations in the PITX2 gene, which encodes one of the earliest transcription factors to initiate tooth development. Thus, Pitx2 has long been considered as an upstream regulator of the transcriptional hierarchy in early tooth development. However, because Pitx2 is also a major regulator of later stages of tooth development, especially during amelogenesis, it is unclear how mutant forms cause ARS dental anomalies. In this report, we outline the transcriptional mechanism that is defective in ARS. We demonstrate that during normal tooth development Pitx2 activates Amelogenin (Amel) expression, whose product is required for enamel formation, and that this regulation is perturbed by missense PITX2 mutations found in ARS patients. We further show that Pitx2-mediated Amel activation is controlled by chromatin-associated factor Hmgn2, and that Hmgn2 prevents Pitx2 from efficiently binding to and activating the Amel promoter. Consistent with a physiological significance to this interaction, we show that K14-Hmgn2 transgenic mice display a severe loss of Amel expression on the labial side of the lower incisors, as well as enamel hypoplasia-consistent with the human ARS phenotype. Collectively, these findings define transcriptional mechanisms involved in normal tooth development and shed light on the molecular underpinnings of the enamel defect observed in ARS patients who carry PITX2 mutations. Moreover, our findings validate the etiology of the enamel defect in a novel mouse model of ARS.


Figures

Figure 1.
Figure 1.
Pitx2 HD+/− mice exhibit delayed Amel expression. Series of sagittal sections of lower incisors from E18.5 wild-type and Pitx2 HD+/− littermate embryos were examined by immunofluorescence staining. Sections were stained for Amel protein, using a Alexa-488 labeled antibody. Selected wild-type (A) and Pitx2 HD+/− (B) sections are shown. (C) and (D) are magnified views of the boxed regions in (A) and (B), respectively. In all sections, 4′,6-diamidino-2-phenylindole (DAPI) staining was used to identify nuclei. Arrowheads indicate sites of decreased Amel expression in the secretory ameloblast region of the mutant mice compared with wild type. FM, follicle mesenchyme; sAM, secretory ameloblast; PM, papilla mesenchyme; Enm, enamel. Scale bars represent 100 μm. (E) The histological orientation of all developmental tooth sections. (F) Quantification of Alexa-488 signal (FITC channel) in a series of stained sections, indicating that Amel expression in Pitx2 HD+/− at E18.5 is reduced.
Figure 2.
Figure 2.
Pitx2 binds to the distal promoter of Amel. (A) Induction of a luciferase reporter of Amel 2.2 kb promoter activity. Luciferase was induced about 8-fold over endogenous levels in the LS-8 cells, but was not significantly induced in MDPC-23 cells. Structures of Amel and control reporter constructs are illustrated schematically above the plot. (B) Schematic of the Amel 2.2 kb promoter, with a predicted PITX2 binding motif indicated by the vertical arrow. Primers were designed to flank the predicted PITX2 binding site (−2171 to −1927bp; BS primers) and an upstream region that lacks a PITX2 site (−6720 to −6436 bp; NC primers). (C) PCR products from ChIP assays involving immunoprecipitation of endogenous Pitx2 in LS-8 cells. PCR products were resolved in agarose gels. Lanes 1 and 10 contain markers. PCRs for lanes 2–5 contain DNA generated using BS primers; lane 2, PCR using no template; lane 3, PCR using normal rabbit IgG-precipitated chromatin as template; lane 4, PCR using Pitx2 antibody-immunoprecipitated chromatin as template and lane 5, PCR using chromatin as input. PCR reactions represented in lanes 6–9 were performed as for the samples in lanes 2–5, but using the NC control primers instead of the BS primers. (D) Quantitation of real-time PCR performed using the ChIP conditions described in (C). The occupancy of the Amel promoter region is shown as enrichment of Pitx2 binding to chromatin in the Pitx2 antibody-immunoprecipitated DNA compared to binding to the IgG immunoprecipitated DNA.
Figure 3.
Figure 3.
PITX2 activates Amel expression. (A) Luciferase reporter activity in LS-8 cells co-transfected with PITX2A/B/C expression plasmids and Amel reporter. Transactivation is shown as the mean fold activation compared with activation in the presence of empty expression plasmid (Mock). (B) Whole-cell lysates from (A) were resolved on 10% polyacrylamide gel. Overexpressed PITX2 protein isoforms were detected using antibody against the Myc tag. β-Tubulin is shown as loading control. (C) Activation of luciferase reporter whose expression is driven by a duplicated 86 bp DNA segment derived from the Amel promoter region, encompasses the Pitx2 binding site (see Fig. 2). This construct was transfected into LS-8 cells with or without PITX2A expression plasmid. In parallel, a reporter with a mutated PITX2 binding site (MUT Pitx2-BS) was transfected as control. (D) Amel mRNA isolated from LS-8 cells transiently transfected with PITX2A after 24h of culture in DMEM with 10% fetal bovine serum. Real-time PCR was performed to assess endogenous Amel expression. mRNA levels of PITX2A-overexpressing and mock-transfected cells were normalized to the levels in non-transfected cells, denoted as NC. (E) PITX2 expression in an LS-8 cell line stably transfected with PITX2A. The line was established and cultured in osteogenic medium, and mRNA from cells cultured for 7 days was subjected to real-time PCR, revealing that PITX2 expression was elevated. Non-treated control and empty viral vector control are denoted as NC and Mock, respectively. (FN) Amel protein in LS-8 cells stably transfected with PITX2A and cultured in osteogenic medium for 0 (F, G and H), 4 (I, J and K) or 7 (L, M and N) days, as assessed by immunofluorescence. DAPI staining was used to identify nuclei. Alexa-555 (red) labels Amel protein in the cytoplasm (K and N). Scale bars represent 50 μm.
Figure 4.
Figure 4.
PITX2 ARS mutants reduce activation of the Amel promoter. (A) Schematic illustration of the locations of five ARS missense mutations. Note that the P64L, T68P and R90P amino-acid substitutions are located in the homeodomain. H, homeobox; OAR, otp, aristaless, and rax-homology domain. (B) Levels of PITX2 proteins in LS-8 cells transfected with the ARS mutations. Whole-cell lysates were resolved on a 10% polyacrylamide gel, and PITX2 mutant protein was detected using an antibody against the Myc tag. β-tubulin served as the loading control. (C) Expression of endogenous Amel in PTIX2-transfected LS-8 cells. Real-time PCR revealed that compared to wild type PITX2A, all five ARS mutant forms were impaired in their ability to activate Amel. (D) Activation of the Amel promoter by the ARS PITX2 mutants. The luciferase assay confirmed that the ability of the ARS PITX2 mutant proteins to activate the Amel promoter was impaired. Luciferase activity is shown as mean-fold activation compared to activity in the context of the empty expression plasmid (Mock). All luciferase activities were normalized to β-galactose expression.
Figure 5.
Figure 5.
PITX2 co-factors modulate Amel promoter activation. (A) Expression plasmids containing the PITX2A, β-catenin, Lef-1, Dlx2 and FoxJ1 cDNAs were co-transfected into LS-8 cells with a luciferase reporter plasmid whose expression is driven by the Amel promoter. Luciferase activity is shown as mean-fold activation compared with that in the presence of empty mock expression plasmid. All luciferase activities were normalized to β-galactose expression. (B, C) Luciferase assay showing that ARS PITX2 mutations are impaired in their abilities to activate (B) the Dlx2 and (C) FoxJ1 promoters. (D) Luciferase reporter activity in the presence of FoxJ1. The transcriptional activity of PITX2 C-terminal mutants (L105V and N108T) is rescued by co-expression of FoxJ1. All luciferase activation values are shown as mean-fold activation compared with the empty mock expression plasmid. All luciferase activities were normalized to β-galactose expression. (EK) Empty vector, wild type PITX2A and five ARS mutant PITX2A forms were transfected into LS-8 cells, which were fixed and subjected to immunocytochemical staining for Myc-tagged mutant PITX2. Cellular localization of ectopic PITX2A is indicated by Alexa-488 (Green). All cells were stained with DAPI to identify the nuclei. Scale bar represents 50 μm.
Figure 6.
Figure 6.
Hmgn2 represses PITX2A transactivation of the Amel promoter. (A) Reversible repression of the Amel promoter in the context of Hmgn2. LS-8 cells were co-transfected with Hmgn2 and PITX2A. The resulting repression of Amel luciferase reported activity was reversed by expressing an shRNA specific for Hmgn2 (siHmgn2). Reporter activation values are shown as mean fold activation compared to that obtained by co-expression with the empty expression plasmid. All luciferase activities were normalized to β-galactose expression. (B) Efficiency of shRNA-mediated silencing of ectopic Hmgn2 in LS-8 cells. A non-targeting shRNA (siControl) was tested in parallel, as a negative control. β-tubulin is serves as a loading control. (C) Expression of Pitx2A-myc in whole-cell lysates from (A). Proteins were resolved on a 14% polyacrylamide gel, and overexpressed PITX2A was detected using an antibody against the Myc tag. β-tubulin served as a loading control. (D) Quanitation of Amel expression in LS-8 cells transfected with Hmgn2 shRNA plasmids. Endogenous Amel expression is 2-fold higher than in LS-8 cells transfected with the control shRNA.
Figure 7.
Figure 7.
Hmgn2 inhibits Pitx2 binding to the Amel promoter. Expression of Hmgn2 protein in E16.5 and P0 wild type lower incisors and molars were examined by immunofluorescence staining. Hmgn2 protein levels were assessed using an Alexa-555 (Red)-labeled antibody. (A–D) Hmgn2 staining on sections from (A) E16.5 wild type lower incisor, (B) P0 wild type lower incisor, (C) E16.5 wild type lower molars and (D) P0 wild type lower molar. White dotted lines outlined dental epithelia. LI, lower incisor; LM, lower molar; AM, ameloblast; CL, cervical loop; Scale bar represents 250 μm. (E) Levels of Hmgn2, Pitx2 and Amel transcripts as evaluated by real-time PCR, at various embryonic and neonatal time points. In the cases of the Pitx2 and Hmgn2 genes, mRNA levels were normalized to those at E13.5; in the case of Amel, mRNA levels were normalized to those at E16.5 because expression was undetectable prior to this time point. Amel levels increase dramatically after E16.5, and the fold changes were scaled down by 102 to fit the figure. (F) Hmgn2 protein levels in the LS-8 cell line following lentivirus-mediated Dox−inducible overexpression. Hmgn2 was detected using an Hmgn2 antibody, and β-tubulin served as a loading control. (G) ChIP assays performed on non-Dox induced (Dox−) and Dox induced (Dox+) cells, using the Amel promoter BS primer sets, as described in Figure 2. Lane 1 contains markers. Lanes 2 and 3 contain 10% of the amplified PCR product from input chromatin of Dox− or Dox+ cells. Lanes 4 and 5 contain amplified products from DNA fragments immunoprecipitated with an antibody against Pitx2, from Dox+ and Dox− animals, respectively. (H) Occupancy of the Amel promoter by Pitx2. ChIP products were quantitated by real-time PCR, with the amount of anti-Pitx2-immunoprecipitated DNA normalized to the amount of IgG-immunoprecipitated (Mock) DNA. Values shown are the enrichment of reactive DNA in the Dox+ relative to the Dox− samples, with the value of the latter set to 1.0. (±SEM from three independent ChIPs). (I) Levels of endogenous Amel in Dox+ versus Dox− cells, as assessed by real-time PCR. Levels from Dox+ cells were normalized to those in Dox− cells.
Figure 8.
Figure 8.
K14-Hmgn2 transgenic mice show enamel defects. Expression of Amel protein in wild-type and K14-Hmgn2 transgenic littermates. Animals were sacrificed at P4 and series of sagittal sections of the lower incisors were examined by immunofluorescence staining. Amel protein levels were assessed using an Alexa-488 (Green)-labeled antibody. (A, B) Amel staining on sections from (A) WT and (B) K14-Hmgn2 transgenic tissue. (C, D) Higher magnifications of boxed regions in (A) and (B), respectively. Arrowheads highlight the differences in Amel protein levels and the patterns of distribution in comparable locations. (E) Quantification of Alexa-488 signal on sections from five individual pairs of heads, showing that Amel levels are significantly decreased in the context of Hmgn2 expression. (F, G) Levels and distribution of Hmgn2 protein, labeled using Alexa-555 (Red), on the labial side of incisor epithelium. In all sections, DAPI staining reveals the nuclei. (H) Quantification of the Alexa-555 signal from five individual pairs of heads, demonstrating the efficiency of K14 promoter-driven Hmgn2 expression. Epithelial specificity was demonstrated by the similarities in the levels of endogenous Hmgn2 expression in the odontoblast layer from both tissues. (I, J) Representative trichrome-stained lower incisors from WT and Hmgn2 transgenic mice, respectively. This method stains the enamel dark red and the dentin blue. (K, L) Magnified views of the left-hand boxes in (I) and (J), respectively, demonstrating that the enamel layer is lost from the secretory segment of the incisor, as indicated by black arrowheads. (M, N) Magnified views of the right-hand boxes in (I) and (J), respectively. White dotted lines indicate that the thickness of the dentin layers is similar in the two genotypes. (O) Dlx2 transcripts from the mandibles and maxillae of P0 WT and K14-Hmgn2 transgenic mice were assessed by real-time PCRs. Dlx2 was down-regulated about 20% in the K14-Hmgn2 transgenic tissue. AM, ameloblast; OD, odontoblast; PM, papilla mesenchyme; Dt, dentin; Enm, enamel. Scale bar represents 100 μm.
Figure 9.
Figure 9.
ARS enamel defect model. (Upper panel) Schematic illustration of normal tooth development. During normal amelogenesis, the level of Hmgn2 expression decreases, leading to de-repression of Pitx2 and, consequently, activation of Amel expression, by both direct transcriptional activation and alteration of the transcriptional hierarchy that modulates Amel expression. The outcome is normal enamel deposition and mineralization. (Lower panel) Schematic illustration of the model for tooth development in ARS patients and in the context of Hmgn2 overexpression. When PITX2 loses its transcriptional function due to ARS mutations, both direct and indirect activation of Amel expression are perturbed, leading to decreased enamel deposition, and thus to a hypoplastic enamel layer. The K14-Hmgn2 transgenic mice, in which the high Hmgn2 levels lead to Pitx2 inhibition that mimics Pitx2 loss-of-function, phenocopy of the enamel hypoplasia observed in ARS patients. Red triangles, downregulation of expression; green triangles, upregulation of expression; DE, dental epithelium; FM, follicle mesenchyme; PM, papilla mesenchyme; Dt, dentin; Enm, enamel.

References

    1. Shields M.B., Buckley E., Klintworth G.K., Thresher R. Axenfeld–Rieger syndrome. A spectrum of developmental disorders. Survey Ophthal. 1985;29:387–409. doi:10.1016/0039-6257(85)90205-X. - DOI - PubMed
    1. Amendt B.A. The Molecular Mechanisms of Axenfeld–Rieger Syndrome. Springer, New York, NY, USA; 2005.
    1. Amendt B., Semina E., Alward W. Rieger syndrome: a clinical, molecular, and biochemical analysis. Cell Mol. Life Sci. 2000;57:1652–1666. doi:10.1007/PL00000647. - DOI - PMC - PubMed
    1. Lines M.A., Kozlowski K., Walter M.A. Molecular genetics of Axenfeld–Rieger malformations. Hum. Mol. Genet. 2002;11:1177–1187. doi:10.1093/hmg/11.10.1177. - DOI - PubMed
    1. Fitch N., Kaback M. The Axenfeld syndrome and the Rieger syndrome. J. Med. Genet. 1978;15:30–34. doi:10.1136/jmg.15.1.30. - DOI - PMC - PubMed

Publication types

MeSH terms

Supplementary concepts