. 2013 Nov 15;29(22):2900-8.
doi: 10.1093/bioinformatics/btt493. Epub 2013 Aug 23.

GIM3E: condition-specific models of cellular metabolism developed from metabolomics and expression data

Affiliations

GIM3E: condition-specific models of cellular metabolism developed from metabolomics and expression data

Brian J Schmidt et al. Bioinformatics. .

Abstract

Motivation: Genome-scale metabolic models have been used extensively to investigate alterations in cellular metabolism. The accuracy of these models to represent cellular metabolism in specific conditions has been improved by constraining the model with omics data sources. However, few practical methods for integrating metabolomics data with other omics data sources into genome-scale models of metabolism have been developed.

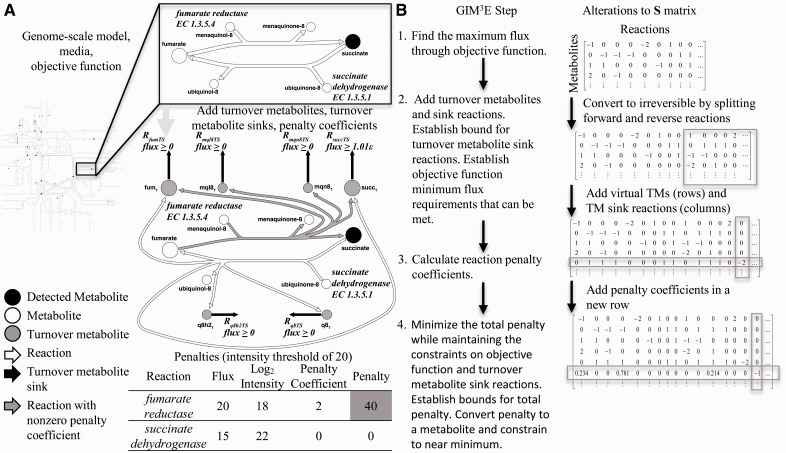
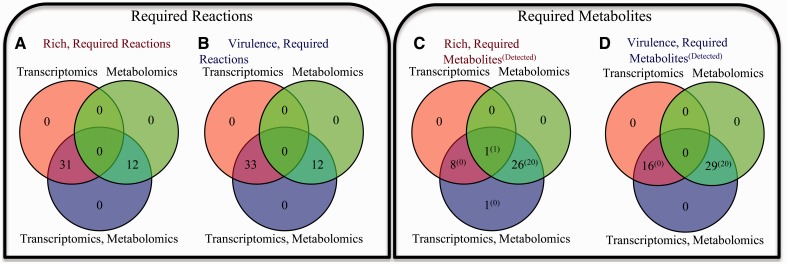
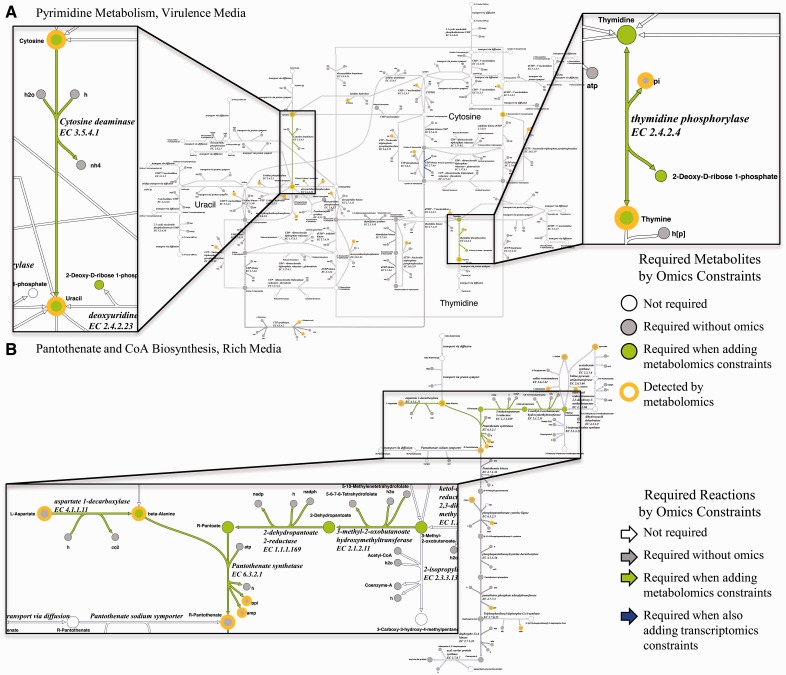
Results: GIM(3)E (Gene Inactivation Moderated by Metabolism, Metabolomics and Expression) is an algorithm that enables the development of condition-specific models based on an objective function, transcriptomics and cellular metabolomics data. GIM(3)E establishes metabolite use requirements with metabolomics data, uses model-paired transcriptomics data to find experimentally supported solutions and provides calculations of the turnover (production/consumption) flux of metabolites. GIM(3)E was used to investigate the effects of integrating additional omics datasets to create increasingly constrained solution spaces of Salmonella Typhimurium metabolism during growth in both rich and virulence media. This integration proved to be informative and resulted in a requirement of additional active reactions (12 in each case) or metabolites (26 or 29, respectively). The addition of constraints from transcriptomics also impacted the allowed solution space, and the cellular metabolites with turnover fluxes that were necessarily altered by the change in conditions increased from 118 to 271 of 1397.

Availability: GIM(3)E has been implemented in Python and requires a COBRApy 0.2.x. The algorithm and sample data described here are freely available at: http://opencobra.sourceforge.net/

Contacts: brianjamesschmidt@gmail.com


Figures

Fig. 1.
Fig. 1.
GIM3E modifies a genome-scale model of metabolism to incorporate constraints based on metabolomics and transcriptomics data. (A) GIM3E starts with a genome-scale model, allowed nutrient exchanges as defined by the media and an objective function such as biomass production (growth). Metabolomics data are mapped onto the model. Two reactions are shown in more detail to illustrate the manipulations to the model made during execution of the GIM3E algorithm. Turnover metabolites are added as products to each reaction, one turnover metabolite for each reaction substrate or product. A turnover sink reaction is also added for each turnover metabolite. The minimum bound for the turnover sink flux is set to a small positive value if the metabolite was detected. Transcriptomics data were used by calculating penalties for reactions that do not meet a threshold criterion. The inset table demonstrates a sample calculation of the penalty for each reaction assuming a given set of reaction flux values. The total penalty that is subject to minimization is calculated by summing the penalty values for all reactions. (B) Summary of the steps in GIM3E and alterations to the S matrix
Fig. 2.
Fig. 2.
Alternate omics constraints result in non-overlapping requirements for valid metabolic network operation. The effects of alternately imposing metabolomics-based constraints (green circle), transcriptomics-based constraints (red circle) or both (blue circle) are contrasted for (A) required reactions in rich medium, (B) required reactions in virulence medium, (C) required metabolites in rich medium and (D) required metabolites in virulence medium
Fig. 3.
Fig. 3.
Impact of omics datasets on the requirements in selected subsystem metabolism for S.Typhimurium. For clarity, the turnover metabolites added by GIM3E are not shown. The inclusion of additional constraints derived from transcriptomics data did not result in additional requirements for reactions and metabolites in the subsystems shown. (A) Requirements for pyrimidine metabolism in virulence medium. (B) Requirements for pantothenate and CoA biosynthesis in rich medium

References

    1. Ansong C, et al. A multi-omic systems approach to elucidating Yersinia virulence mechanisms. Mol. Biosyst. 2013a;9:44–54. - PMC - PubMed
    1. Ansong C, et al. Top-down proteomics reveals a unique protein S-thiolation switch in Salmonella Typhimurium in response to infection-like conditions. Proc. Natl Acad. Sci. USA. 2013b;110:10153–10158. - PMC - PubMed
    1. Aranda C, et al. Salmonella-typhimurium activates virulence gene-transcription within acidified macrophage phagosomes. Proc. Natl Acad. Sci. USA. 1992;89:10079–10083. - PMC - PubMed
    1. Becker SA, Palsson BØ. Context-specific metabolic networks are consistent with experiments. PLoS Comput. Biol. 2008;4:e1000082. - PMC - PubMed
    1. Blazier AS, Papin JA. Integration of expression data in genome-scale metabolic network reconstructions. Front. Physiol. 2012;3:299. - PMC - PubMed

Publication types

Substances