. 2011 Dec;4(4):510-537.
doi: 10.1007/s12195-011-0179-6.

An Integrative Review of Mechanotransduction in Endothelial, Epithelial (Renal) and Dendritic Cells (Osteocytes)

Affiliations

An Integrative Review of Mechanotransduction in Endothelial, Epithelial (Renal) and Dendritic Cells (Osteocytes)

Sheldon Weinbaum et al. Cell Mol Bioeng. 2011 Dec.

Abstract

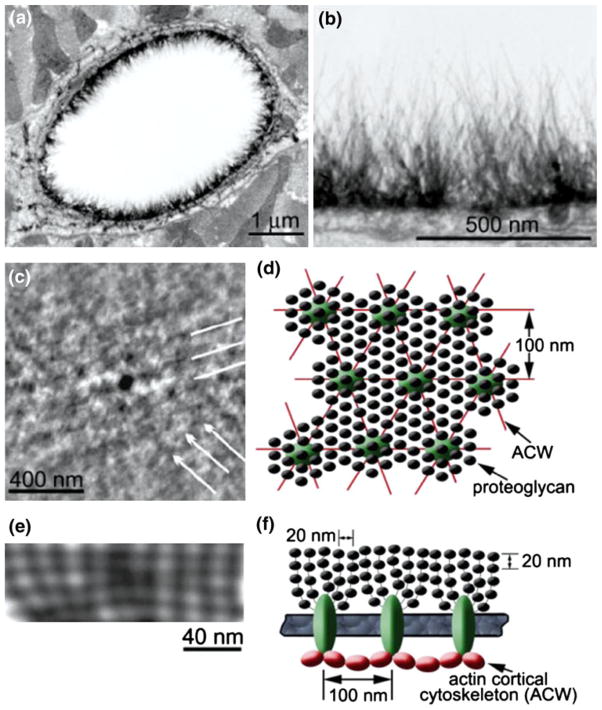
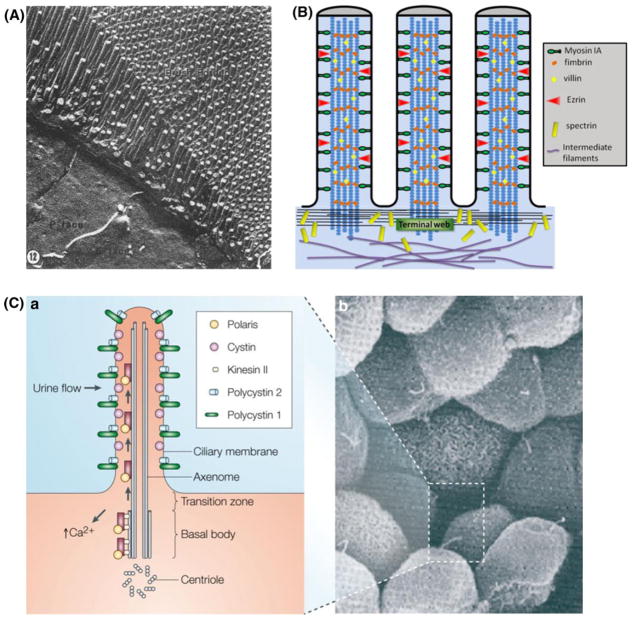
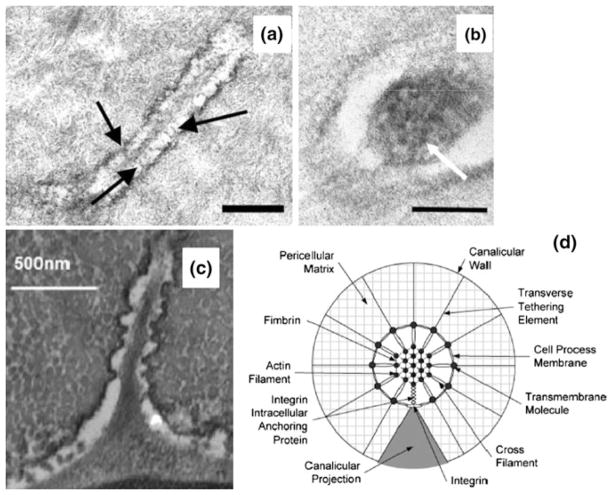
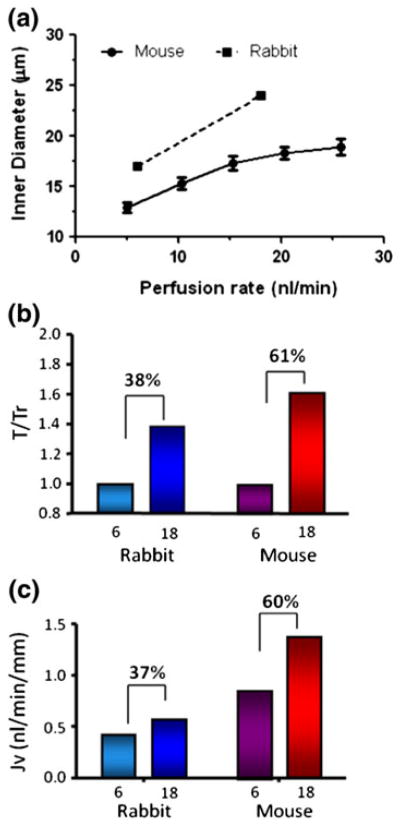
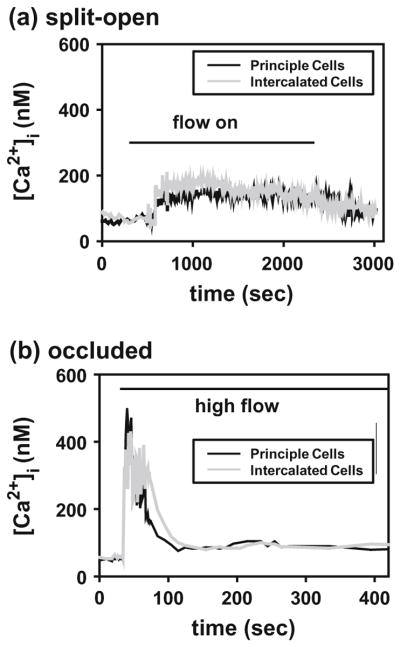
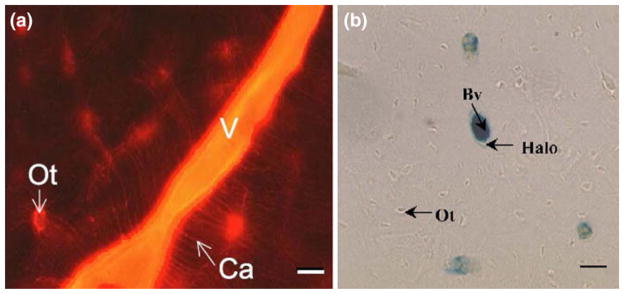
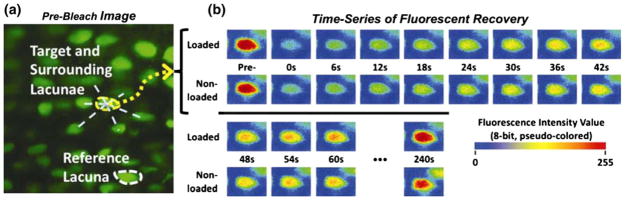
In this review we will examine from a biomechanical and ultrastructural viewpoint how the cytoskeletal specialization of three basic cell types, endothelial cells (ECs), epithelial cells (renal tubule) and dendritic cells (osteocytes), enables the mechano-sensing of fluid flow in both their native in vivo environment and in culture, and the downstream signaling that is initiated at the molecular level in response to fluid flow. These cellular responses will be discussed in terms of basic mysteries and paradoxes encountered by each cell type. In ECs fluid shear stress (FSS) is nearly entirely attenuated by the endothelial glycocalyx that covers their apical membrane and yet FSS is communicated to both intracellular and junctional molecular components in activating a wide variety of signaling pathways. The same is true in proximal tubule (PT) cells where a dense brush border of microvilli covers the apical surface and the flow at the apical membrane is negligible. A four decade old unexplained mystery is the ability of PT epithelia to reliably reabsorb 60% of the flow entering the tubule regardless of the glomerular filtration rate. In the cortical collecting duct (CCD) the flow rates are so low that a special sensing apparatus, a primary cilia is needed to detect very small variations in tubular flow. In bone it has been a century old mystery as to how osteocytes embedded in a stiff mineralized tissue are able to sense miniscule whole tissue strains that are far smaller than the cellular level strains required to activate osteocytes in vitro.

Keywords: Actin cortical web; Actin filament bundles; Bone cell processes; Brush border microvilli; Cortical collecting duct; Endothelial glycocalyx; Integrin attachments; Lacunar-canalicular system; Proximal tubule.


Figures

FIGURE 1
FIGURE 1
Ultrastructure of the endothelial glycocalyx layer (EGL). (a) An overview of transmission electron microscopy (TEM) image of a rat left ventricular myocardial capillary stained with Alcian blue (Bar = 1 μm). (b) A detailed image from (a) showing the distribution of hairy-like bushes in the EGL (Bar = 500 nm). (c) The computer-enhanced freeze-fracture image taken from the tangential inner surface of untreated frog mesenteric EGL showing a distinct quasi-hexagonal spacing around 100 nm (Bar = 400 nm). (d) Ultrastructural model of an EGL in tangential view. (e) An example of computer-enhanced sagittal section of the EGL with smaller periodic spacing approximately 20 nm (Bar = 40 nm). (f) The proposed ultrastructural model of an EGL in sagittal view showing the bush-like structure (glycoproteins) emanating from a common core protein cluster and its linkage to the underlying actin cortical cytoskeleton (ACW). From van den Berg et al. and Squire et al.
FIGURE 2
FIGURE 2
(A) Freeze-fracture appearance of the apical pole of a PT epithelial cell with its brush border. From Orci et al. (B) Sketch of cytoskeleton inside an intestinal microvillus. The intracellular structure of the intestinal microvillus is composed of two regions, a brush border and a terminal web. Adapted from Weinbaum et al. (C) In the primary cilium (a) of renal epithelial cells (b), ‘cargo’ proteins are trafficked along the microtubule tracks from the Golgi apparatus stack to the tip of the cilia using the motor protein kinesin II and back down using the cytoplasmic dynein1b (not shown). Adapted by permission from Macmillan Publishers Ltd: Nature Reviews Genetics, copyright (2005).
FIGURE 3
FIGURE 3
Ultrastructure of osteocyte process. (a) TEM photomicrograph showing the longitudinal section of an osteocyte process. Numerous transverse elements (arrows) can be seen extending from the cell process to the bony wall. Bar = 300 nm. From You et al. (b) TEM photomicrograph showing a cross section of an osteocyte process. Darkened circular spots (see arrow) are cross sections of cytoskeletal filaments around 6–8 nm in diameter, consistent with the size of F-actin filaments. Bar = 100 nm From You et al. (c) TEM photomicrograph of osteocyte shows longitudinal-sections of cell process showing that the bony wall of the canaliculus has protrusions projecting from the wall across the pericellular space in near contact with the cell membrane of the osteocyte process. From McNamara et al. (d) Transverse cross-section of the idealized structural model for an osteocyte process in a canaliculus attached to a focal attachment complex and tethered by the pericellular matrix. From Wang et al.
FIGURE 4
FIGURE 4
(a) The time-dependent change in shape of the core protein fibers in the EGL predicted by the elastohydrodynamic model. y/h0 and x/h0 are normalized vertical and horizontal axes of the fiber position with respect to the uncompressed thickness. Note the change from phase I to II occurs at 0.41 s. (b) Comparison of the elastohydrodynamic model (red line) and mechanoelectrochemical model predictions (blue triangles) obtained from Fig. 2b of Damiano and Stace with the experiment measurements in Han et al. The uncompressed EGL thickness = 400 nm. From Han et al.
FIGURE 5
FIGURE 5
(a) The tension on the focal attachment T0 as a function of loading frequency with tissue-loading amplitude as a parameter. (b) The axial membrane strains εa in the vicinity of focal attachment complex as a function of loading frequency with tissue-loading amplitude as a parameter. From Wang et al.
FIGURE 6
FIGURE 6
(a, b) Schematic representation of the conceptual “bumper car” model for the structural organization of the EC with intact EGL in response to FSS. (a) Under confluent control state, intact DPAB in ECs serves as a base for underlying actin cortical web (ACW) localized at the adherens junction just like a bumpers on a car. (b) Under fluid shear stress state, ECs respond to mechanotransduction across the EGL by reorganization of cytoskeleton and junctional and focal adhesion proteins. (c) Reorganization of EC cytoskeleton in response to fluid shear stress (FSS) of 10.5 dyne/cm2 with various media: intact EGL media (DMEM + 10% FBS or DMEM + 1% BSA) and compromised EGL media (Heparinase III + DMEM + 1% BSA). F-actin (red) and nuclei (blue). Bar = 20 μm. From Thi et al.
FIGURE 7
FIGURE 7
Evaluation of EC morphology after 24 h of fluid shear stress (15 dyne/cm2) in the presence or the absence of EGL. While control EC monolayer aligns in the direction of the flow, EC monolayer with compromised EGL (Heparinase III treatment) fails to exhibit alignment. From Yao et al.
FIGURE 8
FIGURE 8
(a and b): torque-dependent Na and HCO3 absorption. (c) torque ratio. Note that Jv and JHCO3 scale linearly with T/Tr as flow rate increases. From Du et al.
FIGURE 9
FIGURE 9
Flow-induced changes in PT transport. (a) inner diameter changes with increase in axial flow for mouse and rabbit. (b and c): torque ratio and reabsorption in mouse and rabbit PTs for 3-fold change in axial flow. From Du et al. and Burg and Orloff.
FIGURE 10
FIGURE 10
Representative traces of intracellular Ca2+ concentration responses of principal and intercalated cells to acute increase in superfusate flow rate in a split-open CCD (a), and circumferential stretch in an occluded CCD (b). Horizontal bars indentify onset and termination of high flow. From Liu et al.
FIGURE 11
FIGURE 11
Left: Tracer labeling at the posterior medial region of the rat tibia. Reactive red appeared in most blood vessels (v) and osteocytic lacunae (Ot) (magnification: 350×, scale bar: 40 mm). From Wang et al. Right: Ferritin distribution for the different histological processes. Ferritin was primarily confined to the bone blood vessels (Bv) with the sporadic presence of ferritin “halos” surrounding blood vessels (magnification: 900×, scale bar: 15 mm). From Ciani et al.
FIGURE 12
FIGURE 12
A representative pair of FRAP experiments with sodium fluorescein (376 Da) in a murinetibia subjected to cyclically loaded (peak load of 3 N at 0.5 Hz with a 4 s resting/imaging period between two cycles) or non-loaded paired tests. (a) Pre-bleach image showing a cluster of osteocyte lacunae chosen for FRAP imaging, including the target (outlined in yellow) and surrounding lacunae, along with a reference lacuna (outlined in white) for autofading correction. (b) The time-courses of fluorescence recovery within the same photobleached lacuna under loaded or non-loaded conditions. From Price et al.

References

    1. Adachi T, Aonuma Y, Tanaka M, Hojo M, Takano-Yamamoto T, Kamioka H. Calcium response in single osteocytes to locally applied mechanical stimulus: differences in cell process and cell body. J Biomech. 2009;42:1989–1995. - PubMed
    1. Adamson RH, Clough G. Plasma proteins modify the endothelial cell glycocalyx of frog mesenteric microvessels. J Physiol. 1992;445:473–486. - PMC - PubMed
    1. Adamson RH, Lenz JF, Zhang X, Adamson GN, Weinbaum S, Curry FE. Oncotic pressures opposing filtration across non-fenestrated rat microvessels. J Physiol. 2004;557:889–907. - PMC - PubMed
    1. Akst J. Full speed ahead: physical forces acting in and around cells are fast—and making waves in the world of molecular biology. Scientist. 2009;23:26–32.
    1. Alenghat FJ, Nauli SM, Kolb R, Zhou J, Ingber DE. Global cytoskeletal control of mechanotransduction in kidney epithelial cells. Exp Cell Res. 2004;301:23–30. - PubMed

LinkOut - more resources