. 2013 Aug 16;8(8):e71282.
doi: 10.1371/journal.pone.0071282. eCollection 2013.

Down-regulation of the oncogene PTTG1 via the KLF6 tumor suppressor during induction of myeloid differentiation

Affiliations

Down-regulation of the oncogene PTTG1 via the KLF6 tumor suppressor during induction of myeloid differentiation

Pei-Yi Chen et al. PLoS One. .

Abstract

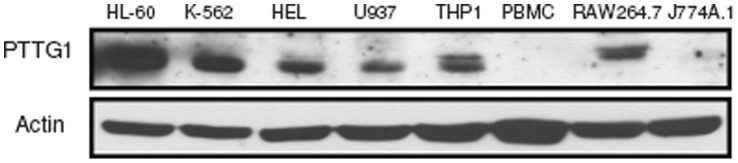
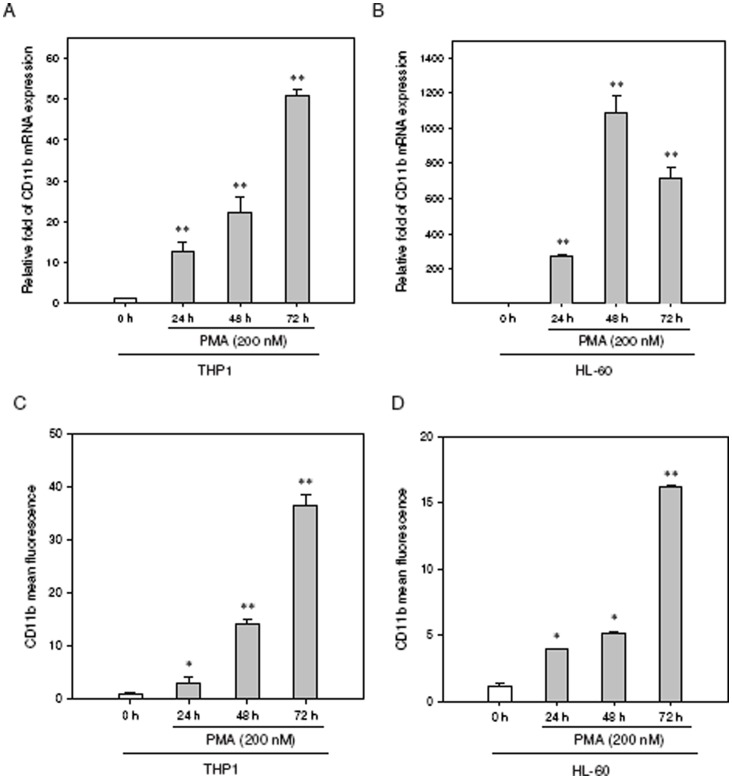
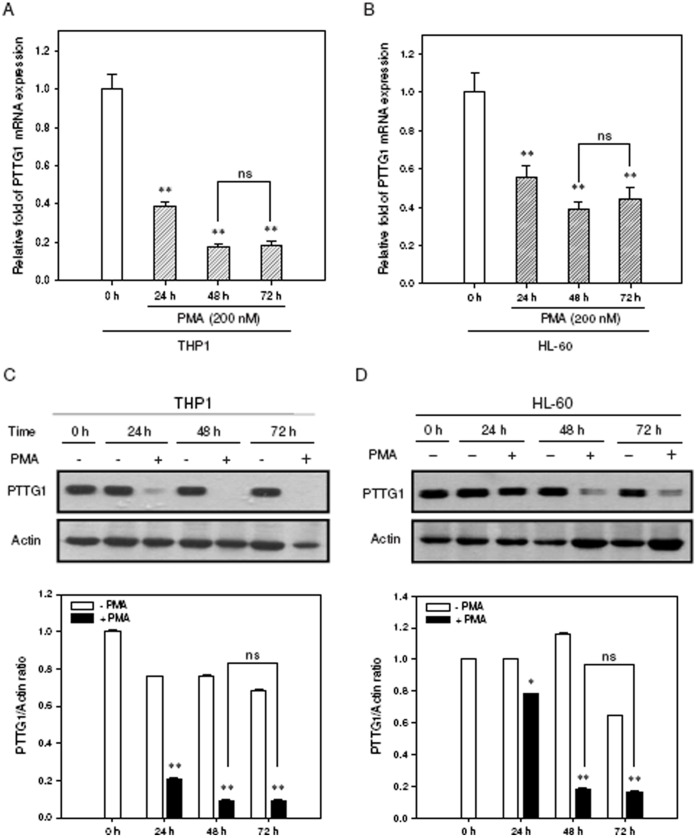
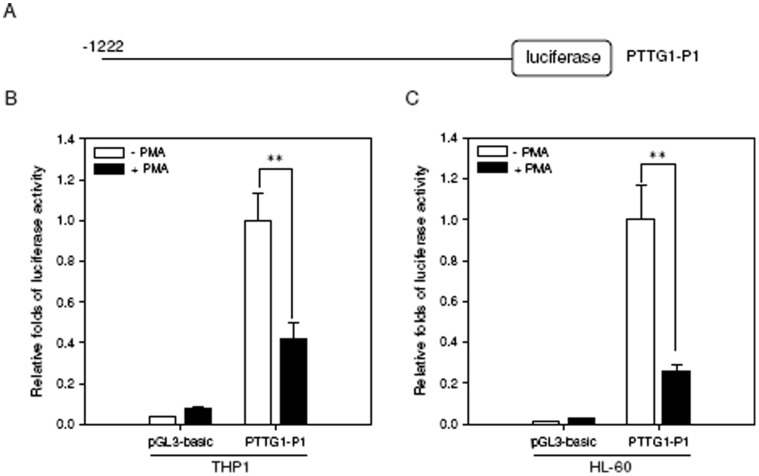
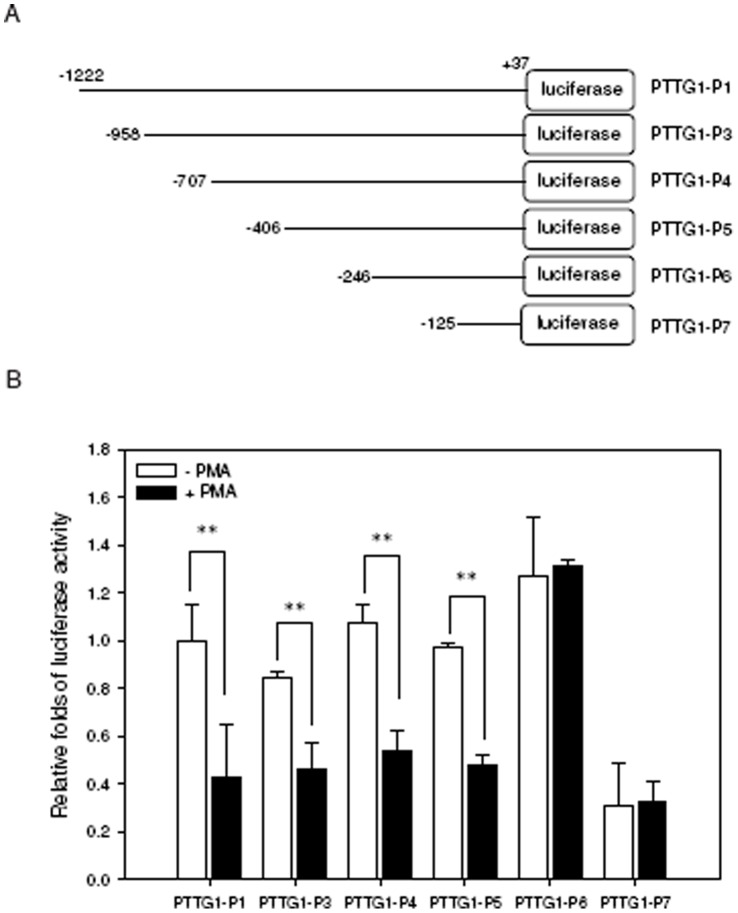
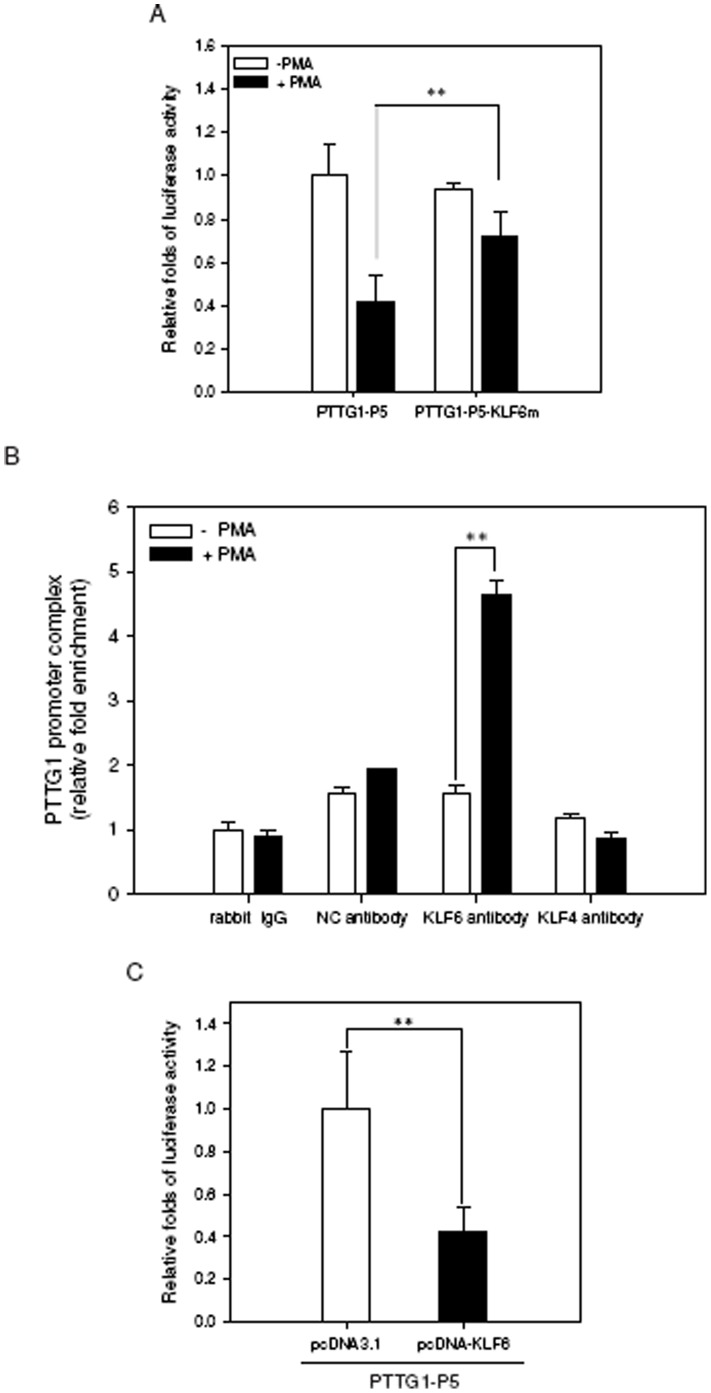
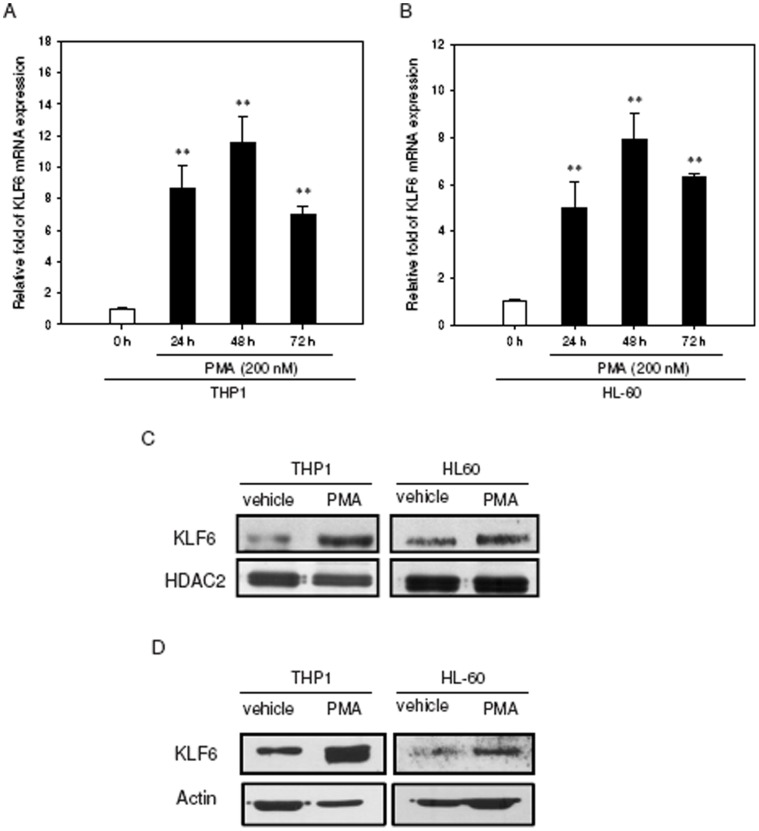
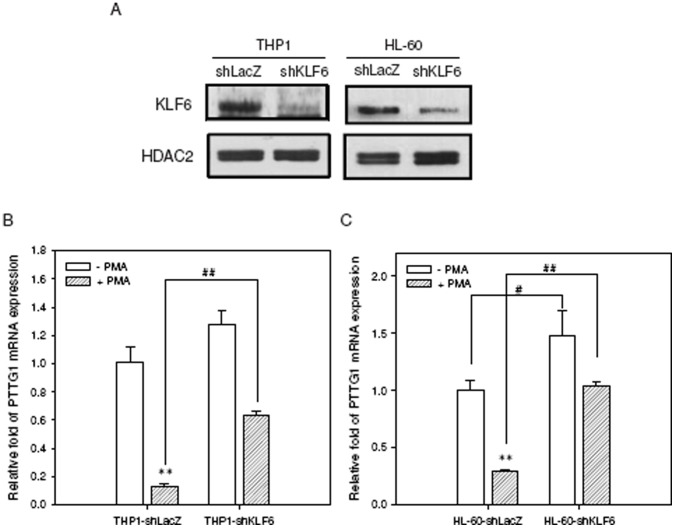
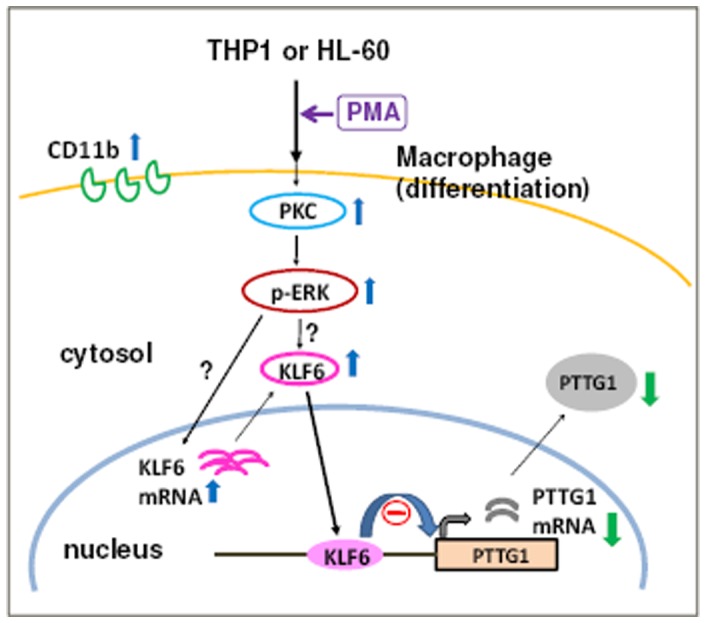
The aberrant expression of proto-oncogenes is involved in processes that are responsible for cellular proliferation and the inhibition of myeloid differentiation in acute myeloid leukemia (AML). Pituitary Tumor-Transforming gene 1 (PTTG1), an oncogenic transcription factor, is abundantly expressed in various human cancers and hematopoietic malignancies. However, its expression in normal leukocytes and most normal tissues is very low or undetectable. The mechanism by which PTTG1 overexpression modifies myeloid cell development and promotes leukemogenesis remain unclear. To investigate the mechanistic links between PTTG1 overexpression and leukemia cell differentiation, we utilized phorbol 12-myristate 13-acetate (PMA), a well-known agent that triggers monocyte/macrophage differentiation, to analyze the expression patterns of PTTG1 in PMA-induced myeloid differentiation. We found that PTTG1 is down-regulated at the transcriptional level in PMA-treated HL-60 and THP1 cells. In addition, we identified a binding site for a tumor suppressor protein, Kruppel-like factor 6 (KLF6), in the PTTG1 promoter. We found that KLF6 could directly bind and repress PTTG1 expression. In HL-60 and THP1 cells, KLF6 mRNA and protein levels are up-regulated with a concordant reduction of PTTG1 expression upon treatment with PMA. Furthermore, KLF6 knockdown by shRNA abolished the suppression of PTTG1 and reduced the activation of the differentiation marker CD11b in PMA-primed cells. The protein kinase C (PKC) inhibitor and the MAPK/ERK kinase (MEK) inhibitor significantly blocked the potentiation of PMA-mediated KLF6 induction and the down-regulation of PTTG1, indicating that PTTG1 is suppressed via the activation of PKC/ERK/KLF6 pathway. Our findings suggest that drugs that increase the KLF6 inhibition of PTTG1 may have a therapeutic application in AML treatment strategies.


Conflict of interest statement

Competing Interests: The authors have declared that no competing interests exist.

Figures

Figure 1
Figure 1. PTTG1 is up-regulated in human leukemia cells.
Western blot analysis was performed to detect PTTG1 and actin proteins in human leukemia cell lines HL-60, K-562, HEL92.1.7, U937, THP1, PBMC (peripheral blood mononuclear cells) and mouse macrophage RAW264.7 and J774A.1 cells. Mouse J774A.1 cells were more differentiated, compared with the five less differentiated human leukemia cells. PBMC was used as a normal cell control.
Figure 2
Figure 2. CD11b expression is induced in human leukemia cell lines upon treatment with PMA.
The THP1 or HL-60 cells were treated with PMA (200 nM) for the indicated periods. The CD11b mRNA expression was determined by qRT-PCR in (A) THP1 and (B) HL-60 cells. The CD11b(+) cells were detected using FITC-labeled CD11b antibody, then analyzed by flow cytometry and expressed as the mean fluorescence intensity in (C) THP1 and (D) HL-60 cells. Data represent the mean ± SD from three independent experiments. *p<0.05 and **p<0.01 represents significant differences compared with the 0 h group.
Figure 3
Figure 3. PTTG1 expression is down-regulated during PMA-induced cell differentiation.
Total cellular RNA was extracted and PTTG1 mRNA expression was determined by qRT-PCR in (A) THP1 and (B) HL-60 cells treated with PMA (200 nM) for indicated periods. Data represent the mean ± SD from five independent experiments. **p<0.01 represents significant differences compared with the 0 h group. ns represents no significance. Western blot analysis was performed to detect PTTG1 and actin proteins in (C) THP1 and (D) HL-60 cells. The immunoblot experiments were replicated at least three times, and a representative blot is shown. The normalized intensity of PTTG1 versus actin is presented as the mean ± SD of three independent experiments. *p<0.05 and **p<0.01 represents significant differences compared with the 0 h group. ns represents no significance.
Figure 4
Figure 4. PTTG1 promoter activity is suppressed during PMA-induced THP1 or HL-60 cell differentiation.
(A) Schematic diagram of a construct of PTTG1 promoter-luciferase reporter. Position +1 was assigned to the nucleotide at the transcription start site. The control pGL3-basic vector or the PTTG1-P1 construct was co-transfected with the Renilla internal control vector into THP1 or HL-60 cells. Twenty-four hours after transfection, cells were treated with vehicle (0.1% DMSO) or PMA (200 nM) for 24 h. Cells were then harvested for the luciferase reporter assay. PTTG1 promoter activity was detected in PMA-primed THP1 (B) and HL-60 (C) cells. The intensities of the luciferase reactions measured in the lysates of the transfected cells were normalized to their Renilla luciferase control activity. Data represent the mean ± SD from three independent experiments. ** p<0.01 represents significant differences compared with the vehicle-treated cells.
Figure 5
Figure 5. Characterization of a PMA-responsive regulatory element within the PTTG1 promoter.
(A) Schematic diagram of the serial deleted constructs of PTTG1 promoter luciferase reporters. (B) The reporter constructs were transiently co-transfected with the Renilla luciferase control vector into THP1 cells. Twenty-four hours after transfection, cells were treated with vehicle (0.1% DMSO) or PMA (200 nM) for 24 h. Cells were then harvested for the luciferase reporter assay. The intensities of the luciferase reactions measured in the lysates of the transfected cells were normalized to their Renilla luciferase control activity. Data represent the mean ± SD from three independent experiments. ** p<0.01 represents significant differences compared with the vehicle-treated cells.
Figure 6
Figure 6. KLF6 binds to the PTTG1 promoter and represses PTTG1 transcription.
(A) A mutation construct of the PTTG1 promoter (PTTG1-P5-KLF6m) contained the site-specific mutated nucleotides within the KLF6 binding element of PTTG1-P5 construct. The wild-type or mutated reporter constructs were transiently co-transfected with Renilla luciferase control vector into THP1 cells for 24 h. Cells were harvested and the luciferase activity was measured. The intensities of the luciferase reactions measured in the lysates of the transfected cells were normalized to the Renilla luciferase control activity. Data represent the mean ± SD from three independent experiments. ** p<0.01 represents significant differences compared with the PTTG1-P5 transfected cells followed by PMA treatment. (B) THP1 cells were treated with vehicle (0.1% DMSO) or PMA (200 nM) for 48 h followed by a ChIP assay as described in Material and Methods. After immunoprecipitation of cellular chromatin with control rabbit IgG, anti-CREB (as a KLF-unrelated antibody negative control; NC antibody), anti-KLF6 or anti-KLF4 antibody, the PTTG1 promoter complex was measured by quantitative real time PCR using primers span the nucleotides −406 to −246 region of PTTG1 promoter. Data are expressed as the fold increase of NC antibody, anti-KLF6 or anti-KLF4 antibody over the control rabbit IgG, respectively. Data represent the mean ± SD from five independent experiments. ** p<0.01 represents significant differences compared with the anti-KLF6 antibody without PMA treatment. (C) The pcDNA3.1(+) control vector or pcDNA-KLF6 expression plasmid were co-transfected with PTTG1-P5 reporter plasmid and Renilla luciferase control vector into THP1 cells. Cells were harvested 48 h post-transfection for the luciferase reporter assay. The intensities of the luciferase reactions measured in the lysates of the transfected cells were normalized to the Renilla luciferase control activity. Data represent the mean ± SD from three independent experiments. ** p<0.01 represents significant differences compared with the pcDNA3.1(+) control vector-transfected cells.
Figure 7
Figure 7. Examination of KLF6 expression levels during PMA-induced differentiation in THP1 and HL-60 cells.
THP1 or HL-60 cells (1×10⁶/well) were treated with PMA (200 nM) for indicated periods. Total cellular RNA was extracted and KLF6 mRNA expression was determined by qRT-PCR in (A) THP1 and (B) HL-60 cells. Data represent the mean ± SD from five independent experiments. **p<0.01 represents significant differences compared with the 0 h group. Cells were treated with PMA (200 nM) for 48 h, and nuclear extracts (C) or cytoplasmic fractions (D) were prepared for the analysis of KLF6 protein levels. Western blot analysis was performed with antibodies against KLF6, HDAC2 and actin in THP1 and HL-60 cells. The immunoblot experiments were replicated at least three times, and a representative blot is shown.
Figure 8
Figure 8. The effect of KLF6 knockdown on PTTG1 transcription during PMA-induced cell differentiation.
(A) Knockdown of KLF6 expression was performed using a specific lentiviral vector encoding KLF6 shRNA, and stable clones were selected with puromycin (2 µg/ml) for 2 weeks. Western blot of nuclear extracts was performed to examine the knockdown efficiency of shKLF6-THP1 and shKLF6-HL-60 cells compared with cells transfected with shLacZ lentiviral vector. Cells with stable KLF6 knockdown were treated with PMA (200 nM) for 72 h. Total cellular RNA was extracted and PTTG1 mRNA expression was determined by qRT-PCR in (B) THP1 and (C) HL-60 cells. Data represent the mean ± SD from three independent experiments. **p<0.01 represents significant differences compared with PMA non-treated cells. ## p<0.01 represents significant differences compared with the PMA-treated shLacZ knockdown control group.
Figure 9
Figure 9. Signaling pathways involved in the down-regulation of PTTG1 during PMA-induced THP1 cell differentiation.
THP1 cells were pretreated with vehicle (veh, 0.1% DMSO), bisindolylmaleimide I (BIM, 5 µM) or U0126 (10 µM) for 30 min followed by exposure to PMA (200 nM) for 48 hr. (A) Total cellular RNA was extracted and PTTG1 mRNA expression was determined by qRT-PCR. (B) Total cellular RNA was extracted and KLF6 mRNA expression was determined by qRT-PCR. Data represent the mean ± SD from three independent experiments. ** p<0.01 represents significant differences compared with PMA-non-treated cells. ## p<0.01 represents significant differences compared with the vehicle group. (C) The PTTG1 protein from total cellular lysate was detected by Western blot analysis. (D) The level of KLF6 protein from nuclear extract was determined by Western blot analysis. The immunoblot experiments were replicated at least three times, and a representative blot is shown.
Figure 10
Figure 10. Proposed model for the down-regulation of PTTG1 during PMA-induced leukemia cell differentiation.
In THP1 and HL-60 cells, the activation of PKC/ERK/KLF6 signaling axes contributes to PTTG1 suppression during PMA-induced myeloid differentiation.

Similar articles

Cited by

References

    1. Miyoshi H, Shimizu K, Kozu T, Maseki N, Kaneko Y, et al. (1991) t(8;21) breakpoints on chromosome 21 in acute myeloid leukemia are clustered within a limited region of a single gene, AML1. Proc Natl Acad Sci U S A 88: 10431–10434. - PMC - PubMed
    1. Crans-Vargas HN, Landaw EM, Bhatia S, Sandusky G, Moore TB, et al. (2002) Expression of cyclic adenosine monophosphate response-element binding protein in acute leukemia. Blood 99: 2617–2619. - PubMed
    1. Shima Y, Kitabayashi I (2011) Deregulated transcription factors in leukemia. Int J Hematol 94: 134–141. - PubMed
    1. Pei L, Melmed S (1997) Isolation and characterization of a pituitary tumor-transforming gene (PTTG). Mol Endocrinol 11: 433–441. - PubMed
    1. Dominguez A, Ramos-Morales F, Romero F, Rios RM, Dreyfus F, et al. (1998) hpttg, a human homologue of rat pttg, is overexpressed in hematopoietic neoplasms. Evidence for a transcriptional activation function of hPTTG. Oncogene 17: 2187–2193. - PubMed

Publication types

MeSH terms