

Rapid cohort generation and analysis of disease spectrum of large animal model of cone dystrophy
- PMID: 23977029
- PMCID: PMC3747164
- DOI: 10.1371/journal.pone.0071363
Rapid cohort generation and analysis of disease spectrum of large animal model of cone dystrophy
Abstract
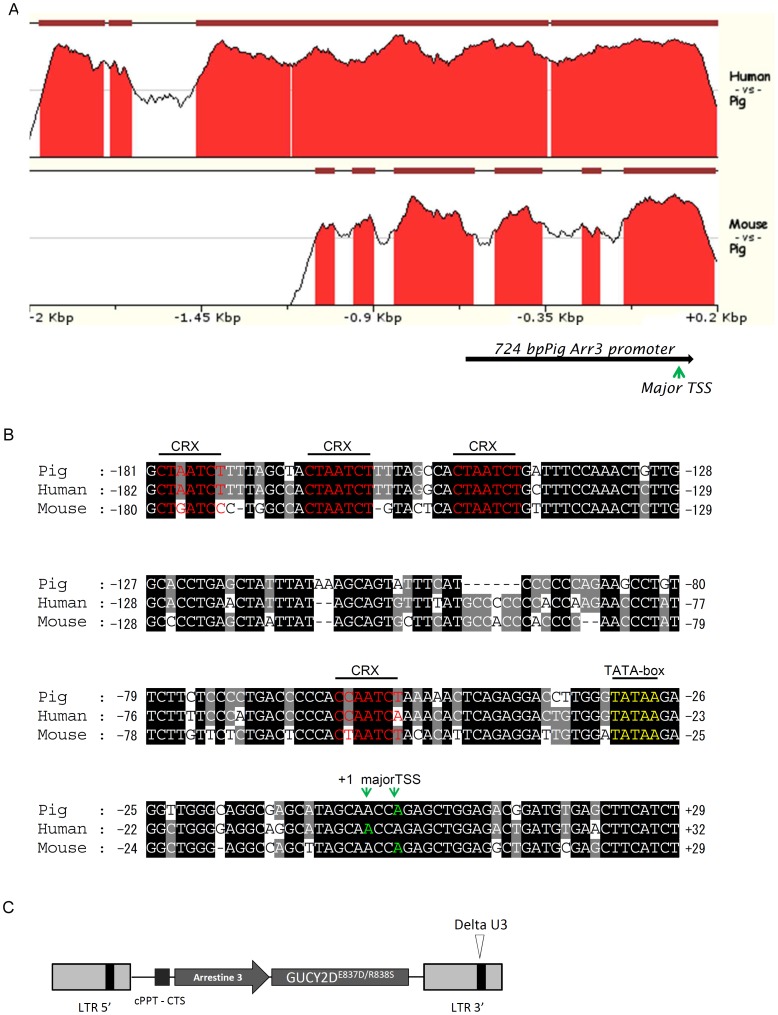
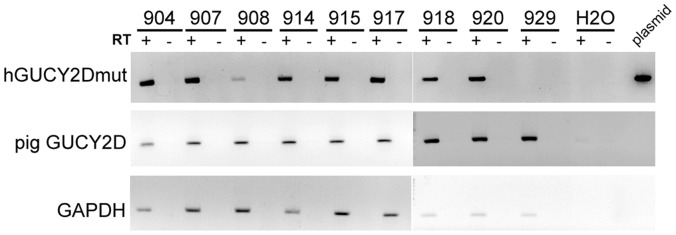
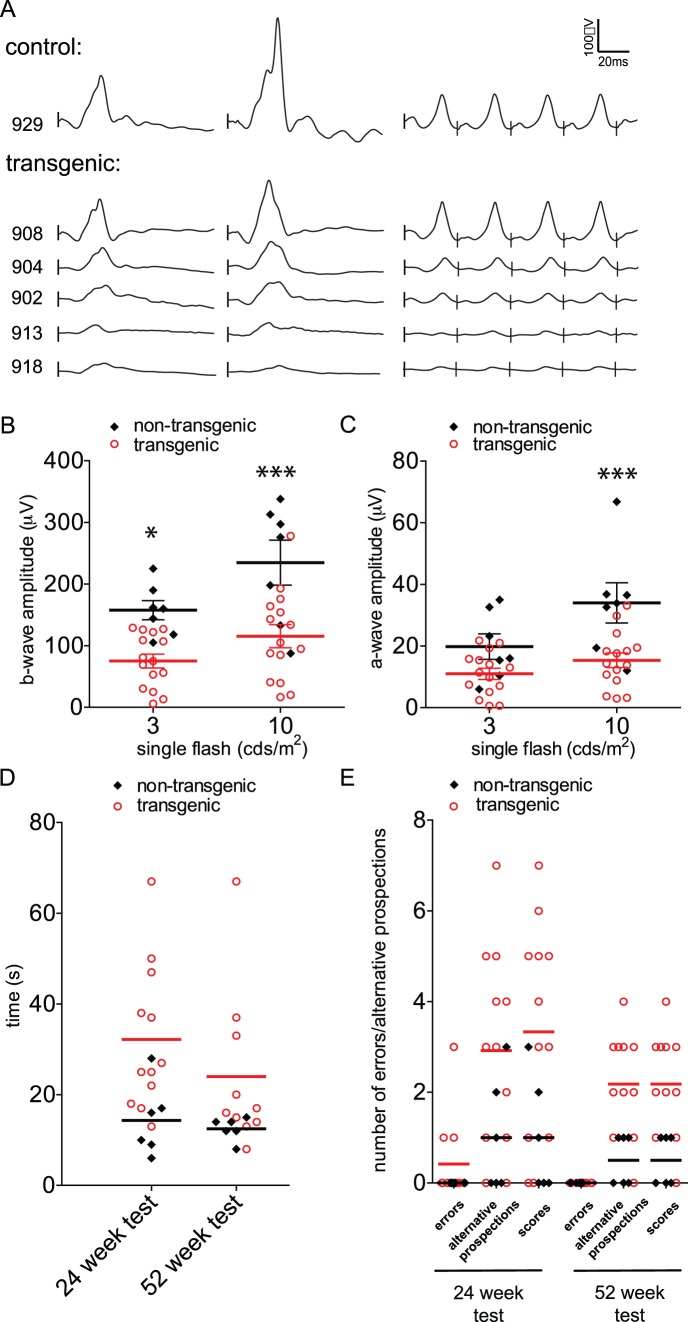
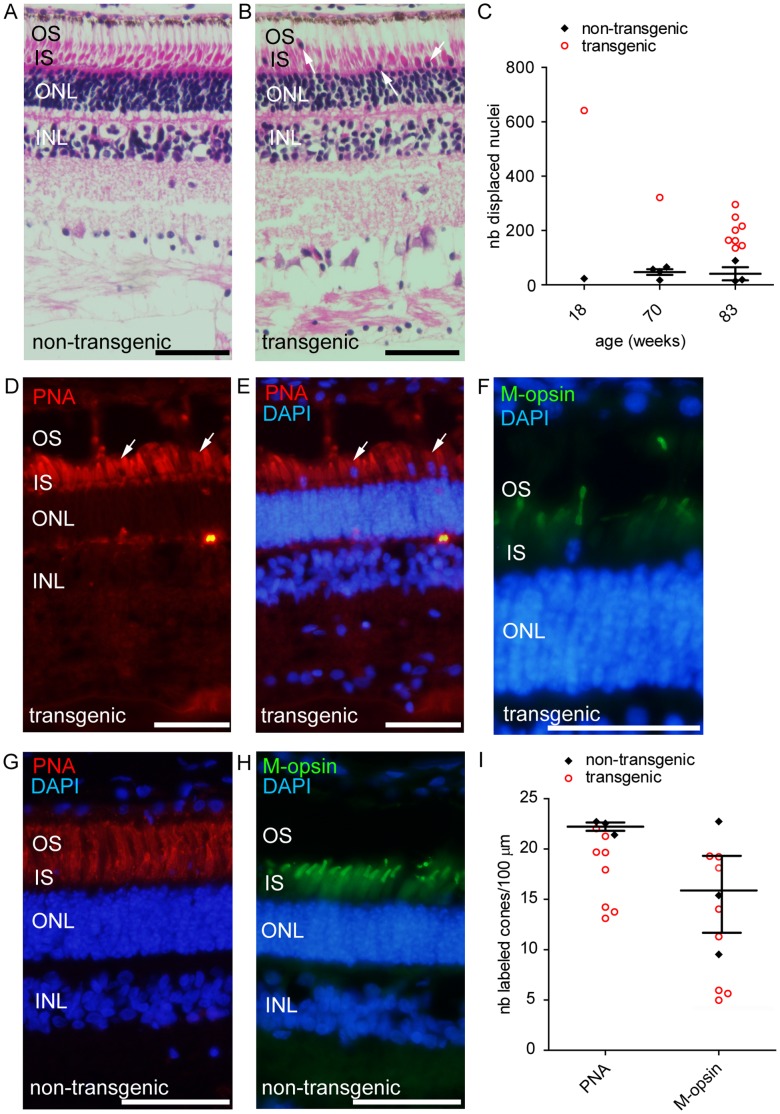
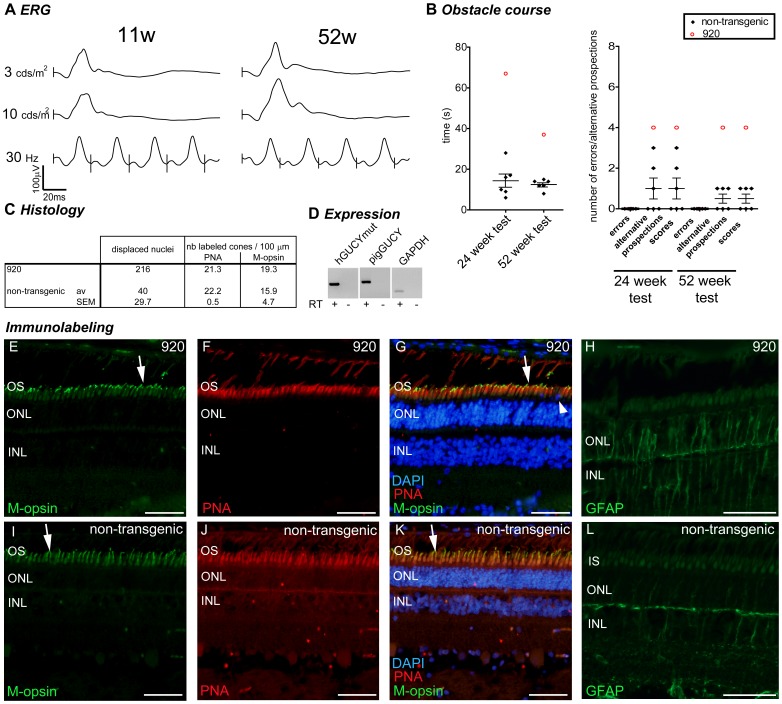
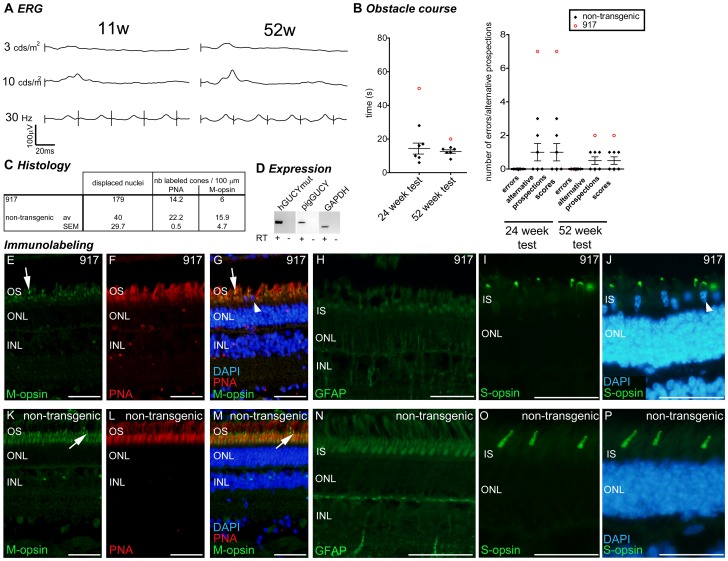
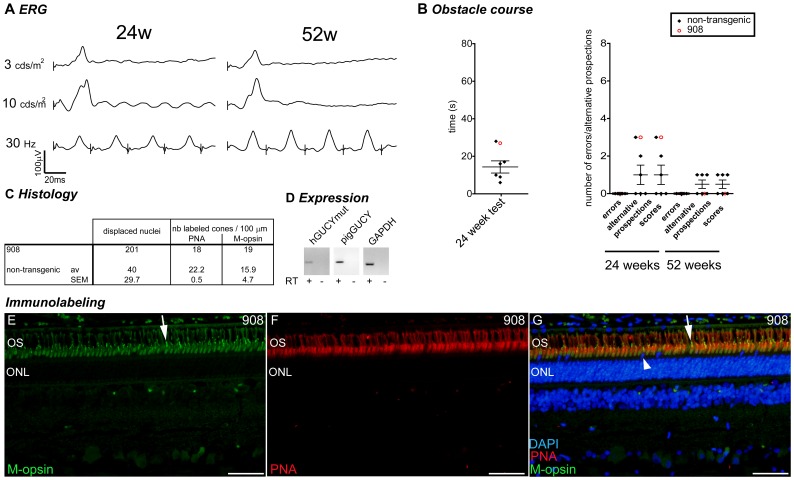
Large animal models are an important resource for the understanding of human disease and for evaluating the applicability of new therapies to human patients. For many diseases, such as cone dystrophy, research effort is hampered by the lack of such models. Lentiviral transgenesis is a methodology broadly applicable to animals from many different species. When conjugated to the expression of a dominant mutant protein, this technology offers an attractive approach to generate new large animal models in a heterogeneous background. We adopted this strategy to mimic the phenotype diversity encounter in humans and generate a cohort of pigs for cone dystrophy by expressing a dominant mutant allele of the guanylate cyclase 2D (GUCY2D) gene. Sixty percent of the piglets were transgenic, with mutant GUCY2D mRNA detected in the retina of all animals tested. Functional impairment of vision was observed among the transgenic pigs at 3 months of age, with a follow-up at 1 year indicating a subsequent slower progression of phenotype. Abnormal retina morphology, notably among the cone photoreceptor cell population, was observed exclusively amongst the transgenic animals. Of particular note, these transgenic animals were characterized by a range in the severity of the phenotype, reflecting the human clinical situation. We demonstrate that a transgenic approach using lentiviral vectors offers a powerful tool for large animal model development. Not only is the efficiency of transgenesis higher than conventional transgenic methodology but this technique also produces a heterogeneous cohort of transgenic animals that mimics the genetic variation encountered in human patients.
Conflict of interest statement
Figures
Similar articles
-
Transgenic zebrafish expressing mutant human RETGC-1 exhibit aberrant cone and rod morphology.Exp Eye Res. 2013 Mar;108:120-8. doi: 10.1016/j.exer.2013.01.003. Epub 2013 Jan 15. Exp Eye Res. 2013. PMID: 23328348
-
Phenotypic characterization of a Chinese family with autosomal dominant cone-rod dystrophy related to GUCY2D.Doc Ophthalmol. 2013 Jun;126(3):233-40. doi: 10.1007/s10633-013-9383-0. Epub 2013 May 21. Doc Ophthalmol. 2013. PMID: 23686677
-
Autosomal dominant cone-rod dystrophy with mutations in the guanylate cyclase 2D gene encoding retinal guanylate cyclase-1.Arch Ophthalmol. 2001 Nov;119(11):1667-73. doi: 10.1001/archopht.119.11.1667. Arch Ophthalmol. 2001. PMID: 11709018
-
Mouse models for cone degeneration.Adv Exp Med Biol. 2014;801:567-73. doi: 10.1007/978-1-4614-3209-8_72. Adv Exp Med Biol. 2014. PMID: 24664745 Review.
-
Genotype-functional-phenotype correlations in photoreceptor guanylate cyclase (GC-E) encoded by GUCY2D.Prog Retin Eye Res. 2018 Mar;63:69-91. doi: 10.1016/j.preteyeres.2017.10.003. Epub 2017 Oct 20. Prog Retin Eye Res. 2018. PMID: 29061346 Review.
Cited by
-
Early disruption of photoreceptor cell architecture and loss of vision in a humanized pig model of usher syndromes.EMBO Mol Med. 2022 Apr 7;14(4):e14817. doi: 10.15252/emmm.202114817. Epub 2022 Mar 7. EMBO Mol Med. 2022. PMID: 35254721 Free PMC article.
-
Animal modelling for inherited central vision loss.J Pathol. 2016 Jan;238(2):300-10. doi: 10.1002/path.4641. Epub 2015 Nov 13. J Pathol. 2016. PMID: 26387748 Free PMC article. Review.
-
A Porcine Anterior Segment Perfusion and Transduction Model With Direct Visualization of the Trabecular Meshwork.Invest Ophthalmol Vis Sci. 2016 Mar;57(3):1338-44. doi: 10.1167/iovs.15-18125. Invest Ophthalmol Vis Sci. 2016. PMID: 27002293 Free PMC article.
-
Advancing therapeutic strategies for inherited retinal degeneration: recommendations from the Monaciano Symposium.Invest Ophthalmol Vis Sci. 2015 Feb 9;56(2):918-31. doi: 10.1167/iovs.14-16049. Invest Ophthalmol Vis Sci. 2015. PMID: 25667399 Free PMC article. Review.
-
Genome editing revolutionize the creation of genetically modified pigs for modeling human diseases.Hum Genet. 2016 Sep;135(9):1093-105. doi: 10.1007/s00439-016-1710-6. Epub 2016 Jul 18. Hum Genet. 2016. PMID: 27432159 Review.
References
-
- Pacal M, Bremner R (2006) Insights from animal models on the origins and progression of retinoblastoma. Curr Mol Med 6: 759–781. - PubMed
-
- Davidson DJ, Rolfe M (2001) Mouse models of cystic fibrosis. Trends Genet 17: S29–37. - PubMed
-
- Schook L, Beattie C, Beever J, Donovan S, Jamison R, et al. (2005) Swine in biomedical research: creating the building blocks of animal models. Anim Biotechnol 16: 183–190. - PubMed
-
- Lois C, Hong EJ, Pease S, Brown EJ, Baltimore D (2002) Germline transmission and tissue-specific expression of transgenes delivered by lentiviral vectors. Science 295: 868–872. - PubMed
Publication types
MeSH terms
Substances
Grants and funding
- BBS/E/D/05251442/BB_/Biotechnology and Biological Sciences Research Council/United Kingdom
- BBS/E/D/05251443/BB_/Biotechnology and Biological Sciences Research Council/United Kingdom
- BBS/E/D/07731442/BB_/Biotechnology and Biological Sciences Research Council/United Kingdom
- BBS/E/D/05251445/BB_/Biotechnology and Biological Sciences Research Council/United Kingdom
- BBS/E/D/05251444/BB_/Biotechnology and Biological Sciences Research Council/United Kingdom
LinkOut - more resources
Full Text Sources
Other Literature Sources
Molecular Biology Databases
