

Large scale comparison of gene expression levels by microarrays and RNAseq using TCGA data
- PMID: 23977046
- PMCID: PMC3748065
- DOI: 10.1371/journal.pone.0071462
Large scale comparison of gene expression levels by microarrays and RNAseq using TCGA data
Abstract
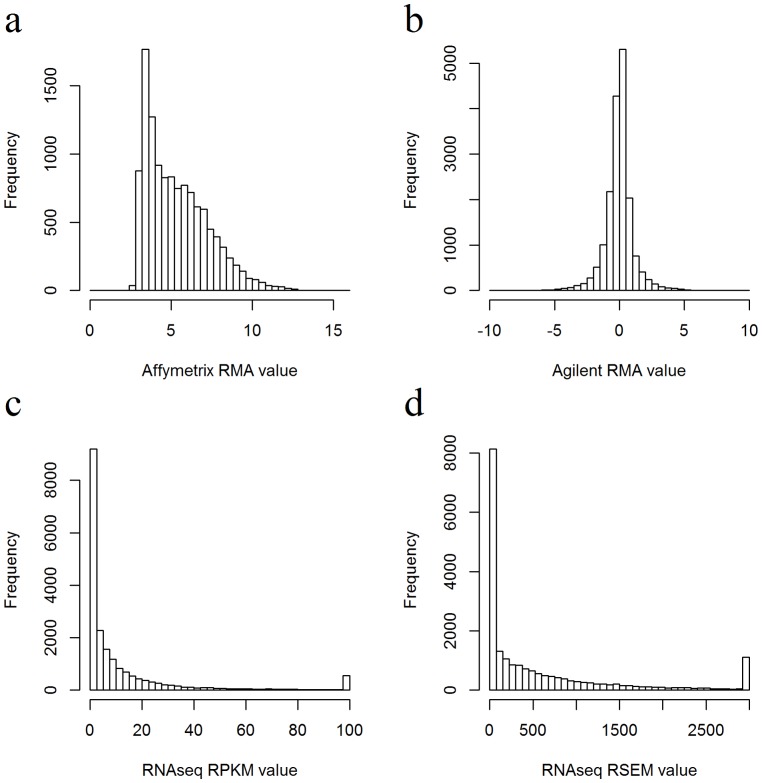
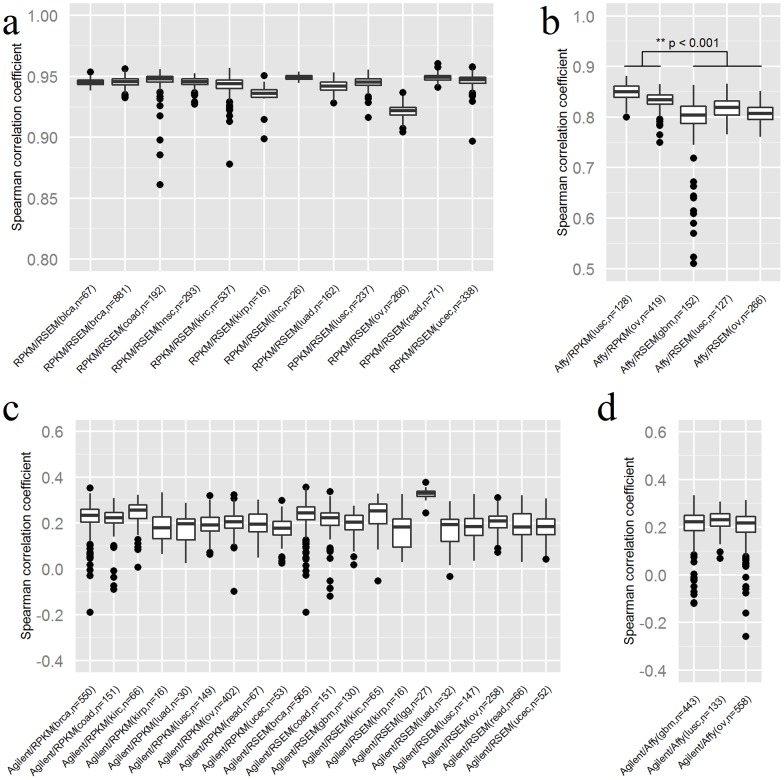
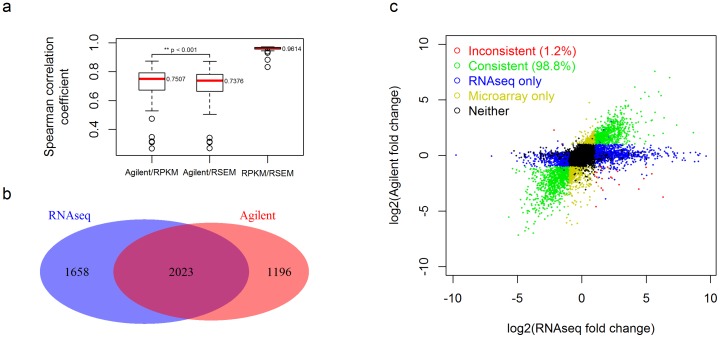
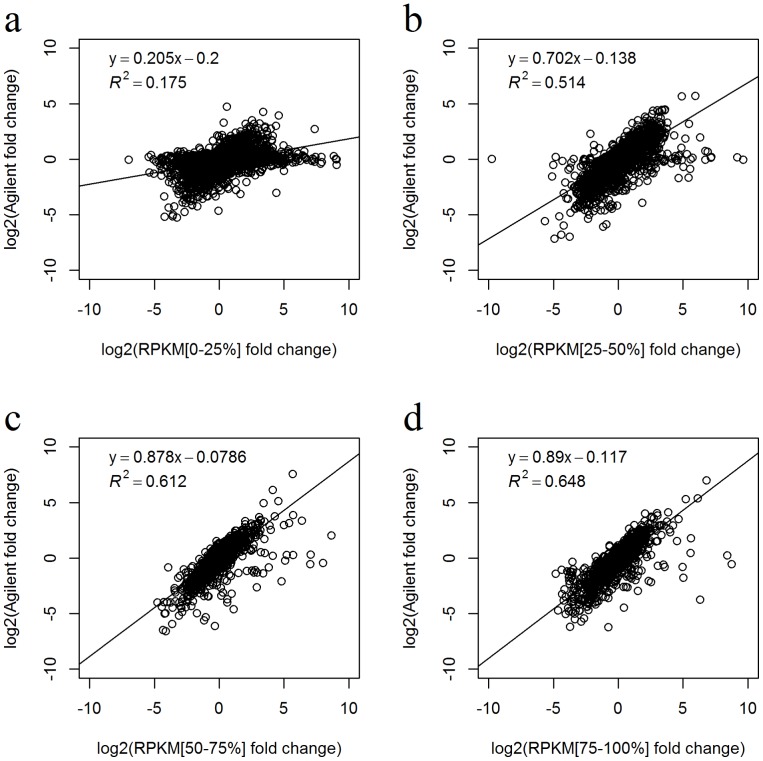
RNAseq and microarray methods are frequently used to measure gene expression level. While similar in purpose, there are fundamental differences between the two technologies. Here, we present the largest comparative study between microarray and RNAseq methods to date using The Cancer Genome Atlas (TCGA) data. We found high correlations between expression data obtained from the Affymetrix one-channel microarray and RNAseq (Spearman correlations coefficients of ∼0.8). We also observed that the low abundance genes had poorer correlations between microarray and RNAseq data than high abundance genes. As expected, due to measurement and normalization differences, Agilent two-channel microarray and RNAseq data were poorly correlated (Spearman correlations coefficients of only ∼0.2). By examining the differentially expressed genes between tumor and normal samples we observed reasonable concordance in directionality between Agilent two-channel microarray and RNAseq data, although a small group of genes were found to have expression changes reported in opposite directions using these two technologies. Overall, RNAseq produces comparable results to microarray technologies in term of expression profiling. The RNAseq normalization methods RPKM and RSEM produce similar results on the gene level and reasonably concordant results on the exon level. Longer exons tended to have better concordance between the two normalization methods than shorter exons.
Conflict of interest statement
Figures
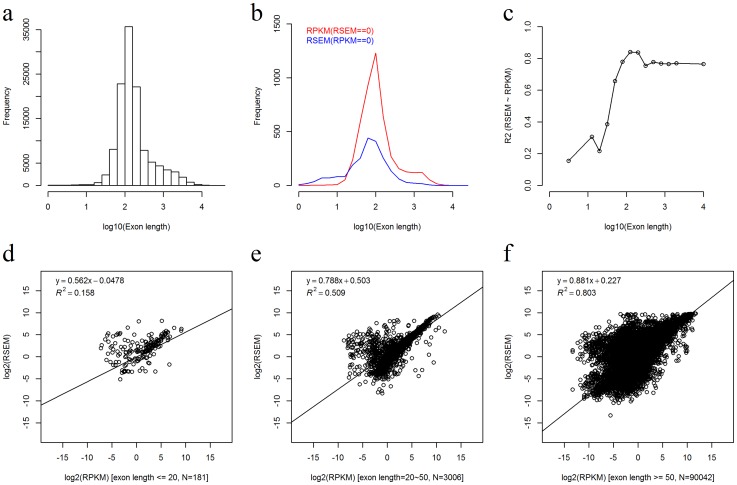
 of linear regression between the RPKM and RSEM values in sub-groups defined by the exon length. The group intervals equalled to the group intervals in figure 5a, except the first five and the last five groups were merged respectively due to small exon count in those groups. Only the exons detected by both RPKM and RSEM methods were used. d-f) The detailed scatter plots of exon expression consistency in three groups divided by exon length of 1∼20, 21∼50, and >50 base pairs. Only the exons detected by both RPKM and RSEM methods were used. Figures c-f indicate that the exon expression consistency increases significantly with exon length until exon length is larger than about 50 base pairs.
References
-
- Shendure J (2008) The beginning of the end for microarrays? Nat Methods 5: 585–587. - PubMed
-
- Patterson TA, Lobenhofer EK, Fulmer-Smentek SB, Collins PJ, Chu TM, et al. (2006) Performance comparison of one-color and two-color platforms within the MicroArray Quality Control (MAQC) project. Nat Biotechnol 24: 1140–1150. - PubMed
Publication types
MeSH terms
Grants and funding
LinkOut - more resources
Full Text Sources
Other Literature Sources
Research Materials
