. 2013 Aug 16;8(8):e71616.
doi: 10.1371/journal.pone.0071616. eCollection 2013.

Rotavirus seasonality and age effects in a birth cohort study of southern India

Affiliations

Rotavirus seasonality and age effects in a birth cohort study of southern India

Rajiv Sarkar et al. PLoS One. .

Erratum in

  • PLoS One. 2014;9(1). doi:10.1371/annotation/2f5b6cf8-926b-4397-9a89-64544cc7d512

Abstract

Introduction: Understanding the temporal patterns in disease occurrence is valuable for formulating effective disease preventive programs. Cohort studies present a unique opportunity to explore complex interactions associated with emergence of seasonal patterns of infectious diseases.

Methods: We used data from 452 children participating in a birth cohort study to assess the seasonal patterns of rotavirus diarrhea by creating a weekly time series of rotavirus incidence and fitting a Poisson harmonic regression with biannual peaks. Age and cohort effects were adjusted for by including the weekly counts of number of children in the study and the median age of cohort in a given week. Weekly average temperature, humidity and an interaction term to reflect the joint effect of temperature and humidity were included to consider the effects of meteorological variables.

Results: In the overall rotavirus time series, two significant peaks within a single year were observed--one in winter and the other in summer. The effect of age was found to be the most significant contributor for rotavirus incidence, showing a strong negative association. Seasonality remained a significant factor, even after adjusting for meteorological parameters, and the age and cohort effects.

Conclusions: The methodology for assessing seasonality in cohort studies is not yet developed. This is the first attempt to explore seasonal patterns in a cohort study with a dynamic denominator and rapidly changing immune response on individual and group levels, and provides a highly promising approach for a better understanding of the seasonal patterns of infectious diseases, tracking emergence of pathogenic strains and evaluating the efficacy of intervention programs.


Conflict of interest statement

Competing Interests: The authors have declared that no competing interests exist.

Figures

Figure 1
Figure 1. Needle plot showing the weekly distribution of counts of rotavirus diarrhea during the study period.
Figure 2
Figure 2. Cumulative weekly enrollment, follow-up and ageing of the cohort.
The black line represents the total number of child-weeks of follow-up for each week in the time series. The red line depicts the median age of children (in weeks) corresponding to a particular week in the time-series.
Figure 3
Figure 3. Week-series of incidence of rotavirus diarrhea (per 1000 child-weeks).
The horizontal spikes depict the observed incidence of rotavirus diarrhea among children in the cohort. The blue vertical line depicts the predicted incidence derived from the Poisson harmonic regression model.
Figure 4
Figure 4. Weekly distribution of different rotavirus genotypes.
Observed changes in a relative contribution of rotavirus genotypes indicate temporal clustering characteristic for seasonality in genotype dominance.
Figure 5
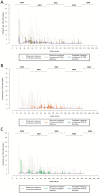
Figure 5. Week-series of incidence of diarrhea (per 1000 child-weeks) due to major rotavirus strains (A) G1P , (B) G2P , (C) G1P .
The colored horizontal spikes (khaki for G1P , orange for G2P and green for G1P [4]) represent the observed strain-specific incidence of rotavirus diarrhea among children in the cohort. The vertical blue line depicts the predicted incidence derived from the Poisson harmonic regression model.
Figure 6
Figure 6. Seasonality of rotavirus diarrhea in Dhaka, Bangladesh (2001–2006) with pronounced biannual peaks.
The horizontal spikes depict the observed monthly values, the red vertical lines represent the smoothed estimates, and the blue vertical lines reflect the predicted counts based on Poisson harmonic regression model with four sine-cosine terms.

References

    1. Chui KK, Jagai JS, Griffiths JK, Naumova EN (2011) Hospitalization of the elderly in the United States for nonspecific gastrointestinal diseases: a search for etiological clues. Am J Public Health 101: 2082–2086. - PMC - PubMed
    1. Fisman DN (2007) Seasonality of infectious diseases. Annu Rev Public Health 28: 127–143. - PubMed
    1. Greene SK, Ionides EL, Wilson ML (2006) Patterns of influenza-associated mortality among US elderly by geographic region and virus subtype, 1968–1998. Am J Epidemiol 163: 316–326. - PubMed
    1. Naumova EN, Jagai JS, Matyas B, DeMaria A Jr, MacNeill IB, et al. (2007) Seasonality in six enterically transmitted diseases and ambient temperature. Epidemiol Infect 135: 281–292. - PMC - PubMed
    1. Moorthy M, Castronovo D, Abraham A, Bhattacharyya S, Gradus S, et al. (2012) Deviations in influenza seasonality: odd coincidence or obscure consequence? Clin Microbiol Infect 18: 955–962. - PMC - PubMed

Publication types