. 2013 Aug 19;8(8):e71704.
doi: 10.1371/journal.pone.0071704. eCollection 2013.

Cerebral blood volume calculated by dynamic susceptibility contrast-enhanced perfusion MR imaging: preliminary correlation study with glioblastoma genetic profiles

Affiliations

Cerebral blood volume calculated by dynamic susceptibility contrast-enhanced perfusion MR imaging: preliminary correlation study with glioblastoma genetic profiles

Inseon Ryoo et al. PLoS One. .

Abstract

Purpose: To evaluate the usefulness of dynamic susceptibility contrast (DSC) enhanced perfusion MR imaging in predicting major genetic alterations in glioblastomas.

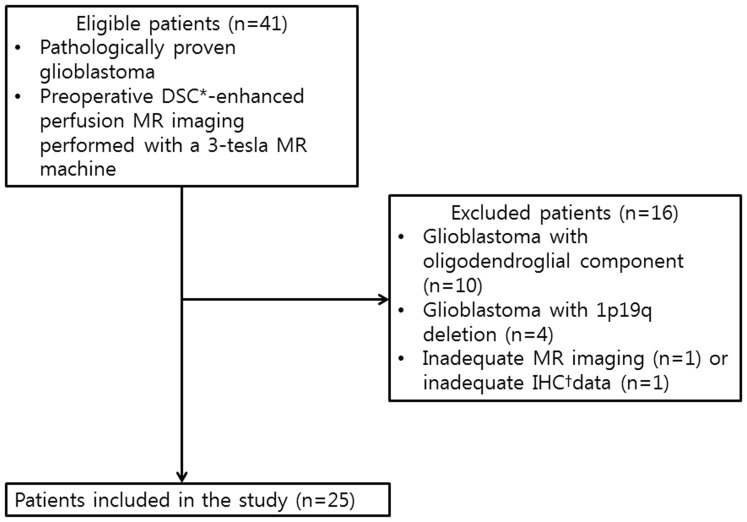
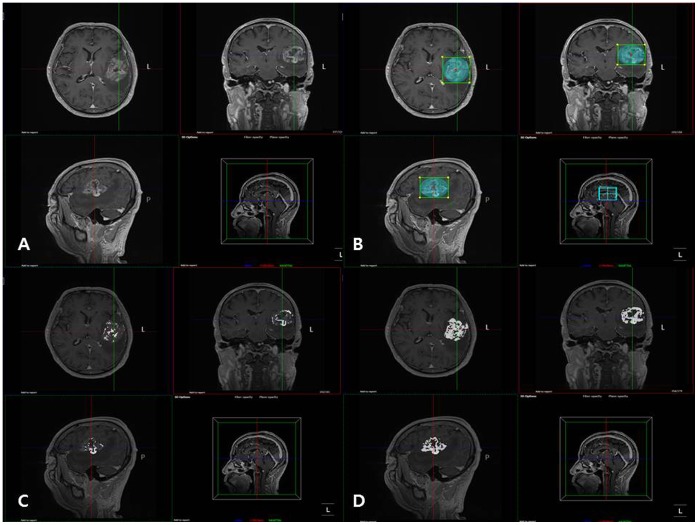
Materials and methods: Twenty-five patients (M:F = 13∶12, mean age: 52.1±15.2 years) with pathologically proven glioblastoma who underwent DSC MR imaging before surgery were included. On DSC MR imaging, the normalized relative tumor blood volume (nTBV) of the enhancing solid portion of each tumor was calculated by using dedicated software (Nordic TumorEX, NordicNeuroLab, Bergen, Norway) that enabled semi-automatic segmentation for each tumor. Five major glioblastoma genetic alterations (epidermal growth factor receptor (EGFR), phosphatase and tensin homologue (PTEN), Ki-67, O6-methylguanine-DNA methyltransferase (MGMT) and p53) were confirmed by immunohistochemistry and analyzed for correlation with the nTBV of each tumor. Statistical analysis was performed using the unpaired Student t test, ROC (receiver operating characteristic) curve analysis and Pearson correlation analysis.

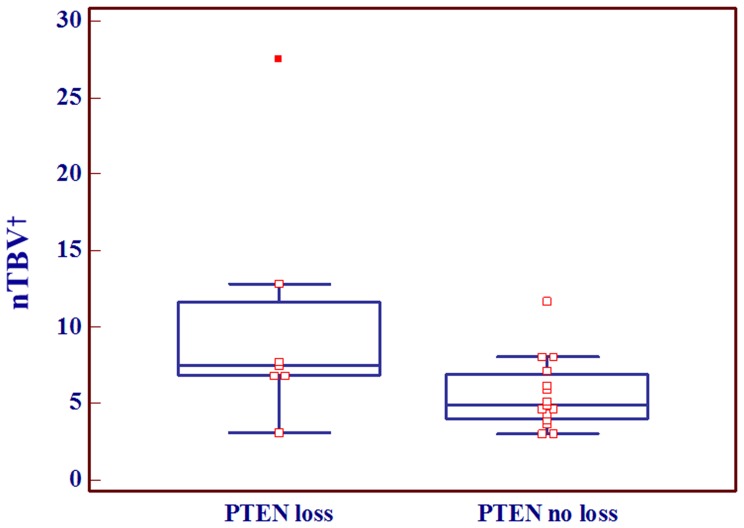
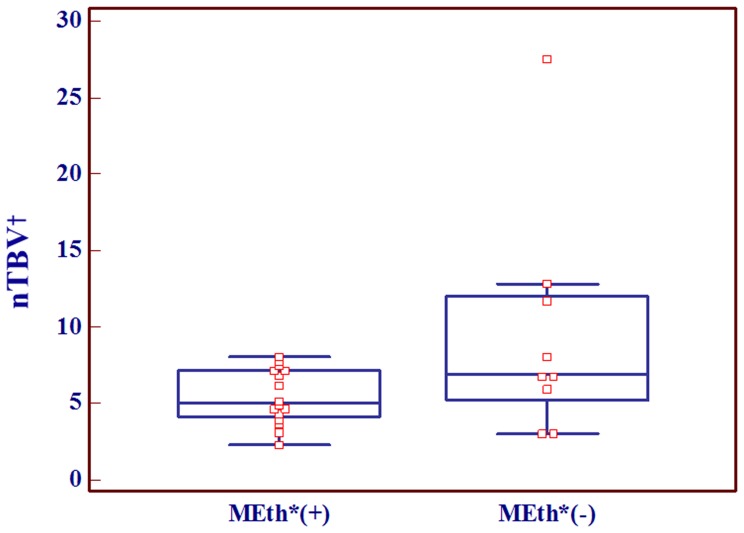
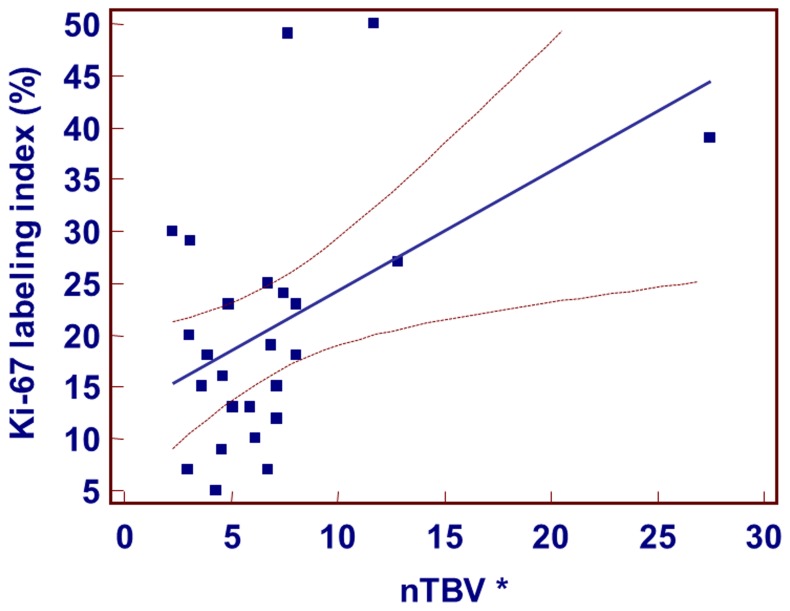
Results: The nTBVs of the MGMT methylation-negative group (mean 9.5±7.5) were significantly higher than those of the MGMT methylation-positive group (mean 5.4±1.8) (p = .046). In the analysis of EGFR expression-positive group, the nTBVs of the subgroup with loss of PTEN gene expression (mean: 10.3±8.1) were also significantly higher than those of the subgroup without loss of PTEN gene expression (mean: 5.6±2.3) (p = .046). Ki-67 labeling index indicated significant positive correlation with the nTBV of the tumor (p = .01).

Conclusion: We found that glioblastomas with aggressive genetic alterations tended to have a high nTBV in the present study. Thus, we believe that DSC-enhanced perfusion MR imaging could be helpful in predicting genetic alterations that are crucial in predicting the prognosis of and selecting tailored treatment for glioblastoma patients.


Conflict of interest statement

Competing Interests: The authors have declared that no competing interests exist.

Figures

Figure 1
Figure 1. Flow diagram of patient selection and inclusion and exclusion criteria.
Note– *DSC: dynamic susceptibility contrast, IHC:immunohistochemistry.
Figure 2
Figure 2. Clustering method was used as a semi-automatic segmentation of glioblastoma.
(A) Contrast-enhanced T1-weighted images were used as structural images. (B) Volume of interest (VOI) was determined by a neuroradiologist. (C, D) VOIs were divided into seven tissue classes according to pixel values and class 6 and 7 were selected as enhancing tumor tissue. (C: class 6, D: class 6 and 7 together).
Figure 3
Figure 3. Box and whisker diagram displaying the relationship between normalized relative tumor blood volume (nTBV) and PTEN expression status in EGFR expression-positive group.
The EGFR expression-positive glioblastomas with PTEN loss showed statistically higher nTBV values than those without PTEN loss. Note– nTBV: normalized relative tumor blood volume.
Figure 4
Figure 4. Box and whisker diagram displaying the relationship between normalized relative tumor blood volume (nTBV) and MGMT promoter methylation status.
The MGMT methylation-positive group showed statistically lower nTBV values than the MGMT methylation-negative group. Note– *MEth: MGMT promoter methylation, nTBV: normalized relative tumor blood volume.
Figure 5
Figure 5. Scatter diagram and regression line display the relationship between nTBV and Ki-67 labeling index.
There was strong positive correlation between the Ki-67 labeling index and nTBV. Note– *nTBV: normalized relative tumor blood volume.
Figure 6
Figure 6. Scatter diagram and regression line display the relationship between nTBV and p53 index.
There was no significant correlation between p53 index and nTBV value. Note– *nTBV: normalized relative tumor blood volume.
Figure 7
Figure 7. Glioblastomas with aggressive genetic profiles show high normalized relative tumor blood volume (nTBV).
(A, B) A 66-year-old woman had glioblastoma with EGFR expression (3+), PTEN loss (+), MGMT methylation (−), and a Ki-67 index of 39%. The tumor showed high nTBV (27.5).(C, D) A 70-year-old man had glioblastoma with EGFR expression (3+), PTEN loss (+), MGMT methylation (−), and a Ki-67 index of 27%. The tumor showed high nTBV (12.84). (A, C) Contrast-enhanced T1-weighted axial image, (B, D) normalized relative cerebral blood volume (nCBV) map overlaid on structural contrast-enhanced T1-weighted axial image.
Figure 8
Figure 8. Glioblastomas with favorable genetic profiles show low normalized relative tumor blood volume (nTBV).
(A, B) A 67-year-old man had glioblastoma with EGFR expression (2+), PTEN loss (−), MGMT methylation (+), and a Ki-67 index of 5%. The tumor showed low nTBV (4.3). (C, D) A 36-year-old woman had glioblastoma with EGFR expression (+), PTEN loss (−), MGMT methylation (+), and a Ki-67 index of 9%. The tumor showed low nTBV (4.59) (A, C) Contrast-enhanced T1-weighted axial image, (B, D) normalized relative cerebral blood volume (nCBV) map overlaid on structural contrast-enhanced T1-weighted axial image.

References

    1. Van Meir EG, Hadjipanayis CG, Norden AD, Shu HK, Wen PY, et al. (2010) Exciting new advances in neuro-oncology: the avenue to a cure for malignant glioma. CA Cancer J Clin 60: 166–193. - PMC - PubMed
    1. Jackson RJ, Fuller GN, Abi-Said D, Lang FF, Gokaslan ZL, et al. (2001) Limitations of stereotactic biopsy in the initial management of gliomas. Neuro Oncol 3: 193–200. - PMC - PubMed
    1. Tykocinski ES, Grant RA, Kapoor GS, Krejza J, Bohman LE, et al. (2012) Use of magnetic perfusion-weighted imaging to determine epidermal growth factor receptor variant III expression in glioblastoma. Neuro Oncol 14: 613–623. - PMC - PubMed
    1. Diehn M, Nardini C, Wang DS, McGovern S, Jayaraman M, et al. (2008) Identification of noninvasive imaging surrogates for brain tumor gene-expression modules. Proc Natl Acad Sci U S A 105: 5213–5218. - PMC - PubMed
    1. Mellinghoff IK, Wang MY, Vivanco I, Haas-Kogan DA, Zhu S, et al. (2005) Molecular determinants of the response of glioblastomas to EGFR kinase inhibitors. N Engl J Med 353: 2012–2024. - PubMed

Publication types

MeSH terms