. 2013 Aug 20;8(8):e71739.
doi: 10.1371/journal.pone.0071739. eCollection 2013.

Raman spectroscopic imaging of the whole Ciona intestinalis embryo during development

Affiliations

Raman spectroscopic imaging of the whole Ciona intestinalis embryo during development

Mitsuru J Nakamura et al. PLoS One. .

Abstract

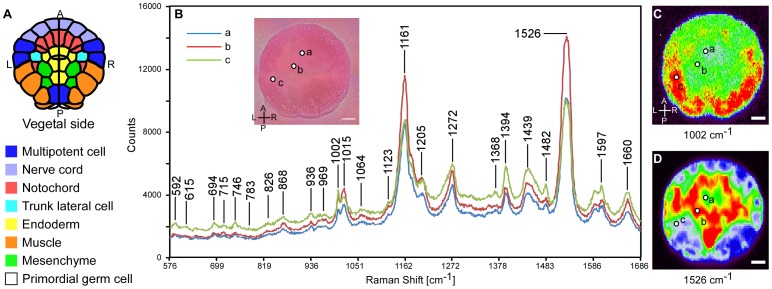
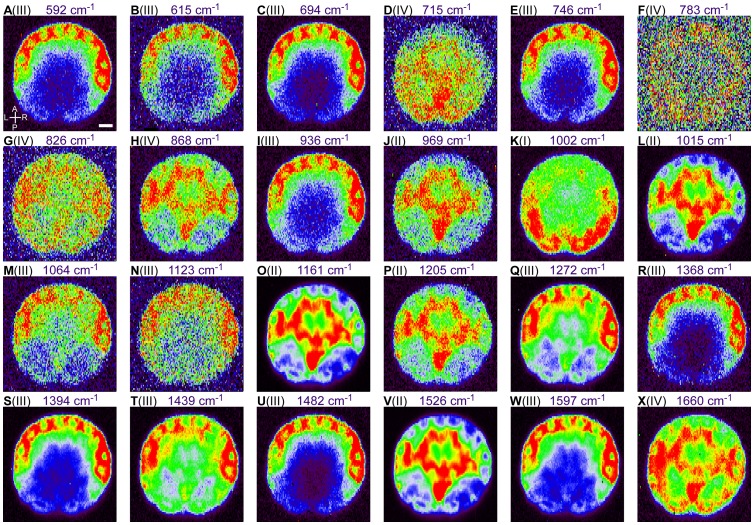
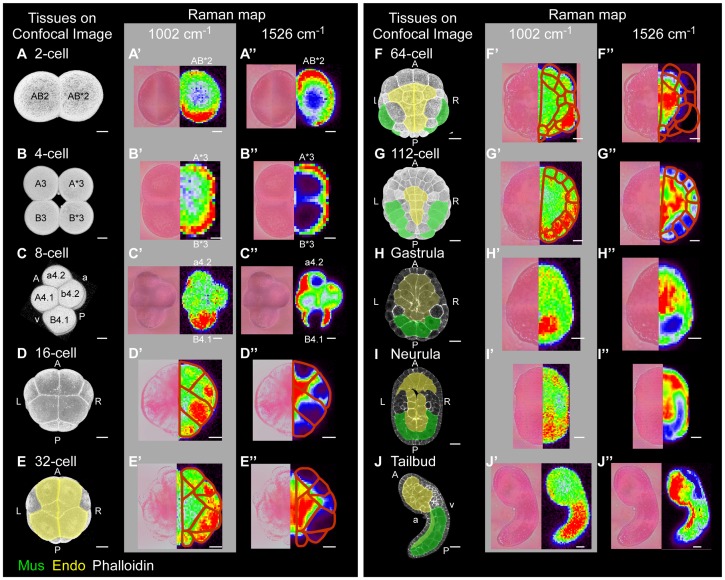
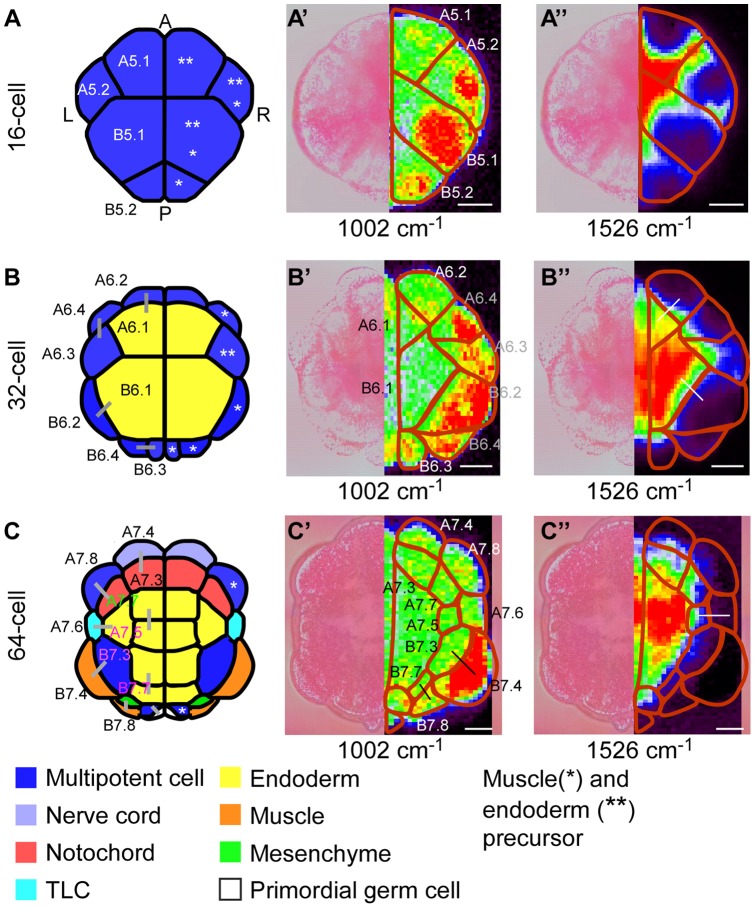
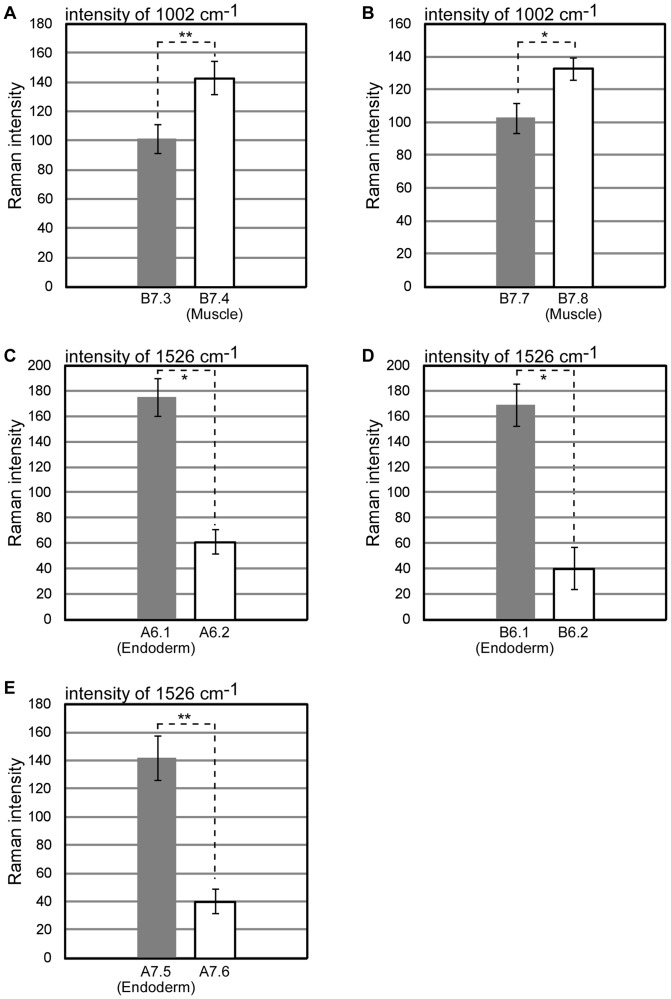
Intracellular composition and the distribution of bio-molecules play central roles in the specification of cell fates and morphogenesis during embryogenesis. Consequently, investigation of changes in the expression and distribution of bio-molecules, especially mRNAs and proteins, is an important challenge in developmental biology. Raman spectroscopic imaging, a non-invasive and label-free technique, allows simultaneous imaging of the intracellular composition and distribution of multiple bio-molecules. In this study, we explored the application of Raman spectroscopic imaging in the whole Ciona intestinalis embryo during development. Analysis of Raman spectra scattered from C. intestinalis embryos revealed a number of localized patterns of high Raman intensity within the embryo. Based on the observed distribution of bio-molecules, we succeeded in identifying the location and structure of differentiated muscle and endoderm within the whole embryo, up to the tailbud stage, in a label-free manner. Furthermore, during cell differentiation, we detected significant differences in cell state between muscle/endoderm daughter cells and daughter cells with other fates that had divided from the same mother cells; this was achieved by focusing on the Raman intensity of single Raman bands at 1002 or 1526 cm(-1), respectively. This study reports the first application of Raman spectroscopic imaging to the study of identifying and characterizing differentiating tissues in a whole chordate embryo. Our results suggest that Raman spectroscopic imaging is a feasible label-free technique for investigating the developmental process of the whole embryo of C. intestinalis.


Conflict of interest statement

Competing Interests: The authors have declared that no competing interests exist.

Figures

Figure 1
Figure 1. Raman spectra obtained from C. intestinalis embryo at the 112-cell stage.
(A) Diagram of the C. intestinalis embryo from vegetal view. Each color in the diagram represents a distinguishable cell fate. (B) Raman spectra from three different spots (a, b and c in the inset bright-field image) in a 112-cell stage C. intestinalis embryo stained with CellMask. Numbers indicate the Raman band positions. Raman maps in Fig. 2 were generated from the corresponding Raman bands indicated by each latter and band position. (C and D) Raman maps constructed from the intensities of the individual Raman bands in the 998–1007 (C) and 1499–1552 (D) cm−1 range. The colors depict the Raman intensity of a given spectrum: where red represents the maximum intensity and black represents zero intensity. Abbreviations: A, Anterior; P, Posterior; L, Left; R, Right. Scale bar: 20 μm.
Figure 2
Figure 2. Raman maps generated from each individual Raman band of a 112-cell stage C. intestinalis embryo.
(A–X) Image panels displaying Raman maps of the 112-cell stage C. intestinalis embryo stained with CellMask in a rainbow scale with red representing the highest intensity and black representing the lowest. These maps were constructed based on the intensity of each individual Raman band indicated above. Maps were classified into four groups (I–IV) as described in the Results and Discussion. Roman numerals (I–IV) represent the group into which each Raman map was classified. Abbreviations: A, Anterior; P, Posterior; L, Left; R, Right. Scale bar: 20 μm.
Figure 3
Figure 3. Raman maps of C. intestinalis embryos from 2-cell to tailbud stage.
(A–J) Confocal 3D (from 2-cell to 112-cell stages) and section images from dorsal (gastrula and neurula stages) or side views (tailbud stage) of C. intestinalis embryos stained with phalloidin (white). Images show the location of differentiated muscle (green) and endoderm (yellow) within the embryo. (A’ –J’ and A’’ –J’’) Bright-field (left) and Raman maps in a rainbow scale (right) constructed from the intensity of single bands at the 1002 (A’ –J’) and 1526 (A’’ –J’’) cm−1 at each stage. Because the C. intestinalis embryo is bilaterally symmetrical, Raman maps of only half of the embryo are represented. Red line in maps from 16-cell to 112-cell stage represents the presumed cell border. To identify the cell boundary, the bright-field images and Raman maps constructed from Raman bands of CellMask (group III) were used. In addition to the Raman band at 1526 cm−1, Raman maps constructed from other bands of group II (Fig. 2 and Table 1) also represented similar distribution of high-intensity spots (see Fig. S3). Abbreviations: A, Anterior; P, Posterior; L, Left; R, Right; a, animal; v, vegetal; Mus, muscle; Endo, endoderm. Scale bar: 20 μm.
Figure 4
Figure 4. Localized distribution of Raman intensity during cell differentiation process.
Vegetal views of the embryo at each stage. 16-cell (A–A’’). 32-cell (B–B’’) and 64-cell (C–C’’). (A–C) Diagrams with cell lineage and fate information. Cell fates of each blastomere are indicated by different colors in the diagrams. Pairs of daughter cells are indicated by gray lines. (A’ –C’ and A’’ –C’’) Raman maps generated from the intensity of single Raman bands at 1002 (A’ –C’) and 1526 (A’’ –C’’) cm−1. Bright-field images (left) are represented with Raman maps (right). A portion of presumed cell border is indicated by red line. This cell border was determined from the bright-field images and Raman maps of group III. Daughter cell pairs in which, one daughter produced differentiated muscle (black line, C’)/endoderm (white line, B’’ and C’’) and another daughter produced other fate cells are indicated by each line within the embryo. Abbreviations: A, Anterior; L, Left; P, Posterior; R, Right; Scale bar. 20 μm.
Figure 5
Figure 5. Quantitative difference in Raman intensity between differentiated muscle/endoderm and daughter cells with other fates.
(A–E) Raman intensities of A6.1, A6.2, B6.1, and B6.2 blastomeres, were acquired from 32-cell stage embryo (four individuals), and intensities of A7.5, A7.6, B7.3, B7.4, B7.7 and B7.8 blastomeres were acquired from 64-cell stage embryos (five individuals). Cell fate and embryonic location of each blastomere are shown in Fig. 4. Student's t-test results show significant differences for the intensities of Raman bands at 1002 (A and B) and 1526 (C–E) cm−1 in Raman spectra of differentiated muscle/endoderm and other fate daughter cells (*p<0.005, **p<0.001). Error bars represent the standard error of the mean (SEM).

References

    1. Das RS, Agrawal YK (2011) Raman spectroscopy: Recent advancements, techniques and applications. Vibrational Spectroscopy 57: 163–176.
    1. McNay G, Eustace D, Smith WE, Faulds K, Graham D (2011) Surface-enhanced Raman scattering (SERS) and surface-enhanced resonance Raman scattering (SERRS): a review of applications. Applied spectroscopy 65: 825–837. - PubMed
    1. Downes A, Elfick A (2010) Raman spectroscopy and related techniques in biomedicine. Sensors 10: 1871–1889. - PMC - PubMed
    1. Krafft C, Knetschke T, Funk RHW, Salzer R (2006) Studies on stress-induced changes at the subcellular level by Raman microspectroscopic mapping. Analytical chemistry 78: 4424–4429. - PubMed
    1. Huang C-K, Ando M, Hamaguchi H, Shigeto S (2012) Disentangling dynamic changes of multiple cellular components during the yeast cell cycle by in vivo multivariate Raman imaging. Analytical chemistry 84: 5661–5668. - PubMed

Publication types

LinkOut - more resources