. 2013 Aug 19;8(8):e71806.
doi: 10.1371/journal.pone.0071806. eCollection 2013.

Fungi of the murine gut: episodic variation and proliferation during antibiotic treatment

Affiliations

Fungi of the murine gut: episodic variation and proliferation during antibiotic treatment

Serena Dollive et al. PLoS One. .

Abstract

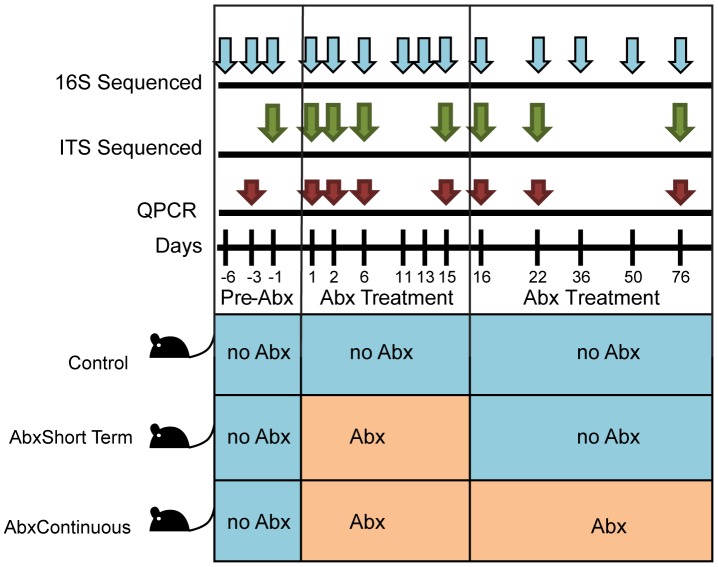
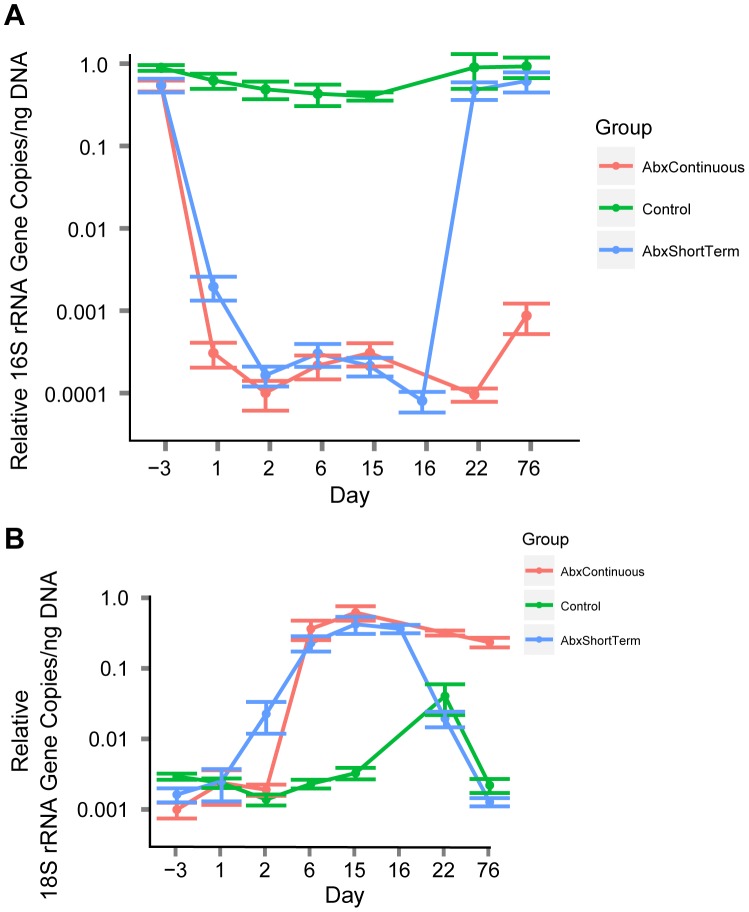
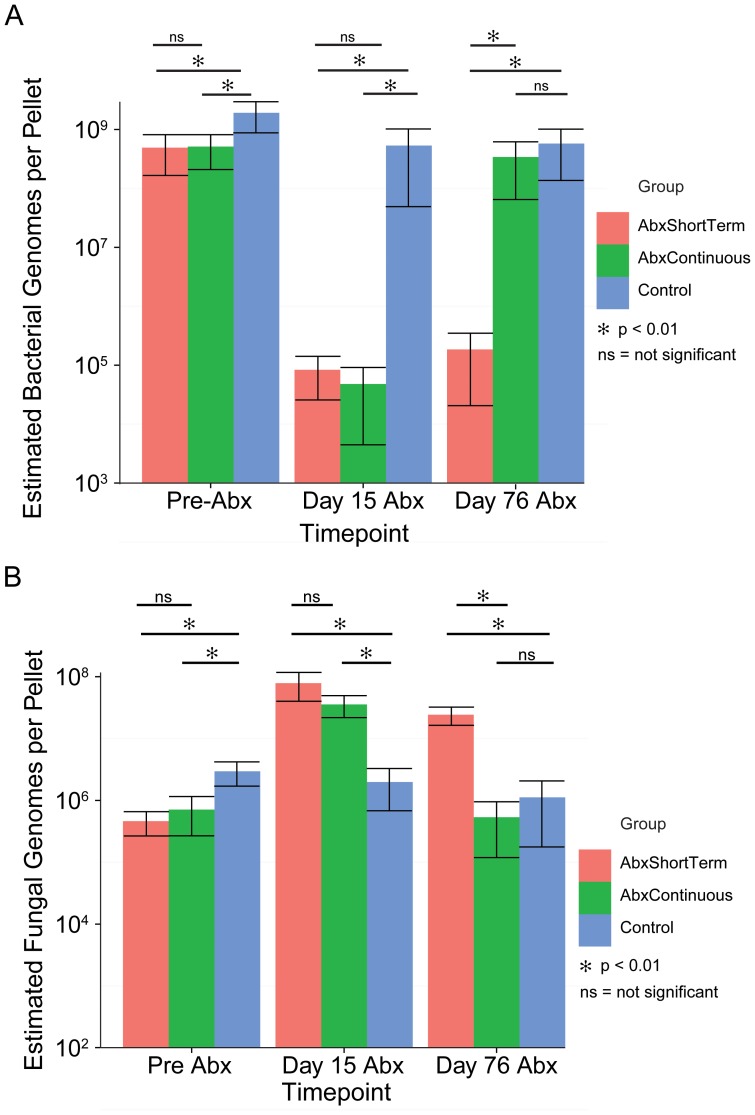
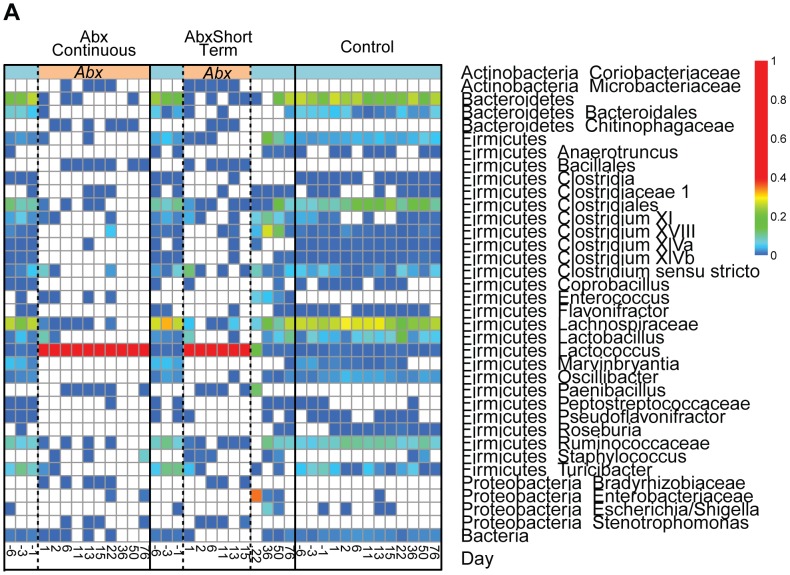
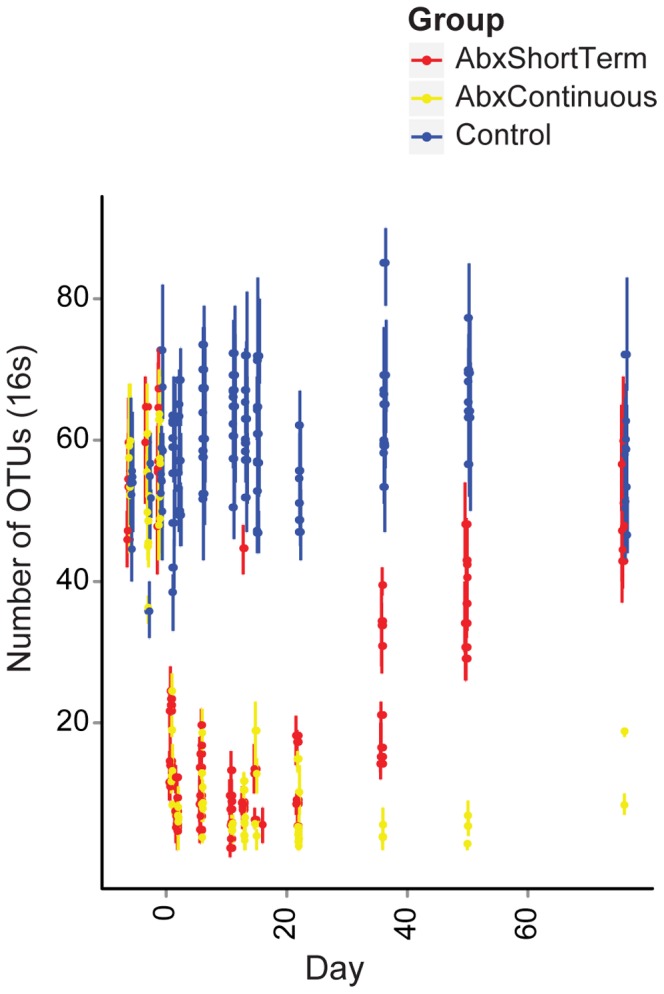
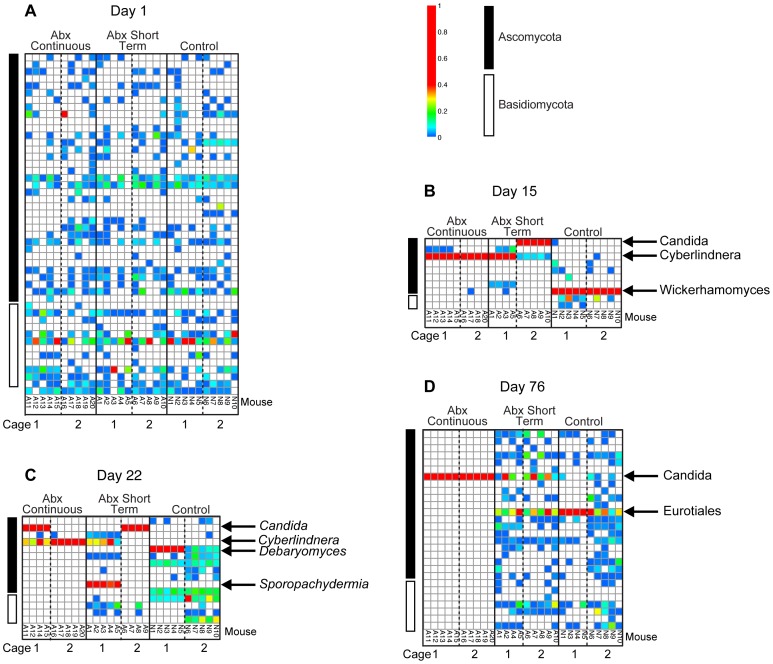
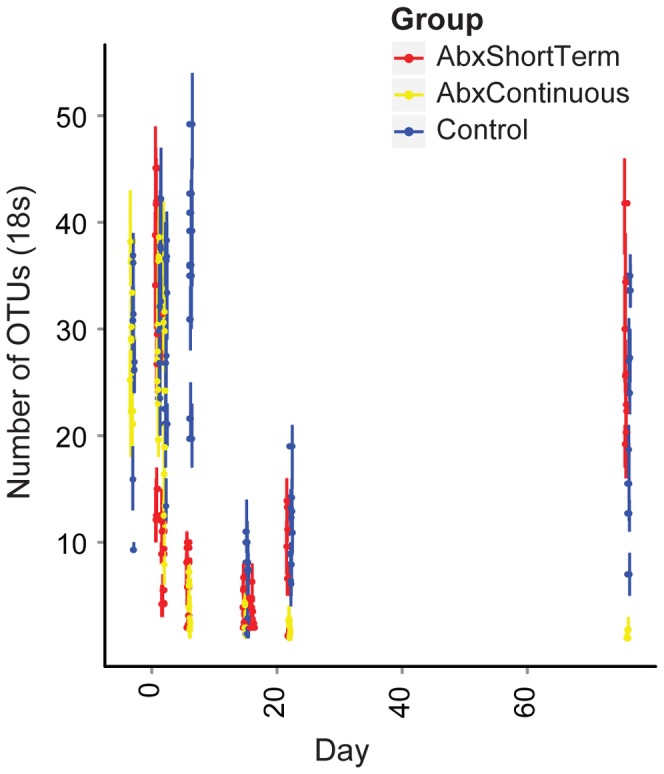
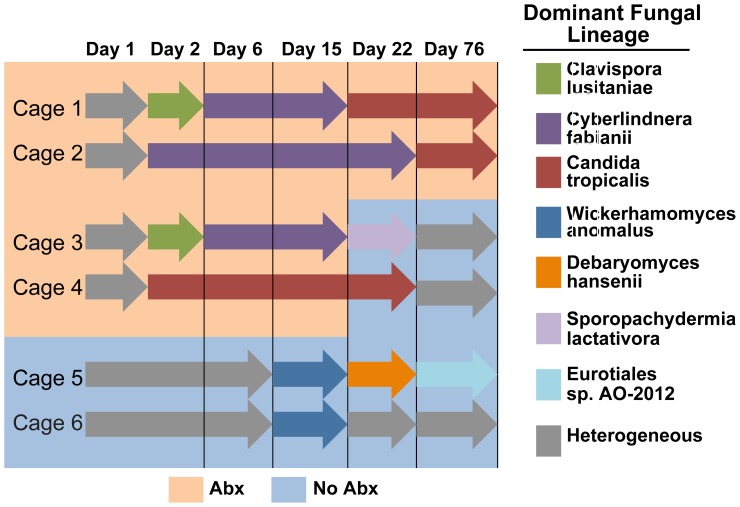
Antibiotic use in humans has been associated with outgrowth of fungi. Here we used a murine model to investigate the gut microbiome over 76 days of treatment with vancomycin, ampicillin, neomycin, and metronidazole and subsequent recovery. Mouse stool was studied as a surrogate for the microbiota of the lower gastrointestinal tract. The abundance of fungi and bacteria was measured using quantitative PCR, and the proportional composition of the communities quantified using 454/Roche pyrosequencing of rRNA gene tags. Prior to treatment, bacteria outnumbered fungi by >3 orders of magnitude. Upon antibiotic treatment, bacteria dropped in abundance >3 orders of magnitude, so that the predominant 16S sequences detected became transients derived from food. Upon cessation of treatment, bacterial communities mostly returned to their previous numbers and types after 8 weeks, though communities remained detectably different from untreated controls. Fungal communities varied substantially over time, even in the untreated controls. Separate cages within the same treatment group showed radical differences, but mice within a cage generally behaved similarly. Fungi increased ∼40-fold in abundance upon antibiotic treatment but declined back to their original abundance after cessation of treatment. At the last time point, Candida remained more abundant than prior to treatment. These data show that 1) gut fungal populations change radically during normal mouse husbandry, 2) fungi grow out in the gut upon suppression of bacterial communities with antibiotics, and 3) perturbations due to antibiotics persist long term in both the fungal and bacterial microbiota.


Conflict of interest statement

Competing Interests: The authors have declared that no competing interests exist.

Figures

Figure 1
Figure 1. Diagram of the experiment.
The time line for the 76 days of sample collection is shown along the top, and the periods of antibiotic treatment are shown at the bottom. Antibiotic treatment was initiated at time zero.
Figure 2
Figure 2. Relative microbial abundance inferred from QPCR.
A) Longitudinal analysis of 16S rRNA gene copies per ng of stool DNA. The groups of mice tested are shown by the color code (key at right). Error bars indicate standard error. B) Longitudinal analysis of 18S rRNA gene copies per ng of stool DNA. The groups of mice tested are shown by the color code (key at right). Error bars indicate standard error. The amplicon used was designed to suppress amplification of DNA from mouse or food materials.
Figure 3
Figure 3. Numbers of organisms per stool pellet.
Values from QPCR were corrected to yield an estimate of the true numbers of organisms by accounting for differential DNA yield, numbers of rRNA gene copies per genome, and efficiency of detection. A) Estimated numbers of bacterial genomes per pellet. Note that during antibiotic treatment (Day 15), most of the 16S rRNA gene copies were derived from food and do not correspond to intact organisms. (B) Estimated numbers of fungal genomes per pellet. The x-axis shows the time point studied, and the y-axis shows the inferred numbers of genomes. Each study group is indicated by the color code to the right of the figure panels.
Figure 4
Figure 4. Longitudinal analysis of bacterial lineages inferred from 16S rRNA gene sequencing.
Bacterial lineages detected are summarized in heat map format. Each column shows the average for the ten mice in each group and at the time point indicated. Sequence samples were rarefied to a standard 200 reads per individual before averaging. The periods of antibiotic treatment are indicated at the top in salmon color, the periods off antibiotic by light blue. The day of treatment is indicated at the bottom. The color code to the right indicates the proportions.
Figure 5
Figure 5. Abundance analysis of observed bacterial lineages.
Each sequence set for each animal was rarefied to 200 sequences per sample 10 times, and the number of different OTUs assessed. Means are indicated by points, error bars indicate the range observed. The groups studied are indicated by the key at the right.
Figure 6
Figure 6. Longitudinal analysis of fungal lineages inferred from ITS rRNA gene sequencing.
Fungal lineages detected are summarized in heat map format. Data for four days are shown (days 1, 15, 22, and 76). Each column indicates a single mouse. The groups tested are indicated at the top of the columns. The ten mice in each of the three treatment groups were each housed in two cages of five each. The distribution of mice in cages is indicated at the bottom of the columns. The day of treatment is indicated at the top. The color codes at the top right indicate the proportions and Phyla of origin.
Figure 7
Figure 7. Abundance analysis of observed fungal lineages.
Each sequence set was rarefied to 200 sequences per sample, and the number of different OTUs assessed. Means are indicated by points, error bars indicate the range observed. The groups studied are indicated by the key at the right.
Figure 8
Figure 8. Longitudinal variation in fungal abundance in the six cages studied.
Each cage is shown as a row labeled at left, the types of fungi detected are shown at the right. The background shading indicates the presence or absence of antibiotics (key at bottom).

References

    1. Chen KY, Ko SC, Hsueh PR, Luh KT, Yang PC (2001) Pulmonary fungal infection: emphasis on microbiological spectra, patient outcome, and prognostic factors. Chest 120: 177–184. - PubMed
    1. Samonis G, Gikas A, Anaissie EJ, Vrenzos G, Maraki S, et al. (1993) Prospective evaluation of effects of broad-spectrum antibiotics on gastrointestinal yeast colonization of humans. Antimicrobial agents and chemotherapy 37: 51–53. - PMC - PubMed
    1. Mulligan ME, Citron DM, McNamara BT, Finegold SM (1982) Impact of cefoperazone therapy on fecal flora. Antimicrobial agents and chemotherapy 22: 226–230. - PMC - PubMed
    1. Abbott J (1995) Clinical and microscopic diagnosis of vaginal yeast infection: a prospective analysis. Annals of emergency medicine 25: 587–591. - PubMed
    1. Oksala E (1990) Factors predisposing to oral yeast infections. Acta odontologica Scandinavica 48: 71–74. - PubMed

Publication types

MeSH terms