

Relationships of disability with age among adults aged 50 to 85: evidence from the United States, England and continental europe
- PMID: 23977172
- PMCID: PMC3743762
- DOI: 10.1371/journal.pone.0071893
Relationships of disability with age among adults aged 50 to 85: evidence from the United States, England and continental europe
Abstract
Objectives: To extend existing research on the US health disadvantage relative to Europe by studying the relationships of disability with age from midlife to old age in the US and four European regions (England/Northern and Western Europe/Southern Europe/Eastern Europe) including their wealth-related differences, using a flexible statistical approach to model the age-functions.
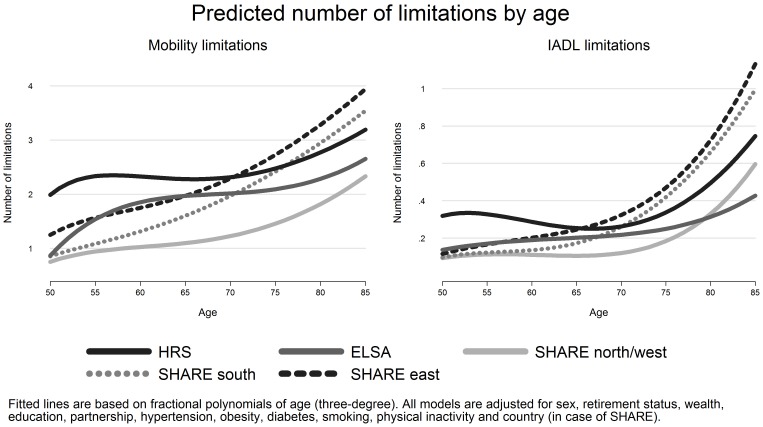
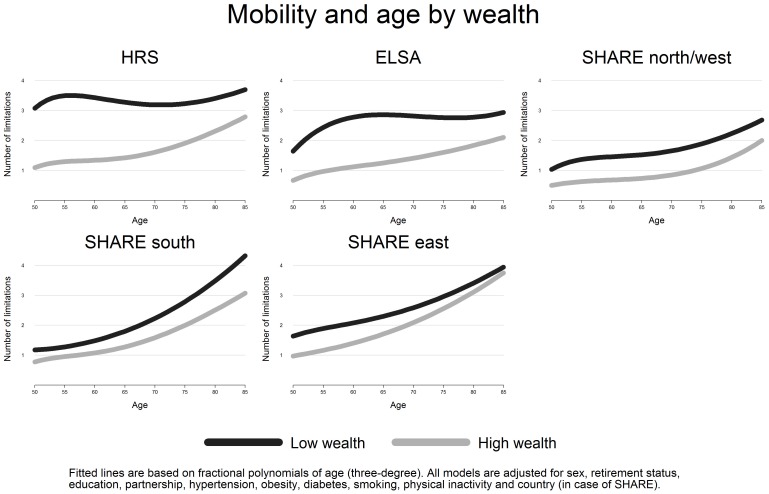
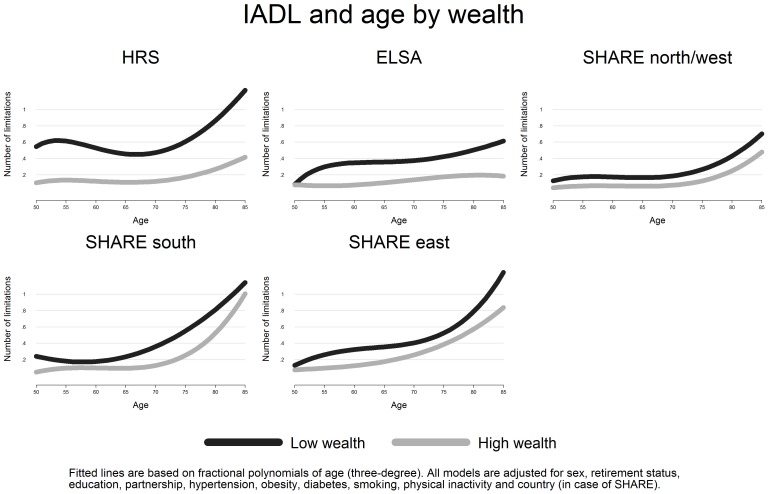
Methods: We used data from three studies on aging, with nationally representative samples of adults aged 50 to 85 from 15 countries (N = 48225): the US-American Health and Retirement Study (HRS), the English Longitudinal Study of Ageing (ELSA) and the Survey of Health, Ageing and Retirement in Europe (SHARE). Outcomes were mobility limitations and limitations in instrumental activities of daily living. We applied fractional polynomials of age to determine best fitting functional forms for age on disability in each region, while controlling for socio-demographic characteristics and important risk factors (hypertension, diabetes, obesity, smoking, physical inactivity).
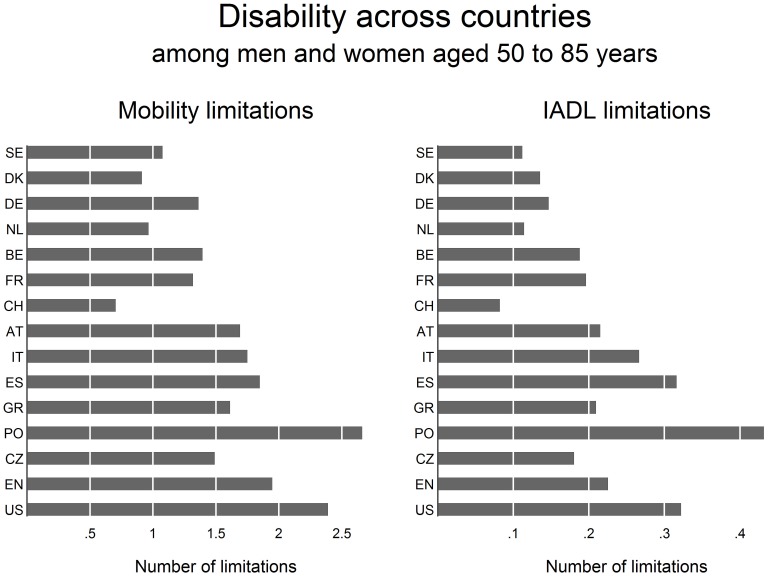
Results: Findings showed high levels of disability in the US with small age-related changes between 50 and 85. Levels of disability were generally lower in Eastern Europe, followed by England and Southern Europe and lowest in Northern and Western Europe. In these latter countries age-related increases of disability, though, were steeper than in the US, especially in Eastern and Southern Europe. For all countries and at all ages, disability levels were higher among adults with low wealth compared to those with high wealth, with largest wealth-related differences among those in early old age in the USA.
Conclusions: This paper illustrates considerable variations of disability and its relationship with age. It supports the hypothesis that less developed social policies and more pronounced socioeconomic inequalities are related to higher levels of disability and an earlier onset of disability.
Conflict of interest statement
Figures
References
-
- Wang BW, Ramey DR, Schettler JD, Hubert HB, Fries JF (2002) Postponed development of disability in elderly runners: a 13-year longitudinal study. Arch Intern Med 162: 2285–2294. - PubMed
-
- Vita AJ, Terry RB, Hubert HB, Fries JF (1998) Aging, health risks, and cumulative disability. N Engl J Med 338: 1035–1041. - PubMed
Publication types
MeSH terms
Grants and funding
LinkOut - more resources
Full Text Sources
Other Literature Sources
Medical
