. 2013 Aug 20;8(8):e72822.
doi: 10.1371/journal.pone.0072822. eCollection 2013.

Limited TCF7L2 expression in MS lesions

Affiliations

Limited TCF7L2 expression in MS lesions

Alexander Lürbke et al. PLoS One. .

Abstract

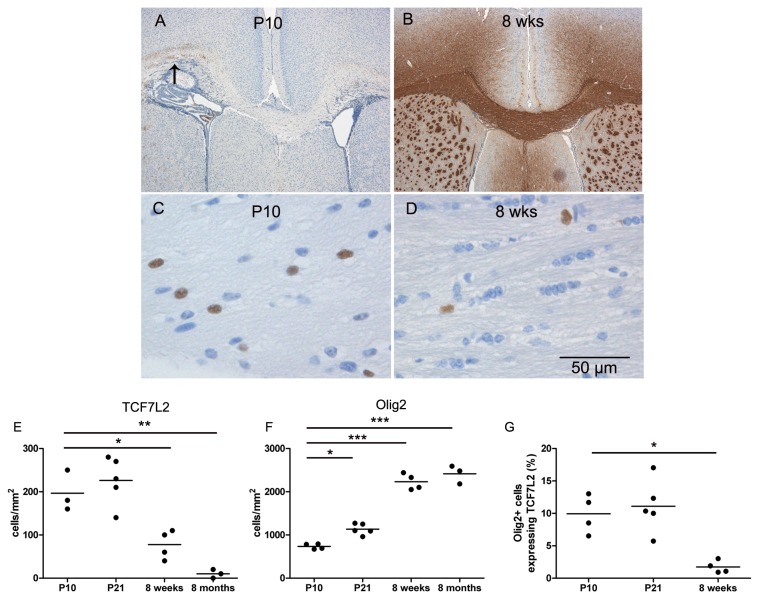
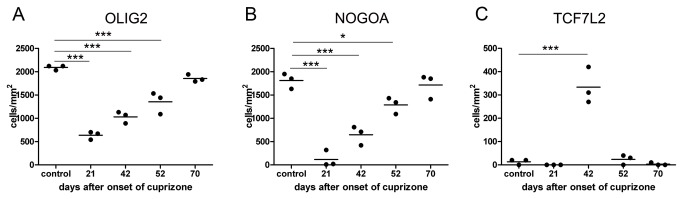
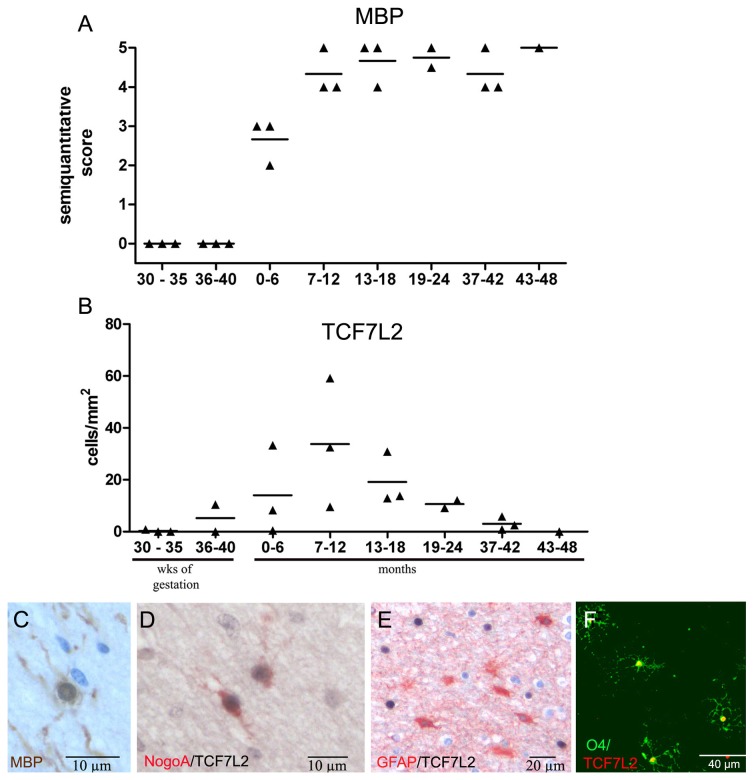
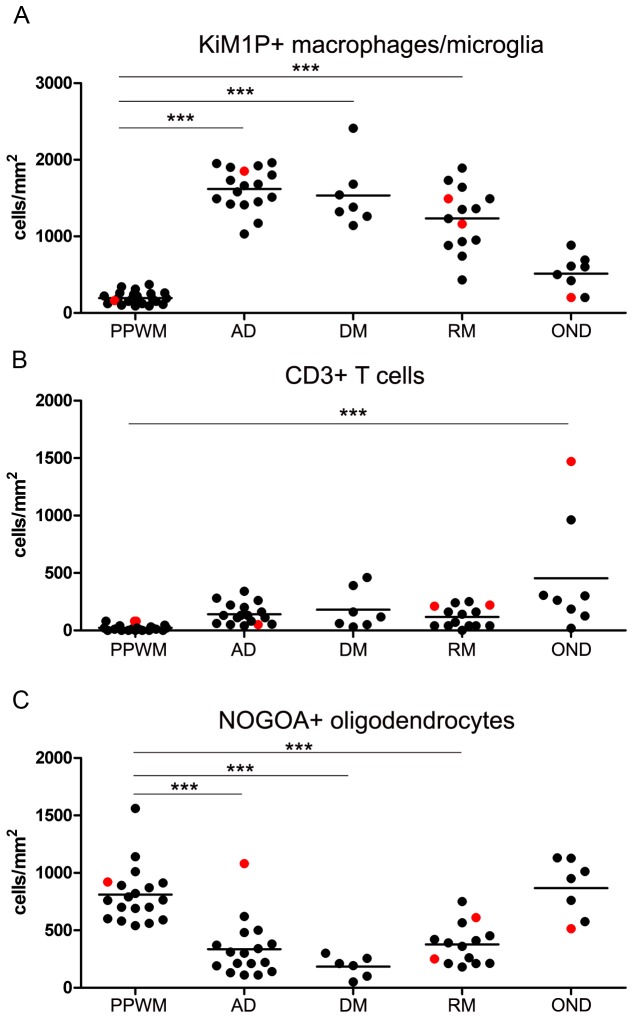
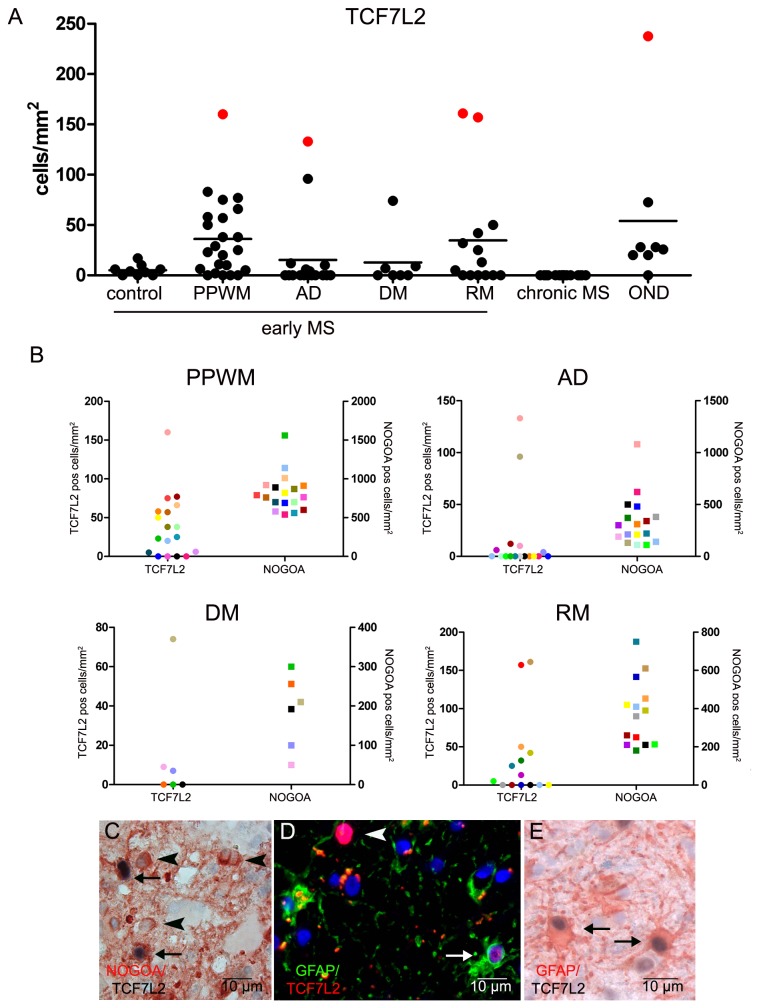
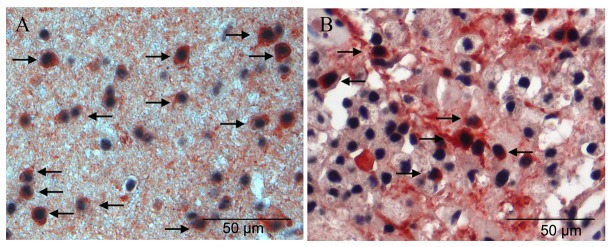
Multiple sclerosis is the most frequent demyelinating disease in the human CNS characterized by inflammation, demyelination, relative axonal loss and gliosis. Remyelination occurs, but is frequently absent or restricted to a small remyelinated rim at the lesion border. Impaired differentiation of oligodendroglial precursor cells is one factor contributing to limited remyelination, especially in chronic MS. TCF7L2 is an oligodendroglial transcription factor regulating myelin gene expression during developmental myelination as well as remyelination. TCF7L2 binds to co-effectors such as β-catenin or histone deacetylases and thereby activates or inhibits the transcription of downstream genes involved in oligodendroglial differentiation. To determine whether TCF7L2 can be used as a marker for differentiating or myelinating oligodendrocytes, we analyzed the expression patterns of TCF7L2 during myelination and remyelination in human and murine CNS tissue samples. Here, we demonstrate that marked expression of TCF7L2 in oligodendrocytes is restricted to a well defined time period during developmental myelination in human and mouse CNS tissue samples. In demyelinating diseases, such as multiple sclerosis, TCF7L2 is reexpressed in oligodendrocytes in a subset of MS patients, but is also present in tissue samples from patients with non-demyelinating, inflammatory diseases. Furthermore, TCF7L2 expression was also detected in astrocytes. HDAC2, a potential binding partner of TCF7L2 that promotes oligodendroglial differentiation and myelination, is expressed in the majority of oligodendrocytes in controls and MS tissue samples. In summary, our data demonstrate that the expression of TCF7L2 in oligodendrocytes is limited to a certain differentiation stage; however the expression of TCF7L2 is neither restricted to the oligodendroglial lineage nor to (re-)myelinating conditions.


Conflict of interest statement

Competing Interests: The autthors have declared that no competing interests exist.

Figures

Figure 1
Figure 1. Expression of TCF7L2 during myelination in the CNS of mice.
At P10 single myelinated axons are observed in the lateral parts of the corpus callosum (arrow) (A) whereas in adult mice myelination is complete (B). High numbers of TCF7L2 expressing cells were observed in P10 mice (C), but only few TCF7L2-positive cells were found in adult mice (D) as quantified in the diagrams (E and F). The percentage of OLIG2 positive cells expressing TCF7L2 decreased significantly in adult mice (G).
Figure 2
Figure 2. Expression of TCF7L2 during remyelination in the CNS of mice.
Mice were fed with 0.25% cuprizone for six weeks and the numbers of oligodendroglial lineage cells were quantified at the indicated time points. Lowest numbers of OLIG2 positive cells were observed 21 days after onset of cuprizone diet; the increased numbers at the end of the cuprizone diet (at 42 days) suggest a recruitment of OPCs during ongoing demyelination (A). NOGOA is expressed by mature oligodendrocytes; lowest numbers of NOGOA positive cells were as well found at day 21 (B). High numbers of TCF7L2 expressing cells were only detected at day 42 (C).
Figure 3
Figure 3. Myelination and expression of TCF7L2 in the human CNS.
The extent of myelination in human frontal lobes was quantified using a semiquantitative score. Between 30 and 40 weeks of gestation no MBP-positive axons were found. Myelination became first obvious between 0 and 6 months after birth (A). First TCF7L2-positive cells were detected at the end of gestation with maximal numbers between 7 and 12 months after birth. Afterwards, the numbers of TCF7L2-positive cells decreased quickly (B). At 6 months after birth numerous myelinating oligodendrocytes were observed (immunohistochemistry for MBP) (C). Many TCF7L2 positive cells also expressed NOGOA (double immunohistochemistry for NogoA (red) and TCF7L2 (black) (D) but not GFAP (double immunohistochemistry for TCF7L2 (black) and GFAP (red)) (E). TCF7L2 was also expressed in human fetal oligodendrocytes in vitro (green O4, red TCF7L2) (F).
Figure 4
Figure 4. Quantification of macrophages/microglia, T cells, and oligodendrocytes in inflammatory demyelinating and non-demyelinating human CNS diseases.
Tissue samples from patients with early MS and non-demyelinating inflammatory diseases were stained for macrophages/microglia (anti-KiM1P), T cells (anti-CD3) and oligodendrocytes (anti-NOGOA). Numbers of macrophages/microglia were significantly increased in all lesion areas compared to PPWM (A). T cells were highest in patients with inflammatory, non-demyelinating CNS diseases (B). Oligodendrocytes were significantly decreased in all MS lesion areas (C). The red dots (A to C) indicate tissue samples with high numbers of TCF7L2 expressing cells (see Figure 5); however no obvious difference between these tissue samples and the others were observed with respect to macrophages, T cells and oligodendrocytes. PPWM = periplaque white matter, AD = actively demyelinating, DM = demyelinated, RM = remyelinating/remyelinated, OND = other inflammatory neurological diseases.
Figure 5
Figure 5. Expression of TCF7L2 in MS lesions and non-demyelinating inflammatory CNS diseases.
In a subset of early MS lesions increased numbers of TCF7L2 positive cells were detected in the periplaque white matter and in remyelinating lesion areas. However, also in other inflammatory neurological diseases (OND) TCF7L2 positive cells were present. Red dots indicate a subset of tissue samples with high numbers of TCF7L2 expressing cells (see Figure 4) (A). There was no correlation between numbers of TCF7L2 and NOGOA positive cells in the different MS lesion areas. NOGOA positive oligodendrocytes and TCF7L2 expressing cells were quantified in periplaque white matter (PPWM), actively demyelinating (AD), demyelinated (DM) and remyelinating (RM) lesion areas; TCF7L2 expressing cells (dots) and NOGOA expressing cells (squares) from the same lesion area are labelled in the same colour (B). Double stainings revealed that a subset of TCF7L2 positive cells were NOGOA positive oligodendrocytes (arrows). TCF7L2 negative oligodendrocytes are indicated by arrow heads (Double immunohistochemistry for NOGOA (red) and TCF7L2 (black) (C). In inflammatory non demyelinating disease TCF7L2 positive oligodendrocytes and astrocytes were detected (D and E). In D a GFAP and TCF7L2 positive astrocyte (arrow) as well as a GFAP negative TCF7L2 positive cell (arrow head) are depicted (double immunohistochemistry for GFAP (green) and TCF7L2 (red). Additional GFAP and TCF7L2 positive cells are shown in E (arrows) (double immunohistochemistry for GFAP (red) and TCF7L2 (black)).
Figure 6
Figure 6. Expression of HDAC2 in MS lesions and control tissue samples.
In control tissue samples (A) as well as in MS lesions (B) numerous NOGOA positive oligodendrocytes were seen which express abundantly HDAC2 (arrows) (double immunohistochemistry for NOGOA (red) and HDAC2 (black)).

Similar articles

Cited by

References

    1. Trapp BD, Peterson J, Ransohoff RM, Rudick R, Mörk S et al. (1998) Axonal transection in the lesions of multiple sclerosis. N Engl J Med 338: 278-285. doi:10.1056/NEJM199801293380502. PubMed: 9445407. - DOI - PubMed
    1. Trapp BD, Ransohoff R, Rudick R (1999) Axonal pathology in multiple sclerosis: relationship to neurologic disability. Curr Opin Neurol 12: 295-302. doi:10.1097/00019052-199906000-00008. PubMed: 10499174. - DOI - PubMed
    1. Ferguson B, Matyszak MK, Esiri MM, Perry VH (1997) Axonal damage in acute multiple sclerosis lesions. Brain 120: 393-399. doi:10.1093/brain/120.3.393. PubMed: 9126051. - DOI - PubMed
    1. Schirmer L, Antel JP, Brück W, Stadelmann C (2011) Axonal loss and neurofilament phosphorylation changes accompany lesion development and clinical progression in multiple sclerosis. Brain Pathol 21: 428-440. doi:10.1111/j.1750-3639.2010.00466.x. PubMed: 21114565. - DOI - PMC - PubMed
    1. De Stefano N, Matthews PM, Fu L, Narayanan S, Stanley J et al. (1998) Axonal damage correlates with disability in patients with relapsing-remitting multiple sclerosis. Results of a longitudinal magnetic resonance spectroscopy study. Brain 121: 1469-1477. doi:10.1093/brain/121.8.1469. PubMed: 9712009. - DOI - PubMed

Publication types

MeSH terms